ABSTRACT
Promptly and properly addressing students’ help requests during office hours is a critical challenge for large CS courses. With a large amount of help requests, instructors often find themselves facing a long office hours queue and need to decide who to help next. Most instructors typically select the earliest arrival students (FCFS), while some instructors prioritize students who haven’t been helped recently to ensure fairness. To better understand and quantify how those different strategies affect the queue and students’ experience, we simulated the office hours queue with four different strategies under three different queue loads using the students’ problem-solving behaviors as a guide. Our simulation results show that when the queue is relaxed, different strategies make no difference. When the queue is busy or normal, prioritizing students who haven’t helped today is the best strategy. Moreover, we also discussed how to develop a strategy based on students’ code commit status, and corresponding simulation results indicate those strategies have no impact on the queue.
Keywords
1. INTRODUCTION
Efficiently addressing help requests during office hours is crucial for a large CS course.[10, 9, 25, 7, 26, 27]. However, instructors often receive large batches of requests within a short time, especially near the assignment deadlines. With limited time and resources, it is impossible to provide immediate responses for all students, and instructors must decide whom to help first without knowing how long that help will take. In this work, We call this decision strategy the queue scheduling strategy. In practice, the most popular queue scheduling strategy is First Come First Serve(FCFS); this is straightforward to execute and is expected to minimize overall wait times. However, sometimes students request help repeatedly; in such cases, with FCFS, other students might suffer a longer waiting time while others receive repeat support. To address this, instructors turn to priority scheduling, focusing on students who haven’t been seen that day, or who come rarely. Such priority scheduling can increase fairness but can potentially prolong the overall waiting time. The challenge thus is finding an effective tradeoff between fairness and wait time by quantifying and measuring the impact of switching different scheduling strategies and, moreover, finding under different queue conditions which strategy can achieve optimal queue performance, lower waiting times overall, more requests addressed, and thus more students helped.
If we can anticipate the complexity of student problems, then it is possible to implement the shortest job first (SJF) algorithm, where we prioritize quick answers and, thus, in theory, work through requests more efficiently overall. The SJF algorithm has been proven as a very common and efficient scheduling strategy in various domains[12, 2]. However, his approach is complicated by challenges we face in estimating request time, ambiguous student requests, which are common [10], and cancellations. Thus it is unclear whether an SJF approach could be implemented reliably or, if it was, whether it would yield benefits in practice. In this work, we hypothesize that students’ coding behaviors before the request are accurate indicators of estimated interaction time, and thus tried to build strategies based on students’ coding features before they seek help, and finally run the simulation with those features to see whether such a strategy is useful. This research will first quantitatively measure the impact of choosing different scheduling strategies and thus give instructors explicit guidance on who to select next during OH under different circumstances. Moreover, Online office hours systems can easily use our conclusion to automatically recommend the next student to help.
We aim to answer the following research questions:
- RQ1: Can we measure the impact of different existing queue selection/scheduling strategies under different queue conditions?
- RQ3: Can we develop advanced scheduling strategies by combining students’ code features as well?
To address RQ1, we generated multiple sets of office hours requests under three different queue load conditions, and then simulated how the teacher would address them when choosing different scheduling strategies; then we evaluated the simulation queue through wait time, amount of resolved requests, and amount of students who received help. Finally, to address RQ2, we collected students’ code commit behavior data before they requested help, designed strategies based on those commit features and repeated the simulation to see if those strategies positively impacted the queue.
2. PRIOR WORK
Analyzing students’ behavior during office hours has become popular in recent research. Marwan et al. identify two major unproductive help-seeking behaviors: Help avoidance and help abuse[19], which are also common challenges for office hours. To address the help avoidance problem, instructors start to host office hours online. In our previous work[9], we conducted a comparison between the participation of online and in-person office hours. They also investigated how students’ characteristics relate to changes in the office hour format. The results indicated that online office hours tend to be more motivating and well-received, particularly among female students and students with low confidence. Moreover, Gao et al. [9], Ko et al. [15], and Zahn et al. [27] all found that except for gender, students’ demographic features have little to do with their help-seeking behaviors in office hours. Prior studies of online learning have typically discovered that academic performance is positively related to help-seeking attendance; both Cloude [5] et al. and Guerrero et al. [13]’s research can confirm such a relationship. Griffin et al. [11] aimed to pinpoint specific elements impacting students’ utilization of office hours through their survey at a major public university. They found that the only consistent element influencing students’ engagement with office hours is the value of feedback from instructional staff. Ryan et al. also found that social competence is related to students’ willingness to utilize office hours, where students with weaker social skills tend to avoid help-seeking behaviors [22]. Macwilliam et al. changed their office hours place to a more social place and witnessed an increase in attendance [18].
Although the online office hours addressed the help-avoidance problem, the increasing requests combined with the unaddressed help-abuse problem caused extreme pressure in the office hours queue. The increasingly long queue and wait time have become one of the main complaints in large courses, which in turn worsen the help-abuse problem[8]. To address the long queue, researchers have proposed several solutions, including group session[14] or split deadlines[4]. Although each approach has its merits, they all have different limitations or fairness concerns in practice. For instance, hosting office hours in groups made the debugging difficult since students were not allowed to share code. Therefore, we proposed to improve the queue by simply changing the scheduling strategies, which are easy to implement with much fewer restrictions.
This prior research mainly focuses on investigating who used office hours more often and analyzing the behavior of office hours in isolation. Little research tried combining help-seeking behavioral data with other learning activities like coding behavior. Zsoldos-Marchi[28]emphasizes the importance of cooperative problem-solving in helping students recognize the value of asking for help, especially when confronted with challenging tasks, which, in turn, lowers the tendency to give up. In our prior work[7] we have analyzed students’ coding behavior before, during, and after they sought help in office hours and used a Markov model to represent student’s action sequence; our findings indicate that when students ask questions on addressing test failure, they would be more active to change code before and while waiting for help. Therefore, we believe that good coding behavior contributes to good help-seeking behaviors in return.
Researchers have rarely sought to investigate how teachers select students to help in the office hours queue; thus we aim to fill this gap in this work. In our prior study[8], we tried to apply survival analysis to model students’ patience. In this work, we utilized this approach to generate the wait time for the simulation.
3. DATASET
3.1 Course Information
We collected students’ office hours data from the Fall 2020 offering of a CS2 course taught at an R1, public US university. Three hundred and three students were enrolled in the course. The course teaches object-oriented programming in Java, covering basic data structures, finite state machines, recursion, and software engineering concepts. During the Fall of 2020, the course was taught completely online due to COVID-19. Throughout the semester, students are expected to complete three guided projects (GP1, GP2, and GP3), two large projects (P1 and P2), and 12 lab sessions. To manage students’ code submissions on those assignments, the instructor integrated GitHub repositories into the course.
3.2 Office Hours Data
MyDigitalHand (MDH) [24], a ticketing system for help requests, is used in the course to manage office hours. In order to request help, students must use this system to fill out a form, which will placed in the queue when the office hours session is activated. When a teaching staff is ready to help the next student, they can select a student in the queue and inform them to enter the Zoom meeting and start the interaction. After the interaction ended(resolved), the teacher would return to MDH, close the request ticket in the queue, and be ready for the next request.
During the Fall semester of 2020, all office hours were performed fully online through Zoom. In that semester, there were 16 teaching staff were hired to host office hours sessions for at least two hours per week. At the deadline week for major projects, the teachers hosted extra office hours shifts on demand.
In this study, we collected the request time, start time, cancel time, and the resolved time for each office hours help request through the MDH system. We also defined the time difference between request time and start time as wait time; and the time difference between start time and resolved time as interaction time.
We believe any communication of less than 10 seconds is highly unlikely to resolve any issue, and thus removed them from our dataset.
4. METHODOLOGY
4.1 Tolerable Wait Time Model
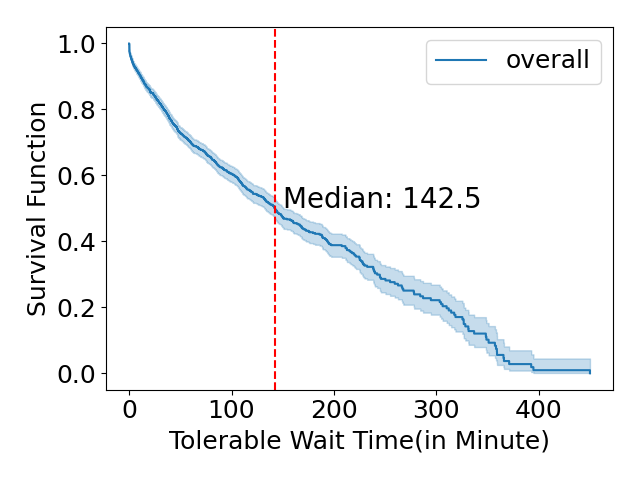
In our previous study[8], we applied the survival analysis on students’ wait time to model students’ patience in the queue. Specifically, when we observe a student canceled the request after waited \(t\) minutes, their max tolerable waiting time for that request is \(t\) minutes; on the contrary, if a student entered the OH interaction without cancellation after waiting \(t\) minutes, their tolerable wait time is at least \(t\) minutes, which can be viewed as a right censored observation in survival analysis. We used the Kaplan-Meir algorithm to calculate the survival function \(S(t)\), which represents students’ tolerable waiting time in a queue(in other words, \(S(t)\) equals the probability that a student can still tolerate and wait in the queue after waiting \(t\) minutes in the queue). the resulting Survival Function is presented in 1
4.2 Simulated Requests
To effectively generate student requests, we need to address four questions: (1) Who raised the request?; (2) When does the request arrive?; (3) How long is the student willing to wait in the queue?; and (4) What is the estimated interaction time? To simplify the simulation process, we sampled and generated each feature independently.
4.2.1 Request Author
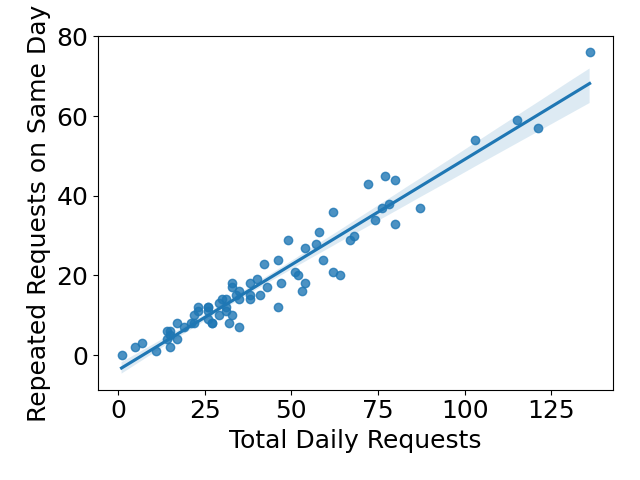
In our simulation, several strategies require us to identify the returning requests. Thus, we generated the author of each request based on the frequency of returning requests. Figure 2 shows that around half of the requests come from someone who already made a request earlier on that day. Therefore, for each request, we set them to be raised by a new student at a probability of 0.5 and assign that request with a new student ID; otherwise, we randomly choose to assign a student who has raised any request before on that day.
4.2.2 Arrival Time
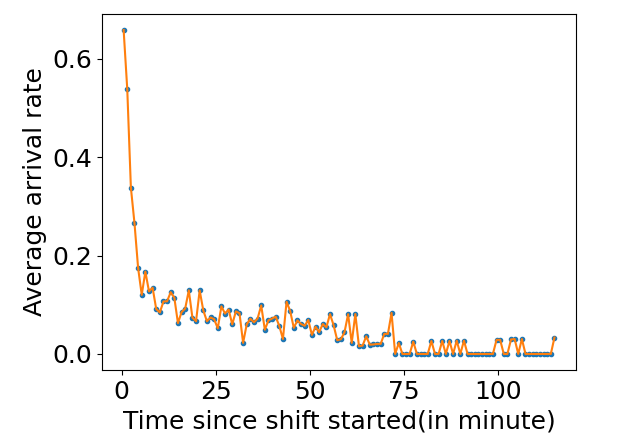
We first calculated how frequently students normally arrive in the queue; based on previous experience, students are more likely to arrive when the shift first starts, so we have reason to believe that the arrival frequency is related to how long the shift has started. Therefore, we merged adjunct shifts if the elapsed time between two shifts is less than 5 minutes, then we calculated the average number of students arriving at the queue per minute(arrival rate \(\lambda \)), results showed in Figure 3, results indicate that for the first five minutes, students are arriving more frequently as we expected, and after that, the arrival rate stabilized at 0.1. Also, we calculated the average arrival rate for the first five minutes, which is 0.4.
Based on those preliminary findings, we opted for three different arrival frequencies, representing three different queue load conditions. Specifically, each queue load has a stabilized arrival rate \(\lambda \); for the first five minutes of each shift, the arrival rate increased to \(4\lambda \). We defined the queue load as busy, normal, and relaxed when \(\lambda \) equals 0.15, 0.1, and 0.05.
With the rules and arrival rates above, we generate students’ request time using Poisson Arrival Process [3], since each student arrival event is independent of each other and thus future arrivals are independent of the current queue length(students can’t see how many people in the queue before they raise request). Such a method is popularly used in queue simulation as well.[16, 21, 1]
4.2.3 Generate Estimated Interaction Time
Interaction time is generated based on the distribution of real interaction time data; specifically, we randomly select a real request with an interaction time longer than 10 seconds and set the target requests to the same amount.
4.2.4 Generate Estimated Max Wait Time
We used the derived survival function in section 4.1 to generate the maximum wait time for each request. Firstly we generate a random number \(p\) between 0 and 1; then, we try to calculate the largest number \(t\), where \(S(t)>p\). Then we say \(t\) is the maximum amount of time students are willing to wait in queue for that request.
4.3 Simulation and Evaluations
For our simulation, we used the same shift schedule in 2020-10-08, which is the deadline for a major project and is considered one of the busiest OH days. The first shift starts at 9 AM, and the last one ends at 8 PM. During the shift, there were only three breaks(11:15-11:45,1:00-1:30, and 2:30-3:00). We repeatedly generated requests on that day 100 times under three different queue load conditions. Thus, we have a total of 300 sets of requests generated for simulation.
For each set of generated requests, we simulated the queue process on when each request was raised, canceled, started, and completed. Between a request is completed and the next one starts, we randomly set an elapsed time in a range of 0-60 seconds to simulate the time the teacher fills the feedback form on MDH or takes a short break. We repeat the simulation for each set of requests with four different strategies.
- FCFS: This scheduling strategy is the most common strategy, as we discussed. The instructor would strictly select the request that comes the earliest to resolve under this strategy. This strategy should result in a lower overall wait time.
- New Student First (NSF): In this strategy, the teacher will first examine students in the queue and choose those who have not yet received any help on the given day; if the teacher couldn’t find one, they would choose students based on FCFS. This strategy gives priority to students who haven’t been helped on that day, and thus should help to increase the amount of daily helped students.
The next two strategies aim to find a trade-off between FCFS and NSF. Generally, we still give priority to students who haven’t got any help yet, but in order to avoid extreme wait time, we would give a higher priority to students who have waited a certain amount of time in the queue.
- Long Wait First (LWF): In this strategy, we first choose the earliest request which has been in queue for at least \(t\) minutes, where survival function in RQ1 \(S(t)<0.8\); if such request doesn’t exist, we switch to NSF instead.
- Very Long Wait First (VLWF): In this strategy, we first choose the earliest request which has been in queue for at least \(t\) minutes, where survival function in RQ1 \(S(t)<0.5\); if such request doesn’t exist, we switch to NSF instead.
Each simulation was evaluated based on the following metrics: AVG/Median wait time, percentage of long wait requests(>2h), percentage of resolved requests, and percentage of students who received help. Then we compared those metrics among three queue load conditions and performed Mann–Whitney U tests[20] to identify any significant difference in those metrics between any pair of strategies.
4.4 Simulate with Coding Features
Implementing an SJF-based selection strategy requires reliably estimating students’ problems, something which is not possible based on their requests alone [10]. In this study, we instead examine the code commit behavior before the request was raised and analyze their correlation to interaction time. Specifically, we calculated the number of commits within 1 hour before the request was raised, the elapsed time between the latest commit and the request time, and the line of change (LOC) in the latest commit. Then we calculated the Pearson correlation coefficient[6] between those code features and the request’s interaction time.
We hypothesize that good coding behavior represents students are more actively seeking answers to their questions, and thus the communication should be more effective during office hours interaction, which should result in a shorter interaction time. Therefore, we build three more strategies: (1) Choose students with the highest commit frequency before the request (2)Choose students with the lowest elapsed time between the last commit and raised request (3) Choose the students with the largest LOC in the latest commit.
We repeated the simulations with those new strategies under normal load conditions. We reused the data generated in RQ2 after first generating the commit status (the metrics above) for each request. Therefore, we generate those metrics for each simulated request by copying the metric in a random real request, and of course, the interaction time needs to be set correspondingly.
5. RESULTS
5.1 RQ1 Results
| Busy | Normal | Relax
| ||||
|---|---|---|---|---|---|---|
| strategy | AVG | MED | AVG | MED | AVG | MED |
| FCFS | 81.0 | 77.6 | 50.6 | 44.4 | 17.6 | 7.3 |
| NSF | 76.6 | 68.5 | 48.2 | 37.2 | 17.7 | 6.7 |
| LWF | 81.1 | 77.8 | 50.6 | 42.3 | 17.9 | 6.7 |
| VLWF | 80.7 | 70.9 | 50.4 | 37.5 | 18.0 | 6.8 |
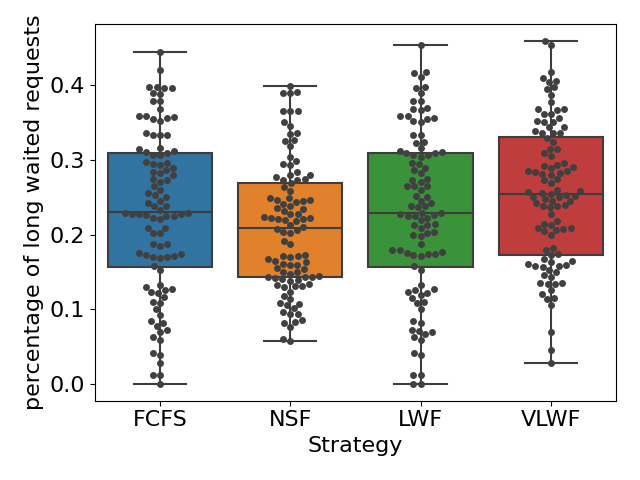
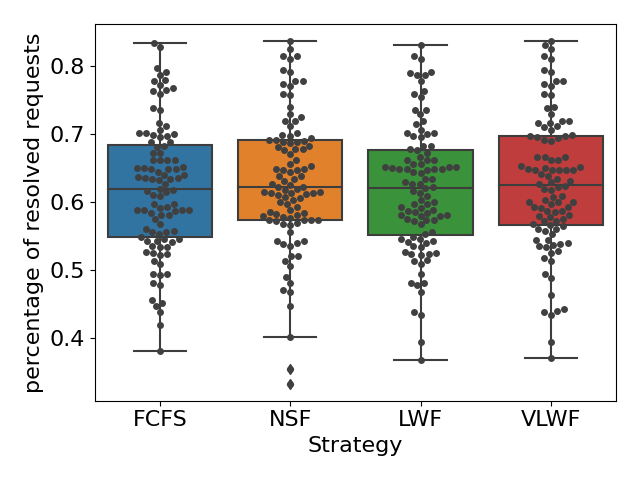
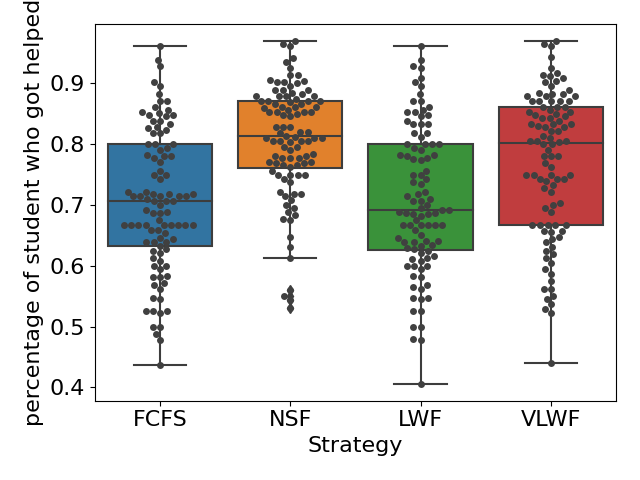
For RQ1, we simulated the queue under three different types of load conditions. We found that when the queue was busy (\(\lambda =0.15\)), on average, 45% of the requests would get resolved for all four strategies (see Figure4(a)), and we didn’t find any significant difference (\(p>0.05\) for all pairs). However, when we calculated the percentage of students who received help, the NSF strategy appears to be significantly higher than the other three (\(p<0.01\)); on average, around 65% of the students would receive help if the teacher used the NSF strategy, while only around 54% of the students would receive help if one of the other three strategies was applied (as shown in Figure4(b)). Figure5(a) tells us that NSF has a slightly lower percentage of long wait requests than FCFS, 22% of requests in FCFS and 20% of requests in NSF are longer than 2 hours; however, such difference is not significant (\(p=0.09\)).
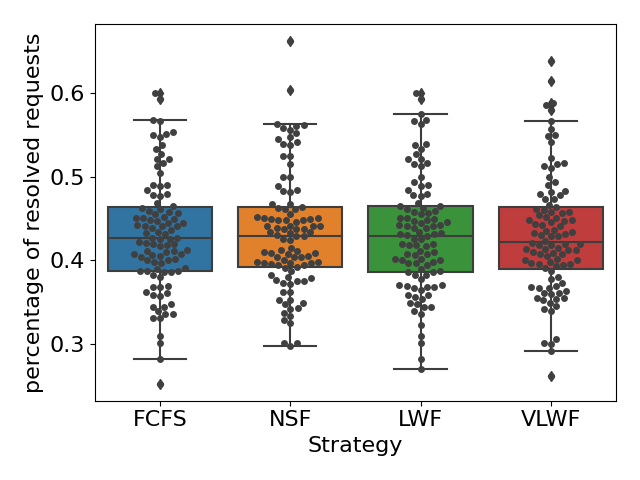
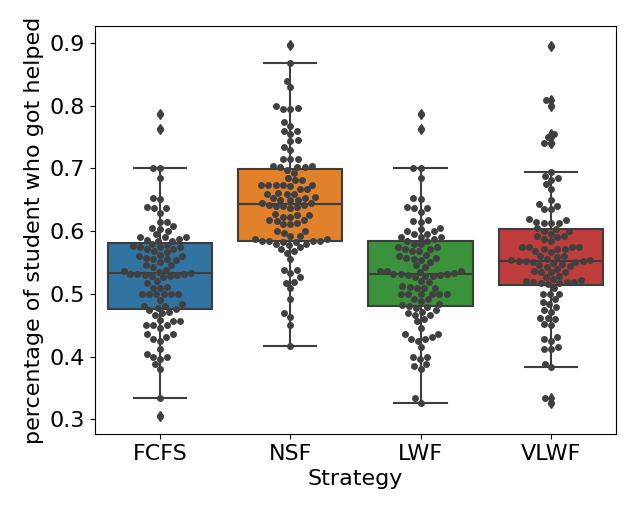
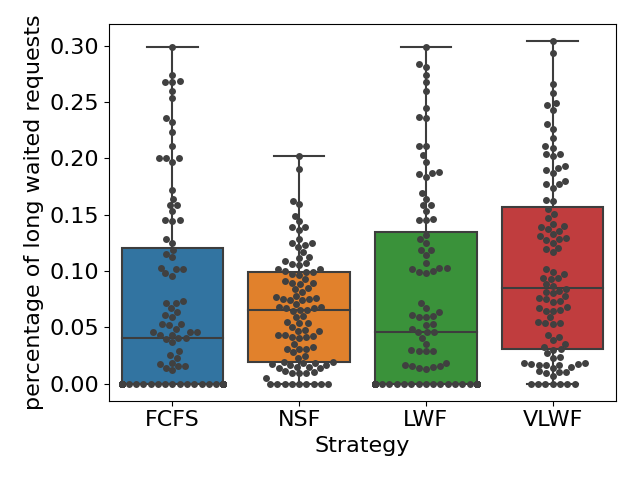
When the queue was at normal load (\(\lambda =0.10\)), we observed similar results with the busy load condition in Figure 6 and Figure 5(b). No significant difference in the percentage of resolved requests was found among all four strategies (\(p>0.05\) for all pairs); on average, 65% of the requests would get resolved no matter which scheduling strategy was applied. When the teacher applied the FCFS strategy, 70% of the students would at least receive one help on average, while when the scheduling strategy changed to NSF, this percentage would increase to 82%, and such difference is significant as well (\(p<0.01\)). Moreover, we observed a slight increase in long wait requests when choosing NSF (6%) compared with FCFS (4%); this difference is not significant as well (\(p=0.10\)).
We also found that when the queue was relaxed(\(\lambda =0.05\)), the percentage of long wait requests was almost always 0. We did not observe any significant difference in those metrics among all four strategies (all \(p>0.05\)).Therefore, choosing any different strategy would not affect the amount of resolved requests or students who received help (see Figure 7).
Moreover, we repeated the simulation with 20 different arrival rates \(\lambda \), ranging from 0.05 to 0.10, and found that when \(\lambda >0.06\), the significant difference in the percentage of helped students exists (\(p<0.05\)). In other words, when \(\lambda >0.06\), choosing NSF over FCFS can significantly increase the percentage of students who receive help.
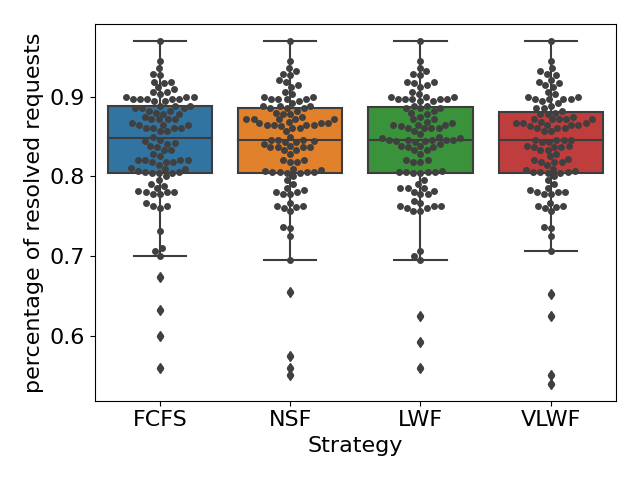
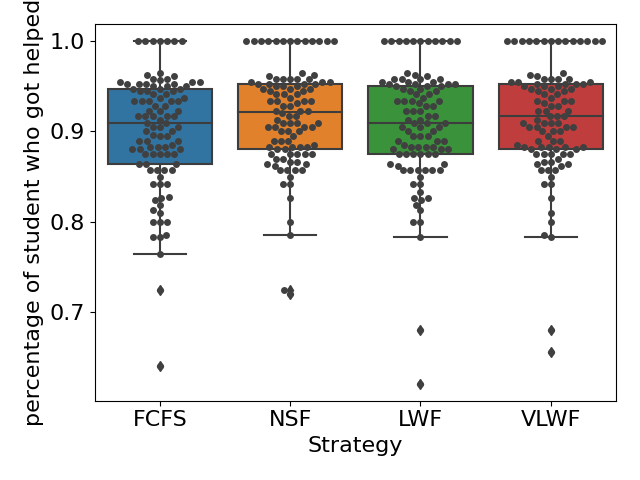
Table 1 summarized the average and median wait time for all simulations. We did not find any significant difference in students’ wait time when choosing different scheduling strategies (all pair \(p>0.05\)). Under a busy queue, students would wait in the queue for around 80 minutes on average; when the queue load is normal, the average wait time drops to 50 minutes; and when the load is relaxed, the average wait time is only 18 minutes. In summary, the choice of scheduling strategies does not significantly impact students’ overall wait time.
In summary, our simulation results indicated that under a normal or busy queue load, choosing the next student based on the NSF strategy could greatly increase the number of students receiving help without prolonging the waiting time, and thus, it is the optimal strategy. When the arrival rate \(\lambda \) drops to 0.6 students per minute, the queue becomes relaxed, and the choice of scheduling strategy does not affect the queue at all.
5.2 RQ2 Results
We tracked students’ code commits before they raised a request and while they waited in the queue and calculated the Pearson correlation of their code features and the interaction time for each request. Results are in Table 2, and we could not find any correlation between the requests’ interaction time and any code commit features.
| code feature | r | p-value |
|---|---|---|
| commit frequency before | 0.0035 | 0.913 |
| last commit elapse time | -0.0017 | 0.984 |
| last commit LOC | 0.0098 | 0.852 |
We then simulated the normal load again with the strategies listed in section 4.4. However, the results show that compared with the FCFS strategy, using code commit features strategies does not yield any significant difference in resolved requests, helped students, long wait requests, and overall wait time.
6. LIMITATIONS
We defined the three types of queue load conditions by three different arrival rates; although the designated value of those arrival rates can be supported by our preliminary research and actual student data, it is still a simplified model of estimating when students arrive at the queue. In practice, students’ arrival time could be influenced by the time of the day, their personal schedules, or other factors we cannot collect or measure. Moreover, our data come from one semester from a single course, and the results might only be limited to such courses. In the future, we need to verify our results in more semesters as well.
7. CONCLUSIONS AND DISCUSSIONS
In RQ1, we find that the choice of scheduling strategy does not affect the total number of resolved requests. When the queue is busy or normal, the NSF strategy would significantly increase the number of students who received help by 10%. And since the NSF strategy does not have a significant impact on the overall wait time or the percentage of long wait requests, we believe that this is the optimal strategy when the queue is normal or busy (when \(\lambda >0.06\)). However, when we had a relatively relaxed (when \(\lambda <0.06\)) office hours queue, our findings suggest no matter which strategy is applied, most of the requests (>80%) would get resolved, and there is no difference among those four strategies. Instructors could choose FCFS as their scheduling strategy since it is the easiest one to implement.
In RQ2, we could not find any relationship between the help requests’ interaction time, and the corresponding commit behavior before the request is raised. Therefore, when choosing the next students to help based on those features, we failed to build strategies for SJF scheduling. In other words, we could not find the requests that could be quickly resolved based on the commit features. So it is not a surprise to us that when simulated with those strategies, the performance is not better than FCFS at all. However, there are still other potential coding behaviors we can utilize in the future; we can identify some efficient coding behaviors and explore their relationship with the OH interaction time; should we find any effective predictor for the interaction time, it is highly possible to develop a SJF strategy and thus potentially achieve a higher number of daily resolved request.
We recommend the instructors use NSF for online office hours queue scheduling. However, when the office hours are hosted in person, FCFS is more appropriate. Based on instructors’ observation, students rarely return to in-person office hours on the same day because of the cost of going to a physical queue. Therefore, the NSF’s advantage disappears for in-person office hours settings. Secondly, since the students can actually see who is in the queue, they would definitely complain once they see someone arrive late but get help early.
Furthermore, one possible solution to address the long queue during office hours is to make the waiting time productive for students. For example, tools like CodeHelp[17, 23] can utilize the LLM to automatically generate answers to students’ coding questions without directly revealing solutions. Thus, instructors could view it as an option to assist students while they are waiting.
Moreover, what is ‘fairness’ is still a complicated question when choosing the next student to help. In this work, we focus on ensuring every student who needs help receives at least one office hour interaction in a given day. On the other hand, we also need to consider how much effort each student committed to their question before they sought help; it is unfair to help students exploit office hours for debugging support while keeping students who truly tried everything and are still struggling to wait in the queue. Therefore, in the future, we will try to evaluate students’ efforts and struggles through their coding activity, and provide a more ‘fair’ scheduling strategy for instructors to use.
8. ACKNOWLEDGEMENTS
This material is based upon work supported by NSF under grants #1821475 “Concert: Coordinating Educational Interactions for Student Engagement” Collin F. Lynch, Tiffany Barnes, and Sarah Heckman (Co-PIs).
9. REFERENCES
- S. L. Albin. On poisson approximations for superposition arrival processes in queues. Management Science, 28(2):126–137, 1982.
- M. A. Alworafi, A. Dhari, A. A. Al-Hashmi, A. B. Darem, and Suresha. An improved sjf scheduling algorithm in cloud computing environment. In 2016 International Conference on Electrical, Electronics, Communication, Computer and Optimization Techniques (ICEECCOT), pages 208–212, 2016.
- V. Benes. On queues with poisson arrivals. The Annals of Mathematical Statistics, pages 670–677, 1957.
- H. Chen, A. Li, G. Challen, and K. Cunningham. Implementation of split deadlines in a large cs1 course. In Proceedings of the 55th ACM Technical Symposium on Computer Science Education V. 1, SIGCSE 2024, page 193–199, New York, NY, USA, 2024. Association for Computing Machinery.
- E. B. Cloude, R. S. Baker, and E. Fouh. Online help-seeking occurring in multiple computer-mediated conversations affects grades in an introductory programming course. In LAK23: 13th International Learning Analytics and Knowledge Conference, LAK2023, page 378–387, New York, NY, USA, 2023. Association for Computing Machinery.
- I. Cohen, Y. Huang, J. Chen, J. Benesty, J. Benesty, J. Chen, Y. Huang, and I. Cohen. Pearson correlation coefficient. Noise reduction in speech processing, pages 1–4, 2009.
- Z. Gao, B. Erickson, Y. Xu, C. Lynch, S. Heckman, and T. Barnes. You asked, now what? modeling students’ help-seeking and coding actions from request to resolution. Journal of Educational Data Mining, 14(3):109–131, Dec. 2022.
- Z. Gao, A. Gaweda, C. Lynch, S. Heckman, D. Babalola, and G. Silva de Oliveira. Using survival analysis to model students’ patience in online office hour queues. In Proceedings of the 55th ACM Technical Symposium on Computer Science Education V. 2, SIGCSE 2024, page 1646–1647, New York, NY, USA, 2024. Association for Computing Machinery.
- Z. Gao, S. Heckman, and C. Lynch. Who uses office hours? a comparison of in-person and virtual office hours utilization. In Proceedings of the 53rd ACM Technical Symposium on Computer Science Education V. 1, SIGCSE 2022, page 300–306, New York, NY, USA, 2022. Association for Computing Machinery.
- Z. Gao, C. Lynch, S. Heckman, and T. Barnes. Automatically classifying student help requests: a multi-year analysis. In Proceedings of The 14th International Conference on Educational Data Mining, EDM ’21, pages 81–92, 2021.
- W. Griffin, S. D. Cohen, R. Berndtson, K. M. Burson, K. M. Camper, Y. Chen, and M. A. Smith. Starting the conversation: An exploratory study of factors that influence student office hour use. College Teaching, 62(3):94–99, 2014.
- H. Gu, R. Yu, Z. Li, X. Wang, and F. Zhou. Esdi: Entanglement scheduling and distribution in the quantum internet. In 2023 32nd International Conference on Computer Communications and Networks (ICCCN), pages 1–10. IEEE, 2023.
- M. Guerrero and A. B. Rod. Engaging in office hours: A study of student-faculty interaction and academic performance. Journal of Political Science Education, 9(4):403–416, 2013.
- J. R. Hott, M. Floryan, and N. Basit. Towards more efficient office hours for large courses: Using cosine similarity to efficiently construct student help groups. In Proceedings of the 55th ACM Technical Symposium on Computer Science Education V. 2, SIGCSE 2024, page 1684–1685, New York, NY, USA, 2024. Association for Computing Machinery.
- S.-H. Ko and K. Stephens-Martinez. What drives students to office hours: Individual differences and similarities. In Proceedings of the 54th ACM Technical Symposium on Computer Science Education V. 1, SIGCSE 2023, page 959–965, New York, NY, USA, 2023. Association for Computing Machinery.
- M. A. Lariviere and J. A. Van Mieghem. Strategically seeking service: How competition can generate poisson arrivals. Manufacturing & Service Operations Management, 6(1):23–40, 2004.
- M. Liffiton, B. E. Sheese, J. Savelka, and P. Denny. Codehelp: Using large language models with guardrails for scalable support in programming classes. In Proceedings of the 23rd Koli Calling International Conference on Computing Education Research, pages 1–11, 2023.
- T. M. MacWilliam and D. J. Malan. Scaling office hours: managing live q&a in large courses. 2012.
- S. Marwan, A. Dombe, and T. W. Price. Unproductive help-seeking in programming: What it is and how to address it. In Proceedings of the 2020 ACM Conference on Innovation and Technology in Computer Science Education, ITiCSE ’20, page 54–60, New York, NY, USA, 2020. Association for Computing Machinery.
- P. E. McKnight and J. Najab. Mann-whitney u test. The Corsini encyclopedia of psychology, pages 1–1, 2010.
- D. R. McNeil. A solution to the fixed-cycle traffic light problem for compound poisson arrivals. Journal of Applied Probability, 5(3):624–635, 1968.
- A. M. Ryan and P. R. Pintrich. " should i ask for help?" the role of motivation and attitudes in adolescents’ help seeking in math class. Journal of educational psychology, 89(2):329, 1997.
- B. Sheese, M. Liffiton, J. Savelka, and P. Denny. Patterns of student help-seeking when using a large language model-powered programming assistant. In Proceedings of the 26th Australasian Computing Education Conference, ACE ’24, page 49–57, New York, NY, USA, 2024. Association for Computing Machinery.
- A. J. Smith, K. E. Boyer, J. Forbes, S. Heckman, and K. Mayer-Patel. My digital hand: A tool for scaling up one-to-one peer teaching in support of computer science learning. In Proceedings of the 2017 ACM SIGCSE Technical Symposium on Computer Science Education, SIGCSE ’17, page 549–554, New York, NY, USA, 2017. Association for Computing Machinery.
- M. Smith, Y. Chen, R. Berndtson, K. M. Burson, and W. Griffin. " office hours are kind of weird": Reclaiming a resource to foster student-faculty interaction. InSight: A Journal of Scholarly Teaching, 12:14–29, 2017.
- M. Zahn, I. Gransbury, S. Heckman, and L. Battestilli. Assessment of self-identified learning struggles in cs2 programming assignments. In Proceedings of the 2023 Conference on Innovation and Technology in Computer Science Education V. 1, ITiCSE 2023, page 264–270, New York, NY, USA, 2023. Association for Computing Machinery.
- M. Zahn and S. Heckman. Observations on student help-seeking behaviors in introductory computer science courses. In Proceedings of the 54th ACM Technical Symposium on Computer Science Education V. 2, SIGCSE 2023, page 1380, New York, NY, USA, 2023. Association for Computing Machinery.
- I. Zsoldos-Marchis. Influence of cooperative problem solving on students’control and help-seeking strategies during mathematical problem solving. Acta Didactica Napocensia, 7(3), 2014.