ABSTRACT
Metacognitive information has been shown to be related to performance in learning tasks. We investigated feelings of difficulty (FOD) in the context of university-level mathematics and asked whether and to what extent they predict performance. To this end, we conducted an experiment with 90 students and six experienced lecturers. We carefully designed a test of linear algebra tasks and recorded FOD through self-reporting in two phases with the students and in one with the lecturers. The results show that both instances of FOD can predict the outcome with an accuracy well above the baseline. We noticed significant differences in the reporting of FOD before and after solving tasks. Moreover, FOD differ in relation to the level of confidence for groups of good and weak performers among students. We also proposed a workflow that leverages machine learning and FOD to individualize education mathematics instruction.
Keywords
INTRODUCTION
There have been various attempts to use different types of features and models to predict students' ability levels in certain tasks, their likelihood of solving such tasks, or to model the 'learner' more generally. Much valuable work has been done by communities researching these questions in fields like educational data mining and artificial intelligence in education (see [2, 3, 10]). In this context, various machine learning models – from classical models to advanced neural network architectures – and strategies were employed to model the learner and predict learning outcomes and performance. Some of the widely used modeling strategies within learning analytics and in educational data mining include ‘knowledge tracing’ (see [5, 21, 30, 31], to mention just a few).
Cognitive scientists, on the other hand, are also concerned with finding good predictors of learning outcomes and performance that are based on cognitive processes and can be studied with the tools developed in their field. Metacognition is one of the categories of concepts used in an attempt to understand learning. Metacognitive information refers to the awareness, knowledge, or feelings that humans have about their own thoughts or thinking processes. This can be summarized as 'thinking about thinking' [18, 25]. Various concepts of metacognition, such as judgments of learning (JOL), feelings of learning (FOL), feelings of knowing (FOK), and feelings of difficulty (FOD), have been studied. They play an important role in cognitive science and education research, as they have been shown to help regulate learning ([8, 14, 25, 34]). JOL, for instance, have been widely explored with the goal of understanding metacognitive monitoring and were shown to be a good predictor of performance and learning success in tasks such as word-pair learning [17, 28, 29].
Although metacognitive information cannot be measured directly, there is neuro-scientific imaging research that analyzes aspects of metacognition. For instance, neural correlates for JOL for memory formation tasks were studied in [22]. It is shown that there are two distinct activated brain regions associated with actual and predicted memory formation and one common region (lateral and dorsomedial prefrontal cortex) associated with both predicted and actual encoding success. Similar discussions about the neural basis of other metacognitive concepts have been reviewed in [19].
Because it cannot be measured directly, metacognitive information is usually collected through self-reporting. For instance, for JOL, subjects may be asked to report on a scale from 0 to 100 how likely they think they are to remember a newly learned word in a foreign language after one week. There are several ways to categorize metacognitive notions. Metacognitive information can be classified into two categories: one type that is collected prospectively (i.e., before attempting a task) and one that is collected after performing a task, which is called retrospective (see [19]).
Some recent work [1] has studied different ways of providing metacognitive interventions in the context of intelligent tutoring systems (ITSs). Deep reinforcement learning has been employed for an adaptation of dynamic changes in students’ metacognitive levels.
Accordingly, crucial aspects of metacognition information include: how to measure it, how effective it is as a predictor of performance, and whether such data are biased (e.g., self-reporting bias) see [6, 20, 33]. One relevant example is the overconfidence bias, where people consistently overestimate their ability to solve tasks or recall information from memory [9, 16, 24, 27, 32]. Self-reported information can lead to results contrary to the actual performance, learning outcomes, or the effectiveness of learning or instructional strategies. Feelings of learning (FOL) were studied in [7] at the university level, and different modes of instruction were compared. They showed that students’ perception of learning is not always aligned with the actual outcome. Students in an active learning setting (as opposed to traditional passive lecturing) had lower feelings of learning, despite having a better outcome. Another important aspect of reporting is the accuracy of judging others. For instance, [23] shows a high correlation (r=0.80) between teachers’ judgments and an objective evaluation measure. When it comes to judging others, whether one makes an over- or underestimated judgment depends on the type and difficulty of the tasks [27].
There are ways to enhance the collection of metacognitive information so as to increase its predictive power (for performance prediction). It was pointed out in [29, 35] that one should not rely on short-term memory (STM), that is, to ensure that the feedback is based solely on long-term memory (LTM). This helps to avoid the potential negative impact of noise stemming from STM.
In this study, we deal with the notion of feelings of difficulty (FOD), which was introduced and studied in [11–13]. According to study [12], FOD are online metacognitive experiences that provide a subjective estimation of task difficulty. They are thought to arise as a reaction of people to the difficulty of a task. FOD were collected by asking subjects to self-report on a given scale how difficult they believe a task is. They were studied in the context of high-school-level mathematics and word-pair learning success [11, 12, 17].
Much research on task difficulty focuses on objective measures of complexity. The relation of objective and subjective measures of difficulty to performance is intricate [26] and thus requires further studying.
Collecting FOD does not require one to first attempt to solve a task and thus FOD can be collected prospectively. They can also be collected retrospectively, and we will make use of both. The core question underlying this study is whether FOD are effective predictors of performance for advanced mathematics tasks. This can be further specified to understand the predictive power and differences between prospective and retrospective variants of FOD and how these relate to confidence.
To this end, we conducted a study with 90 first-year undergraduate university students, in which they had to solve a mathematics test of 20 carefully designed multiple-choice tasks in linear algebra. We used reporting on the interval [0,100] for FOD, which are collected at two different times in the experiment, once before and once after attempting to solve the tasks – a prospective and a retrospective variant. We call the retrospective instance of FOD “judgments of difficulty” (JOD), since the student had the chance to inspect the possible answers and attempt to solve the tasks. Despite its similar naming, this is to be distinguished from JOL.
We trained various machine learning models to predict the outcome (whether tasks are solved correctly or not). Both the prospective and the retrospective variants of FOD have been shown to be good predictors of solving success, with the latter leading to significantly better results. We also asked the lecturers to report FOD on the same exercises as the students. Interestingly, FOD provided by the lecturers led to better prediction results than those provided by students. Moreover, there are significant differences in the reporting of FOD and JOD between male and female students. Additionally, students were asked to report how difficult they think their peers will find the overall test before attempting to solve the test (which we call “peer OFOD”, or POFOD for short) and after solving the test (called “peer OJOD”, or POJOD for short).
To our knowledge, this is the first study of FOD on university-level linear algebra material. Furthermore, it is the first to use a 0–100 self-reporting scale in the context of FOD. Thanks to this scale, considerations about absolute FOD can be approached similarly as discussed in [29] about JOL.
Ours differs from other studies of FOD, like [11–13] and [15], in that we deal with:
- University-level (linear algebra) tasks.
- Students from four different engineering programs.
- Multiple-choice exercises with four choices.
- A diverse set of tasks covering a broad range of difficulty levels and topics in linear algebra.
- FOD reporting on the interval [0,100] instead of a Likert scale.
- Experimental design that allows answering questions about FOD at different time intervals.
- FOD reporting by students and lecturers.
- Overall FOD measured at two points in time (OFOD, OJOD).
Moreover, we trained various machine learning models to predict the outcome of performance based on features such as FOD, JOD, OFOD, and OJOD.
Methodology
Participants
This study involved six parallel cohorts of engineering students attending linear algebra lectures as part of four different study programs at a Swiss university, with each lecture taught by a different lecturer. A total of n=90 participants (79 males and 11 females), divided into six distinct groups (n1=11, n2=12, n3=14, n4=15, n5=15, n6=23), voluntarily enrolled into the study. The age of the participants ranged from 19 to 49 years (the latter being an outlier), with a mean age of 22.35 and SD=3.36. Written consent was obtained from all participants, authorizing their participation in the study and the anonymous use of their data for future research purposes.
Materials
We designed a test of 20 multiple-choice linear algebra tasks, each containing four possible answers, of which only one is correct. They were thematically aligned with the material covered in the lecture up to one week prior to our experiment. The level of difficulty varied across the tasks, ranging from very simple to challenging, while most of the tasks were of moderate to upper-moderate difficulty. This made it possible to study whether students can discriminate between different difficulty levels. Instances of these tasks included straightforward tasks, such as computing the sum of two vectors, and more complex ones that require a good understanding of fundamental notions. Neither the lecturers nor the students had any prior information about the specific content of the exercises or the detailed nature of the experimental design.
Procedure
The students were informed during a prior lecture that an experimental study with voluntary participation would be conducted the following week. On test day, they received an introduction to the experiments that were to be conducted and were reminded that participation was voluntary. The academic directors of the different study programs had already provided consent for the study's execution. Subsequently, interested students were asked to read and sign a consent form. Additionally, they were made aware of the relevant data protection laws of the canton of Zurich.
The study was divided into two successive parts, with instructions reiterated and clarified as needed. The procedures were uniformly implemented across each of the six groups. Figure 1 depicts the different steps in the process. During the first part of the study, students were presented with mathematical exercises on PowerPoint slides that were projected on the wall and were well-readable by all students. The students were instructed to subjectively evaluate the difficulty of each exercise and to write down a value between 0 and 100 on a paper form. Each task was displayed for a duration of precisely 15 seconds, punctuated by a click tone, and followed by a blank slide lasting two seconds before the subsequent task was displayed. This sequence proceeded automatically, ensuring consistency in timing across all groups. The exercises were presented in a random order generated by a random number generator (implemented using Python).
After the initial segment, a break of three minutes was given. Following the break, students were informed that they would continue with a 25-minute multiple-choice test encompassing the 20 exercises already rated in terms of FOD. The exercises were presented on the test sheet in a new random order.
Thus, in this study, students had to rely on LTM in both reporting for the first FOD since they had not seen the tasks prior to reporting but covered these topics in the lectures in prior weeks. Moreover, for the second reporting, students most likely relied only on LTM as they saw each of the 20 tasks in the first reporting for only a short amount of time. Then there was a three-minute break plus time for instruction and for a random reordering of the tasks. This procedure is shown in Figure 1 below. Note that the subjects were asked to report FOD also after attempting to solve the exercise (called JOD). After each task, there was a field on the paper form, in which they were to report how difficult they found the task.
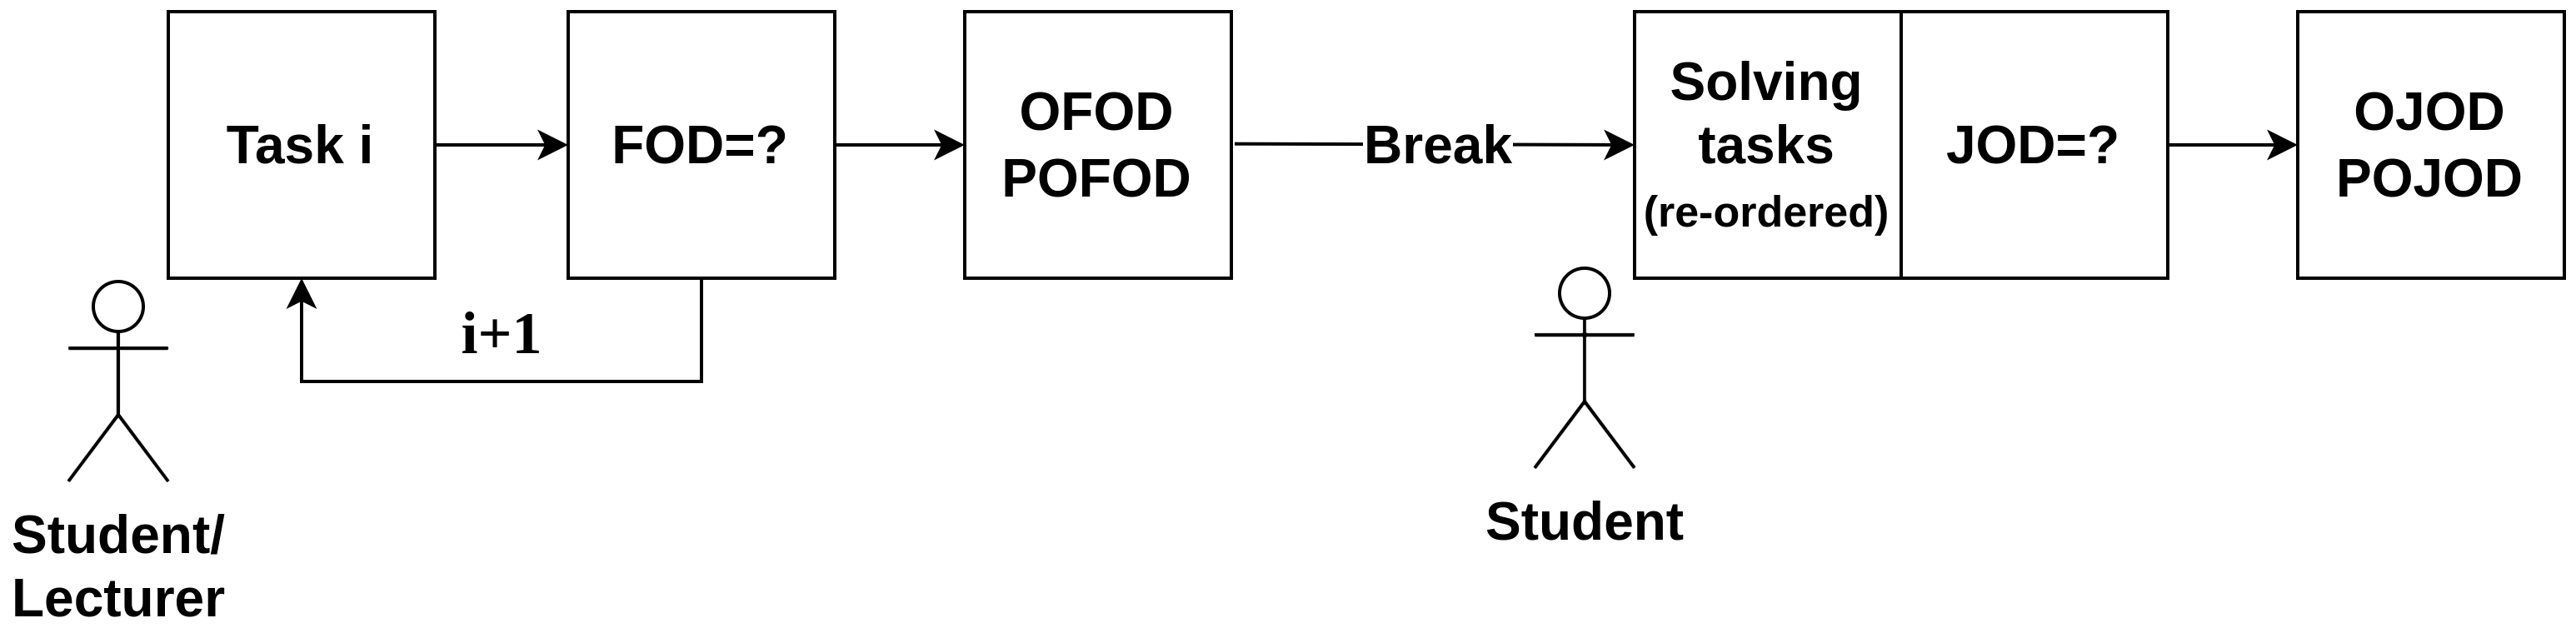
Both the break and the random reordering were employed to mitigate potential biases in solving the tasks and in reporting JOD and overall judgments of difficulty (OJOD), that is, the overall perceived difficulty of the test, for which we asked the student: “How difficult do you find the entire list of tasks?”. Moreover, subjects were asked to report how they perceived the OJOD of their peers, called POJOD: “How difficult do you think your colleagues find the entire list of tasks?”
On completing the test, students were required to fill out a form to report the number of midterm exams written and their grade in the last midterm exam. Notably, some classes had completed a midterm exam but had not yet received their grades, which resulted in missing information for these subjects.
Data pre-processing and variables
We analyzed the dataset with regard to missing values, especially for FOD, JOD, and related variables. For each model that is trained on these variables, we removed the missing values. Furthermore, there were instances where none of the possible answers were chosen. Like in any exam, these exercises were counted as incorrectly solved. In many such cases, no JOD value was reported. In section 3.1 below we present the dataset used.
Overconfidence is a phenomenon relevant when analyzing the relationship between student ability and reporting of metacognitive information. We will introduce some variables to analyze whether students are overconfident when reporting FOD and JOD, and whether FOD reported by better students are better at predicting outcome than those reported by weaker students. This is a phenomenon that has been studied for other metacognitive reporting, such as JOL.
Variable | Description |
|---|---|
FOD | Feelings of difficulty |
JOD | Judgements of difficulty (i.e., same as FOD but reported after attempting to solve the tasks) |
OFOD | Overall feelings of difficulty for whole test |
FODLEC | FOD reported by lecturers |
POFOD | Peer OFOD, i.e., how difficult the students think their peers reported OFOD after the first time of reporting all the FOD (but prior to attempting to solve the tasks) |
OJOD | Overall JOD, i.e., how difficult the student judges the entire test to be after attempting to solve all exercises |
POJOD | Peer OJOD, i.e., how students think their peers reported OJOD |
Performance group | Good performers (students that solved at least half of the tasks correctly) and weak performers (solved less than half of the tasks correctly) |
When it comes to confidence, we asked whether students can be shown to report higher or lower FOD or JOD across all reported values for correctly and incorrectly solved tasks and whether these differ between good and weak performers. The statistical significance of the differences between the two groups of students (good and weak performers) was tested using the non-parametric Mann-Whitney U test. Table 2 below provides an overview of the results.
Prediction models and evaluation
There are several considerations when predicting the solving success that guided our choices of machine learning models. Firstly, we wanted to rely on interpretable models or those that are explainable and that potentially allow for learning scientific insights, which is an important criterion according to [4]. We used three machine learning model types, namely logistic regression, decision trees, and random forest.
Training and evaluation of each model were conducted across different feature subsets of the set of variables defined in Section 2.4. For each feature subset, we dropped only the missing values for these features so as to guarantee the use of as much of the available data as possible. We employed splitting the data into 80% training and 20% test set and ensured that all observations of a subject to lay entirely in either the training or the test set. This was done to avoid bias from testing on observations of subjects whose data was already used in the training. Before training, we standardized the features to ensure uniformity (which is not necessary for the tree-based models used).
The performance of the best model from GridSearchCV was evaluated using five-fold cross-validation for accuracy, recall, precision, F1-score, and the area under the curve (AUC) of the receiver operating characteristic (ROC) curve. For logistic regression, we searched through the values [0.01, 0.1, 0.3, 5, 10, 100] for the regularization parameter. For decision trees, the search ranged through [None, 2, …, 20] for the maximal depth, and for random forest, it included [10, 50, 100, 500] for the number of trees. For each model and feature subset, we calculated the mean and standard deviation of the cross-validated metrics. This approach provided a robust assessment of the model's performance, accounting for variability in the data.
Results
In this section, we discuss the results of the questions mentioned above. Table 2 shows the mean FOD and mean JOD (denoted by and , respectively) for different groups and scenarios (e.g., for correctly or incorrectly solved tasks). It also highlights whether the differences in reporting across groups are statistically significant. Table 3 shows different performance metrics for three model types (logistic regression, decision trees, and random forest) for different feature sets.
Exploratory data analysis
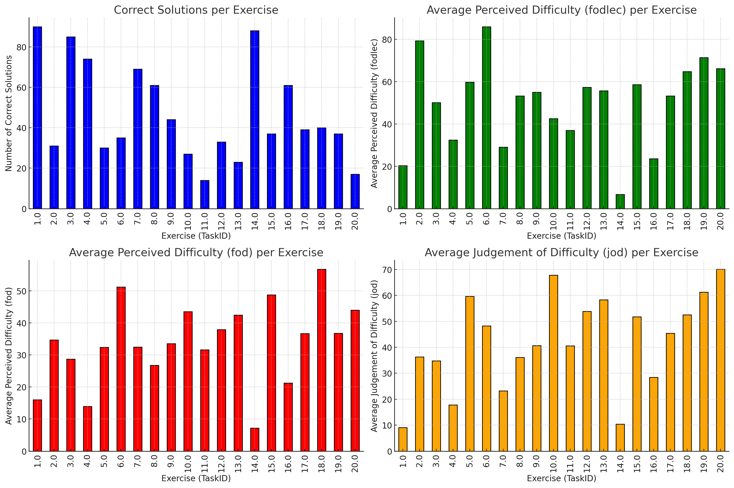
Of the 1,800 (=90 students x 20 tasks) observations, 935 exercises were solved correctly and 865 answers were incorrect, representing moderately imbalanced classes. There are 92 missing JOD values and one missing FOD value. Figure 2 shows the distributions of the most relevant variables analyzed by an exercise identifier. One lecturer reported no FOD on the tasks, while another did not report FOD values for five out of 20 tasks.
FOD-JOD differences and confidence
Table 2 provides an overview of the mean FOD (denoted by ) and the mean JOD (denoted by ) across all observations for tasks solved correctly and incorrectly and is further categorized by the two groups (good performers and weak performers). The differences in and between these two groups are statistically highly significant (p-value <.01) across all tasks and for incorrectly solved tasks, but not significant for correctly solved tasks, as shown in Table 2. Note that one can adopt a more conservative approach to evaluate the significance of the scenarios in Table 2 since multiple statistical tests were conducted simultaneously. Applying a Bonferroni correction – using a threshold p-value of .01 divided by the number of statistical tests – yields significant results for all cases that are significant in Table 2, except for the case of good performers for correctly solved tasks and mean JOD difference between males and females.
The criterion for distinguishing between good and weak performers is guided by the widely accepted testing practice of deeming an exam passable when approximately half of the tasks are solved correctly. Notably, these results are stable with respect to varying the criterion on a wide range of values (for instance, good performers as those who solved more than 60% of the tasks). Moreover, a significant difference in the mean values reported for all tasks between students and lecturers has been observed.
Table 2 shows significant differences between the reporting of FOD and JOD across all entries, except for the scenarios involving correctly solved tasks. In this regard, there is no difference between good performers and weak performers. Testing the differences of means of OJOD and POJOD yields statistically significant results (p<.01) across all students and when categorized by performance level, distinguished between good and weak performers. This significance is even more pronounced when comparing the means of OFOD and OJOD.
p-value | p-value | ||||
|---|---|---|---|---|---|
Good performers | 30.97 | 38.18 | <.01 | <.01 | <.01 |
Weak performers | 38.56 | 48.17 | <.01 | ||
Good performers incorrectly solved | 36.86 | 51.13 | <.01 | <.01 | <.01 |
Weak performers incorrectly solved | 44.87 | 60.11 | <.01 | ||
Good performers correctly solved | 27.20 | 29.91 | <.01 | >.05 | >.05 |
Weak performers correctly solved | 29.52 | 31.06 | >.05 | ||
Students | 33.82 | 41.40 | <.01 | <.01 | -- |
Lecturers | 49.55* | -- | -- | ||
Females | 27.15 | 38.84 | <.01 | <.01 | <.05 |
Males | 34.75 | 41.77 | <.01 | ||
*This is the mean FODLEC (i.e., the mean FOD reported by lecturers).
As for the differences in reporting between the two groups, significant differences are observed for FOD across all tasks and for incorrectly solved tasks, but not for correctly solved tasks for weak performers. This suggests that for correctly solved tasks, the mean reporting of FOD by weak performers is remarkably consistent.
Interestingly, we see significant results (p = 0.005) for correctly solved tasks for good performers. The analysis in the difference of reporting between FOD and JOD further corroborates this observation, indicating that no significant differences were detected for correctly solved tasks, regardless of whether the analysis involved differences between FOD and JOD or across good and weak performers.
The analysis, particularly of incorrectly solved tasks, reveals that good performers exhibit significantly higher confidence levels (reporting lower FOD for wrongly solved tasks), regardless of whether FOD or JOD are used as a measure of confidence. However, the confidence sharply drops from FOD to JOD. The difference between FOD and JOD might be an interesting measure of change in confidence and requires careful study. For instance, one could define a subjective change in confidence by analyzing FOD-JOD.
Predictions
Table 3 represents various performance metrics for predicting the solving success of tasks based on the different features, such as FOD reported by students and lecturers before and after attempting to solve the tasks. As for the area under the curve (AUC) of the ROC curve, a simple logistic regression model based solely on the feature JOD outperformed all other feature sets with an AUC of 0.73 (+/- 0.05), and the same result was achieved using both JOD and FOD in combination.
This was expected, as the students had the possibility to review and consider the possible solutions provided in the multiple-choice tasks. Another noteworthy observation is that the FOD provided by lecturers (i.e., FODLEC) predicted the solving success more accurately than FOD reported by students. We observed a maximal AUC of 0.68 (+/- 0.09) for FODLEC versus 0.64 (+/- 0.04) for FOD (reported by students). This indicates that, on average, lecturers provided a more objective estimation of difficulty, which might be due to a higher confidence bias among students. However, there is a higher standard deviation among the reporting lecturers. Additionally, FOD and FODLEC do not provide complementary information for predicting the solving success. This is evident from the lack of increase in AUC when the two are combined. However, FOD and JOD combined achieved the highest recall (the lowest number of false negatives, i.e., exercises solved correctly but predicted as solved incorrectly) among all feature combinations. On the other hand, FODLEC attained the highest precision (similarly, but concerning false positives). It is important to note that FODLEC was reported by the lecturers, while the labels were provided by students. This discrepancy suggests that the lecturers’ perceived difficulty aligns with students’ performance to some extent. To better understand this dynamic, further research is necessary.
Features | Model | Accuracy | Recall | Precision | F1 Score | AUC |
|---|---|---|---|---|---|---|
FODLEC | Logistic Regression | 0.55 (+/- 0.06) | 0.68 (+/- 0.16) | 0.57 (+/- 0.06) | 0.61 (+/- 0.08) | 0.62 (+/- 0.12) |
Decision Tree | 0.63 (+/- 0.08) | 0.59 (+/- 0.09) | 0.71 (+/- 0.13) | 0.64 (+/- 0.07) | 0.68 (+/- 0.09) | |
Random Forest | 0.62 (+/- 0.07) | 0.65 (+/- 0.10) | 0.66 (+/- 0.08) | 0.64 (+/- 0.08) | 0.68 (+/- 0.09) | |
FOD | Logistic Regression | 0.60 (+/- 0.04) | 0.69 (+/- 0.07) | 0.60 (+/- 0.05) | 0.64 (+/- 0.05) | 0.64 (+/- 0.04) |
Decision Tree | 0.60 (+/- 0.03) | 0.71 (+/- 0.06) | 0.59 (+/- 0.03) | 0.64 (+/- 0.03) | 0.63 (+/- 0.04) | |
Random Forest | 0.60 (+/- 0.03) | 0.73 (+/- 0.07) | 0.59 (+/- 0.03) | 0.65 (+/- 0.03) | 0.63 (+/- 0.04) | |
JOD | Logistic Regression | 0.68 (+/- 0.04) | 0.73 (+/- 0.06) | 0.70 (+/- 0.04) | 0.72 (+/- 0.03) | 0.73 (+/- 0.05) |
Decision Tree | 0.68 (+/- 0.04) | 0.73 (+/- 0.06) | 0.70 (+/- 0.04) | 0.70 (+/- 0.03) | 0.72 (+/- 0.05) | |
Random Forest | 0.68 (+/- 0.04) | 0.73 (+/- 0.06) | 0.70 (+/- 0.04) | 0.71 (+/- 0.04) | 0.72 (+/- 0.05) | |
{FOD, JOD} | Logistic Regression | 0.68 (+/- 0.04) | 0.74 (+/- 0.06) | 0.70 (+/- 0.06) | 0.71 (+/- 0.04) | 0.73 (+/- 0.05) |
Decision Tree | 0.68 (+/- 0.04) | 0.71 (+/- 0.07) | 0.70 (+/- 0.05) | 0.71 (+/- 0.04) | 0.72 (+/- 0.05) | |
Random Forest | 0.63 (+/- 0.04) | 0.71 (+/- 0.05) | 0.66 (+/- 0.03) | 0.68 (+/- 0.03) | 0.68 (+/- 0.05) |
FOD-ML workflow
There are many ways to use FOD to inform mathematics instruction. Figure 3 depicts such a strategy. An instructor would show students different exercises on topics already covered in a lecture and ask students to self-report FOD. This would usually happen in an exercise class. Using FOD and potentially other (historical) data (like past exam grades and performances on similar tasks), one can predict, using machine learning, the expected performance for the new tasks. This can then be used to rank the tasks according to the likelihood of being solved correctly by the students and to help the instructor give further input or split students into groups to work together on certain weaknesses.
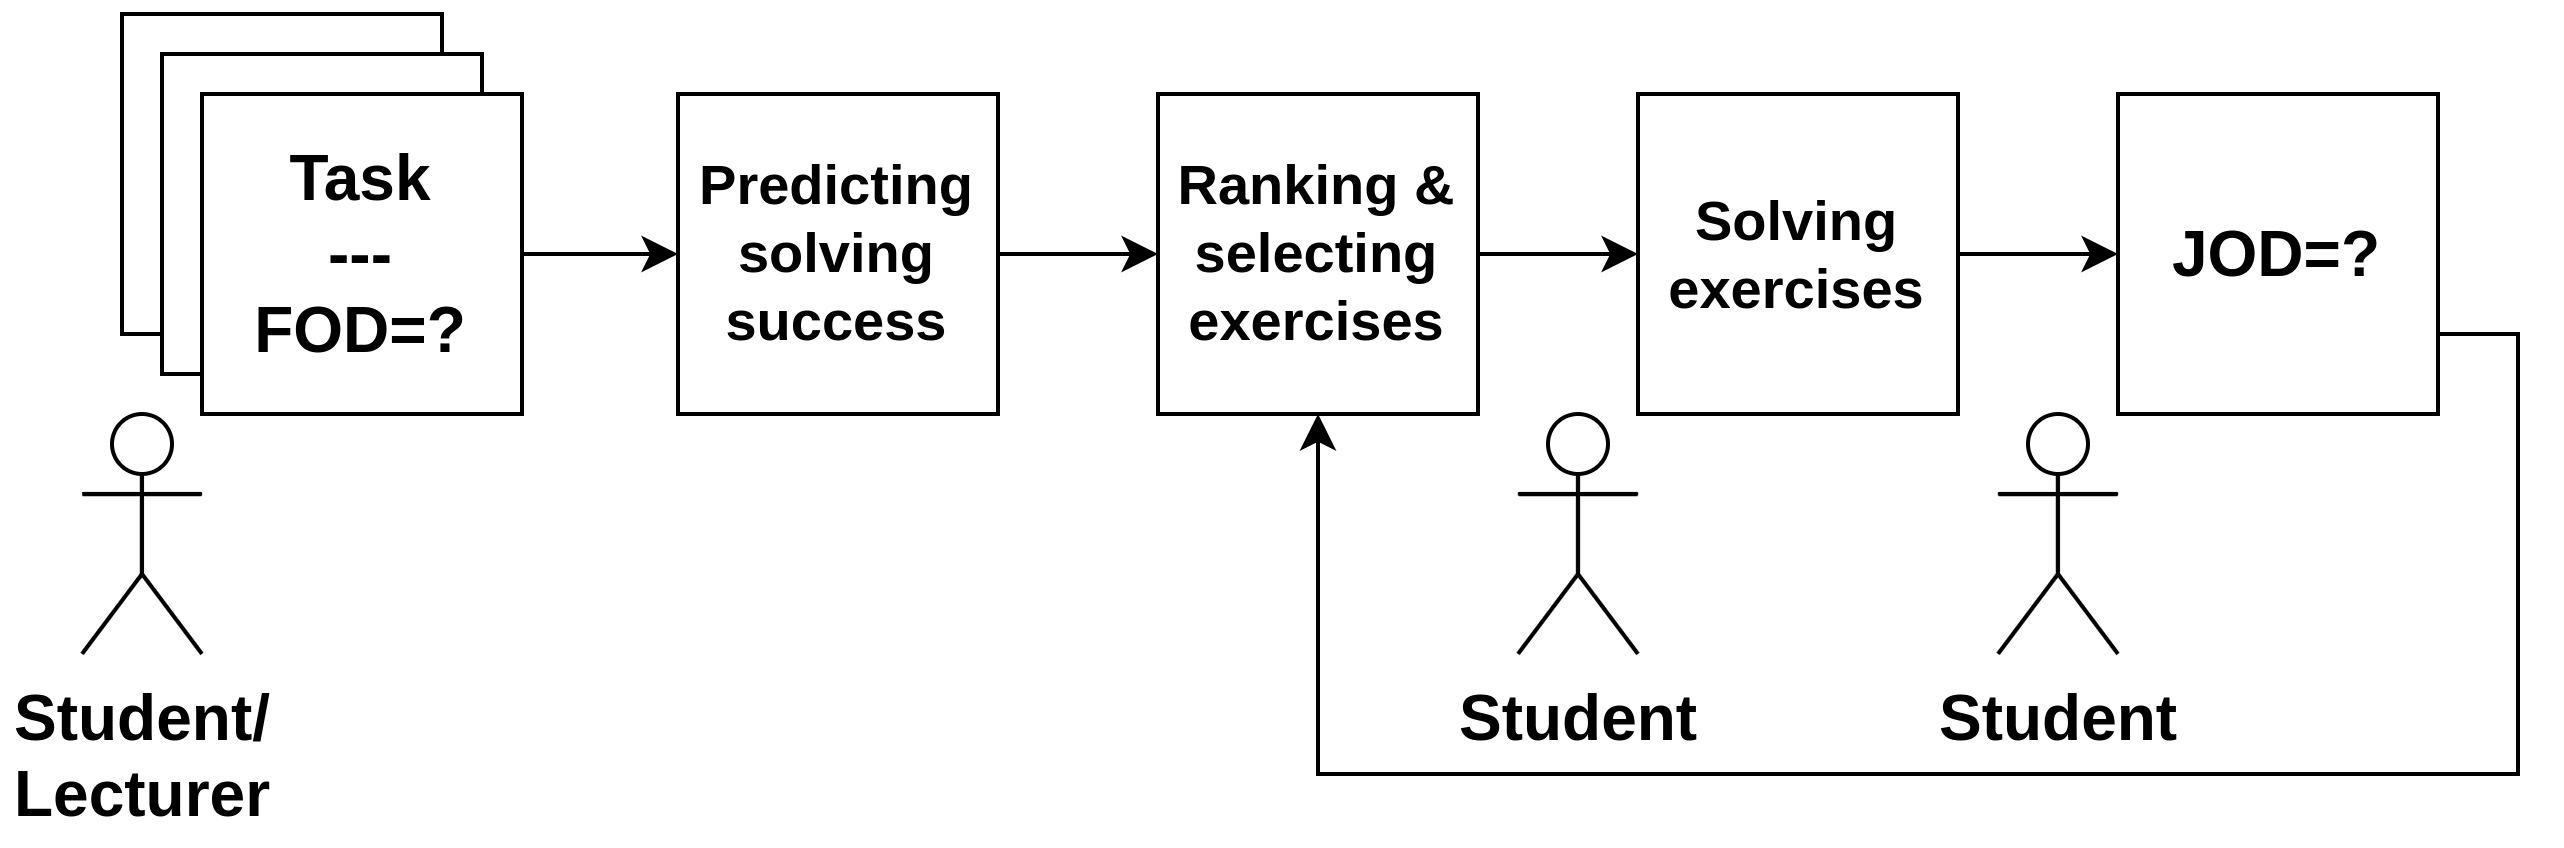
After attempting to solve the tasks, students may then report JOD, and this data can be used to make better predictions, adapt the learner model, analyze different aspects of confidence change (from FOD to JOD), and similar. Such a workflow can be easily incorporated into modern intelligent tutoring systems or similar systems that allow data mining and analysis.
Discussion
There is still a lot of potential for increasing and bridging the progress and knowledge gained in the fields of machine learning in education (and related areas) and insights into learning from cognitive science. This paper is one in a line of attempts to use metacognitive information to this end. However, further studies using even more diverse data, such as neuroscientific data (e.g., from brain imaging) and other sensorial and behavioral data, to model learning and the learner should be conducted.
In this study, we show that FOD measured at different times in the learning process of advanced mathematics and for different groups (good and weak performers, students, lecturers, etc.) differ significantly. Incorporating different FOD variants as features in machine learning models proved to be valuable for performance prediction. Since FOD collection is time-efficient and therefore does not interfere too much with the rest of the process, FOD present a unique opportunity to be used, in conjunction with machine learning models, as a powerful tool to adapt and individualize (advanced) mathematics learning. This study provides further evidence in this direction. Furthermore, this study, as well as existing literature, shows that both subjective and objective aspects of difficulty can provide valuable information for understanding, adapting, and modeling learning processes and learners. Since FOD in particular have not yet been studied extensively, we conclude with some questions that we believe are valuable for further research:
- What are the common aspects modeled by both objective and subjective measures of difficulty and in what way are they complementary?
- Are there neural correlates for FOD similar to JOL that indicate specific neural activity when humans perceive difficulty in solving tasks?
- What is the predictive power of these neural correlates, should they exist, and do they contribute to mitigating self-reporting biases?
- How effective are workflows like the one presented in Section 3.4.
Limitations
The present study is limited in several respects. First, a more thorough analysis of the relationship between subjective and objective notions of difficulty should be conducted. This includes understanding exactly what subjective perceptions of difficulty encode and how they provide complementary information compared to objective notions. Furthermore, concepts such as FOD could be linked to important aspects of mathematics teaching, such as anxiety. This would require careful studies to demonstrate the relationship between FOD and anxiety and how changing FOD (through interventions) relates to changes in anxiety. Another relevant area of work would be to identify which metacognitive strategies could be used with the help of FOD to increase the effectiveness of mathematics instruction. These strategies could be tested in workflows similar to the one shown in Figure 3.
ACKNOWLEDGMENTS
We thank all participants who took part in this study. We also thank Sadi Sulejmani, Mazlum Saracoglu, and Sinisa Petrovic for assisting with data collection, and the anonymous reviewers for their helpful comments that enhanced the readability of this paper.
REFERENCES
- Abdelshiheed, M., Hostetter, J.W., Barnes, T. and Chi, M. 2023. Leveraging Deep Reinforcement Learning for Metacognitive Interventions Across Intelligent Tutoring Systems. International Conference on Artificial Intelligence in Education, 291–303. Cham: Springer Nature Switzerland.
- Baker, R.S., Martin, T. and Rossi, L.M. 2016. Educational data mining and learning analytics. The Wiley handbook of cognition and assessment: Frameworks, methodologies, and applications. (2016), 379–396.
- Chen, L., Chen, P. and Lin, Z. 2020. Artificial intelligence in education: A review. Ieee Access. 8, (2020), 75264–75278.
- Conati, C., Porayska-Pomsta, K. and Mavrikis, M. 2018. AI in Education needs interpretable machine learning: Lessons from Open Learner Modelling. arXiv preprint arXiv:1807.00154. (2018).
- Corbett, A.T. and Anderson, J.R. 1994. Knowledge tracing: Modeling the acquisition of procedural knowledge. User modeling and user-adapted interaction. 4, (1994), 253–278.
- Craig, K., Hale, D., Grainger, C. and Stewart, M.E. 2020. Evaluating metacognitive self-reports: systematic reviews of the value of self-report in metacognitive research. Metacognition and Learning. 15, 2 (Aug. 2020), 155–213. DOI:https://doi.org/10.1007/s11409-020-09222-y.
- Deslauriers, L., McCarty, L.S., Miller, K., Callaghan, K. and Kestin, G. 2019. Measuring actual learning versus feeling of learning in response to being actively engaged in the classroom. Proceedings of the National Academy of Sciences. 116, 39 (2019), 19251–19257.
- Dinsmore, D.L., Alexander, P.A. and Loughlin, S.M. 2008. Focusing the conceptual lens on metacognition, self-regulation, and self-regulated learning. Educational psychology review. 20, (2008), 391–409.
- Dunlosky, J. and Rawson, K.A. 2012. Overconfidence produces underachievement: Inaccurate self evaluations undermine students’ learning and retention. Learning and Instruction. 22, 4 (2012), 271–280.
- Dutt, A., Ismail, M.A. and Herawan, T. 2017. A systematic review on educational data mining. Ieee Access. 5, (2017), 15991–16005.
- Efklides, A., Papadaki, M., Papantoniou, G. and Kiosseoglou, G. 1997. Effects of Cognitive Ability and Affect on School Mathematics Performance and Feelings of Difficulty. The American Journal of Psychology. 110, 2 (1997), 225–258. DOI:https://doi.org/10.2307/1423716.
- Efklides, A., Papadaki, M., Papantoniou, G. and Kiosseoglou, G. 1998. Individual differences in feelings of difficulty: The case of school mathematics. European Journal of Psychology of Education. 13, 2 (Jun. 1998), 207–226. DOI:https://doi.org/10.1007/bf03173090.
- Efklides, A., Samara, A. and Petropoulou, M. 1999. Feeling of difficulty: An aspect of monitoring that influences control. European Journal of Psychology of Education. 14, 4 (Dec. 1999), 461–476. DOI:https://doi.org/10.1007/bf03172973.
- Efklides, A., Schwartz, B.L. and Brown, V. 2017. Motivation and affect in self-regulated learning: does metacognition play a role? Handbook of self-regulation of learning and performance. Routledge. 64–82.
- Efklides, A. and Vlachopoulos, S.P. 2012. Vol. 28(3):227-239. Measurement of metacognitive knowledge of self, task, and strategies in mathematics. European Journal of Psychological Assessment (2012).
- Erat, S., Demirkol, K. and Sallabas, M.E. 2022. Overconfidence and its link with feedback. Active Learning in Higher Education. 23, 3 (2022), 173–187.
- Fazlija, B. and Ibrahim, M. 2022. Using Metacognitive Information and Objective Features to Predict Word Pair Learning Success. Artificial Intelligence in Education. Posters and Late Breaking Results, Workshops and Tutorials, Industry and Innovation Tracks, Practitioners’ and Doctoral Consortium (Cham, 2022), 222–226.
- Flavell, J.H. 1979. Metacognition and cognitive monitoring: A new area of cognitive–developmental inquiry. American psychologist. 34, 10 (1979), 906.
- Fleming, S.M. and Dolan, R.J. 2012. The neural basis of metacognitive ability. Philosophical Transactions of the Royal Society B: Biological Sciences. 367, 1594 (2012), 1338–1349.
- Fleming, S.M. and Lau, H.C. 2014. How to measure metacognition. Frontiers in Human Neuroscience. 8, (2014).
- Ghosh, A., Heffernan, N. and Lan, A.S. 2020. Context-aware attentive knowledge tracing. (2020), 2330–2339.
- Kao, Y.-C., Davis, E.S. and Gabrieli, J.D. 2005. Neural correlates of actual and predicted memory formation. Nature neuroscience. 8, 12 (2005), 1776–1783.
- Kaufmann, E. 2020. How accurately do teachers’ judge students? Re-analysis of Hoge and Coladarci (1989) meta-analysis. Contemporary Educational Psychology. 63, (Oct. 2020), 101902. DOI:https://doi.org/10.1016/j.cedpsych.2020.101902.
- Klayman, J., Soll, J.B., Gonzalez-Vallejo, C. and Barlas, S. 1999. Overconfidence: It depends on how, what, and whom you ask. Organizational behavior and human decision processes. 79, 3 (1999), 216–247.
- Livingston, J.A. 2003. Metacognition: An Overview. (2003).
- Maynard, D.C. and Hakel, M.D. 1997. Effects of objective and subjective task complexity on performance. Human Performance. 10, 4 (1997), 303–330.
- Moore, D.A. and Cain, D.M. 2007. Overconfidence and underconfidence: When and why people underestimate (and overestimate) the competition. Organizational Behavior and Human Decision Processes. 103, 2 (2007), 197–213.
- Nelson, T.O. 1993. Judgments of learning and the allocation of study time. Journal of Experimental Psychology: General. 122, 2 (1993), 269–273. DOI:https://doi.org/10.1037/0096-3445.122.2.269.
- Nelson, T.O. and Dunlosky, J. 1991. When People’s Judgments of Learning (JOLs) Are Extremely Accurate at Predicting Subsequent Recall: The “Delayed-JOL Effect.” Psychological Science. 2, 4 (1991), 267–270.
- Pelánek, R. 2017. Bayesian knowledge tracing, logistic models, and beyond: an overview of learner modeling techniques. User Modeling and User-Adapted Interaction. 27, (2017), 313–350.
- Piech, C., Bassen, J., Huang, J., Ganguli, S., Sahami, M., Guibas, L.J. and Sohl-Dickstein, J. 2015. Deep knowledge tracing. Advances in neural information processing systems. 28, (2015).
- Pulford, B.D. and Colman, A.M. 1997. Overconfidence: Feedback and item difficulty effects. Personality and individual differences. 23, 1 (1997), 125–133.
- Rosenman, R., Tennekoon, V. and Hill, L.G. 2011. Measuring bias in self-reported data. International Journal of Behavioural and Healthcare Research. 2, 4 (2011), 320–332.
- Veenman, M.V., Van Hout-Wolters, B.H. and Afflerbach, P. 2006. Metacognition and learning: Conceptual and methodological considerations. Metacognition and learning. 1, (2006), 3–14.
- Wescourt, K.T. and Atkinson, R.C. 1973. Scanning for information in long-and short-term memory. Journal of Experimental Psychology. 98, 1 (1973), 95.