ABSTRACT
The problem of student dropout in higher education has gained significant attention within the Educational Data Mining research community over the years. Since student dropout is a major concern for the education community and policymakers, many research studies aim to evaluate and uncover profiles of students at-risk of dropping out, allowing timely intervention. Many students who eventually drop out of university display signs during their first year of studies, thus early identification of these students is both beneficial and feasible. Prediction studies typically use administrative data, encompassing a wide range of student attributes, as well as learning behavior data from an institute’s learning management system. In this study, we evaluate the early prediction of at-risk students within a traditional classroom setting at a higher education institute through machine learning methods, particularly Neural Networks and XGBoost. In an attempt to generalize our results, we compare different fields of study, namely exact and social sciences. Our results show that integrating learning behavior has little effect on prediction quality metrics. We also propose a novel aggregated ’studentship’ feature, containing both cognitive and social elements, which improves the AUC metric for XGBoost at early stages of the semester. Furthermore, our results indicate that prediction patterns vary among different fields of study. We believe this research presents a compelling case study and provides several valuable insights into the expanding corpus of studies on dropout prediction in higher education.
Keywords
1. INTRODUCTION & RELATED WORK
The dropout phenomenon in higher education has gained significant attention within the Educational Data Mining (EDM) research community over the years, as researchers strive to reveal its origins and characteristics. Notably, various institutions, such as those in the US, report alarmingly high dropout rates, with approximately 30% of students discontinuing their studies before reaching their second year in colleges and universities [4]. This pervasive issue contributes to adverse effects on students, educational institutions, and the broader economy. The repercussions extend to taxpayers, who bear a substantial financial burden funding the education of students unable to complete their studies [21].
Given that the challenge of student dropout is a significant concern for students, the entire education community and policymakers [3], research has been conducted to evaluate and uncover profiles of students at-risk of dropping out. Dropout stems from a variety of factors, including academic, socio-economic, and psychological. Profiling and identifying students at risk of dropout can assist educational stakeholders in providing the support needed to help them remain enrolled in the institutions [1].
To address the student dropout problem, identification of at-risk students at an early stage is needed. Early identification has the potential to enable proactive engagement by university staff to help those students who need support. Many students who eventually drop out of university display signs during their first year of studies, thus early identification of these students is both beneficial and feasible [5].
Research on student dropout prediction has its origins in the 1970s, with Tinto [40] discussing the specifications, conditions and various student characteristics linked to the dropout phenomenon. The study formulated a model incorporating these elements, particularly socio-economic factors, learning behavior and course grades. Recent research endeavors employ advanced techniques for identifying students at-risk of dropping out of their studies, utilizing novel EDM methodologies and machine learning methods applied on institutional databases [4, 7, 9, 12, 15, 27, 37]. This allows efficiently predicting students at-risk and unveiling the factors contributing to the dropout phenomenon, therefore minimizing the need for exhaustive student profiling efforts. Machine learning algorithms learn patterns from given data, in order to predict values or labels in new data. These algorithms achieve valuable insights by uncovering hidden patterns on large datasets, thus there is an increase in their adoption in many diverse disciplines including finance, transportation, retail and many more. The choice of a machine learning model is typically influenced by the educational setting context, which aligns with the data semantics. Several recent studies highlighted the prominence of tree-based machine learning models, including Decision Trees (DT), Random Forest (RF) and Extreme Gradient Boosted Trees (XGBoost) [11], for addressing the student dropout problem [2, 23, 31], particularly when dealing with tabular data [20]. Kemper et al. [25] found that DT performing slightly better compared to their Logistic Regression (LR) model, and requires fewer features. Martins et al. [29] highlighted the effectiveness of RF for handling imbalanced data. Asselman et al. [2] found XGBoost to outperform other models, optimized with GridSearch. However, some papers found Neural Networks (NN) to perform better. Nagy and Molontay [30] focused on high school achievements, with Gradient Boosted Trees and NN showcasing the highest AUC scores. Baranyi et al. [6] used both XGBoost and NN, with NN performing better after GridSearch optimization. Lastly, Kostopoulos et al. [26] demonstrated superior NN performance in AUC and F1 scores.
Studies in a traditional classroom setting often use administrative data, encompassing a wide range of student attributes such as prior academic achievements, college admission scores and social-demographic information. Students are mandated to provide these attributes, which are considered highly reliable, during enrollment [8]. Course achievements, in particular final grades, are often used for prediction, but they are logged into the institute’s database only at the end of the semester. Another source of data frequently employed in higher education institutions derives from the institute’s Learning Management System (LMS), which captures the student learning activities during the semester, including video views, forum participation, assignment grades, submission times and more. Bird et al. [9] explored the impact of LMS data integration along with administrative data, by using RF applied on various datasets, with and without LMS data. Their results indicated that LMS integration enhanced the prediction accuracy for first-year students but not for returning students. Furthermore, they evaluated predictions at various time intervals, by categorizing the LMS data features into temporal groups. This division included features extracted solely from the first quarter of the semester, and those encompassing data from the entire semester. They found that augmenting the dataset with information obtained from the first quarter, alongside the data available at the end of the semester, enhances prediction accuracy. This suggests that the initial displayed learning behavior of students contributes to the prediction process, a conclusion that was also observed by Tamada et al. [39].
In addition to a traditional classroom setting, online learning environments, in particular Massive Online Open Courses (MOOCs), gained significant interest in recent years. MOOCs entail somewhat distinct datasets compared to traditional administrative records and related research studies are mainly focused on a single course setting rather than a full degree or academic semesters. Online platforms capture the students’ interactions with the course’s material, including videos, mouse clicks, assignments and more, which are referred to as clickstream features [14, 36]. Hence, contemporary research on students dropout in MOOCs environments tends to utilize these clickstream features, when applying machine learning methods [13, 22, 41, 42].
The educational experience model as constructed by Garrison et al. [18], contains three core elements: Social Presence, which relates to students’ communication with each other; Cognitive Presence, which relates to students’ interaction with the course material; Teaching Presence, which relates to students’ communication with the instructors / lecturers. Swan [38] suggested that the LMS activities can be divided into these three elements, for example forum participation can be considered as a Social Presence attribute and assignments grades are related to Cognitive Presence. Accordingly, Moodle LMS presents two of these elements as Cognitive Depth and Social Breadth1. Buschetto Macarini et al. [10] evaluated whether students dropout prediction can be enhanced using this LMS activities division, by adding a separate counter feature for each core element. They concluded, however, that these three counters show no improvement compared to a single counter aggregating the three counters.
In this study, we evaluate the early prediction of at-risk students within a traditional classroom setting at a large local university through machine learning methods, utilizing the university’s administrative and LMS data to assess the latter’s impact on prediction quality. We categorize the data into three aspects - Pre-Entry, Learning-Behavior and Achievements. Pre-Entry relates to information provided by the student during enrollment, sourced from the administrative database. Learning-Behavior is associated with data depicting students’ behavior during the semester, collected from the LMS database. Achievements are related to final course grades and failures, also obtained from the institute’s administrative database. Specifically, we employ XGBoost and Neural Network models in order to address our primary research inquiries:
- Balancing the trade-off between early prediction and model performance - at which point in time during an academic semester is it most advantageous to predict student dropout?
- Is collecting LMS data valuable for enhancing the prediction of student dropout?
- What distinctions exist among faculties regarding prediction accuracy and the reasons for student dropout?
The remainder of the paper is structured as follows. Section 2 provides an overview of the various data aspects and categorizations. Section 3 describes our methods and evaluation metrics. The results obtained from the evaluations are presented in Section 4. Section 5 summarizes the paper, highlighting key conclusions.
2. DATA
The data in the current study was obtained from a local university’s databases and processed through feature engineering methods, as described in Section 3. The data underwent anonymization by university administrative personnel and the university’s ethics committee approved its usage. We collected student data between the years 2019-2022 (\(n=8,267\) students), since the LMS data exhibited stability from 2019. As part of our data extraction process, we noted that the university’s databases do not possess an identification bit of whether a student is active or dropped out. Hence, similar to the approach in [4], we determined the dropout status of students by examining other database records. Students were classified as dropouts if they had not registered for any course in two consecutive years and had not completed their study track. The majority of students do not drop out, hence the generated dataset is imbalanced, as was experienced by similar studies, such as [12, 16].
In accordance with our third research question, we obtained datasets for several departments in the university, namely computer science (CS, \(n=1,666\)), physics (\(n=566\)) and psychology (\(n=1,172\)). To assess prediction at higher academic hierarchy levels, we also extracted data for the hosting faculties, namely the exact sciences faculty for CS and physics (\(n=3,648\)) and the social sciences faculty for psychology (\(n=4,619\)).
2.1 Data Categorization
We divided our data into three logical data categories distinct in their context of an academic degree:
Pre-Entry encompasses socio-economic, demographic and past achievements data, supplied by students during university enrollment. Contains features such as birth date, gender, university admission score, zip code, country of origin, marital status, religion, high school grades and more.
Learning-Behavior pertains to data available throughout the semester, obtained from the LMS database. Contains LMS activity features, such as assignment grades, forum participation, video views, number of course logins, assignments’ submission times with respect to their deadline and more. In section 3.2 we propose an aggregation for this category in order to formulate the students’ overall cognitive and social behavior.
Achievements refers to data available at the end of an academic semester, when final grades are assigned. This category contains course related information, such as final grades for both exam periods (noted A and B), the number of exam failures, whether the course is mandatory and more.
2.2 Data Temporal Division
We divided the data further into several time points during the semester. Each such time point adheres to data accumulated up to that point in time. Table 1 details the temporal points along with their corresponding data. For example, Exam A period contains data up to the first exam period, thus does not possess grades from the second exam period, while 4 weeks and 8 weeks do not possess any final grade information, but solely contain Pre-Entry data and Learning-Behavior up to that time. Semester 2 refers to the end of the second academic semester, incorporating grades from both exam periods in both semesters. This temporal-based division defines the construction of the datasets needed for the predictive timeline analysis done in section 4. The 4 weeks time point was chosen since shorter intervals contain insufficient LMS data, and 8 weeks serves as a midpoint between 4 weeks and the end of the semester. Regarding Learning-Behavior, additional data from later stages in the semester were incorporated as distinct features, without replacing the information from earlier stages. For instance, at the 8 weeks time point, the training set included distinct features from both 4 weeks and 8 weeks. This approach allows the training process to leverage the learning profile demonstrated by a student earlier in the semester.
| Period | Data Categories Inclusion
| ||
|---|---|---|---|
| Pre-Entry | Learning-Behavior | Achievements | |
| 4 weeks | all (29) | 4 weeks (13) | - |
| 8 weeks | all (29) | 8 weeks (26) | - |
| Exam A | all (29) | all weeks (39) | Exam A (9) |
| Exam B | all (29) | all weeks (39) | Exams A, B (11) |
| Semester 2 | all (29) | all weeks (39) | Exams A, B and semester 2 (11) |
Overall, this study evaluates a total of 25 datasets, one for each faculty / academic department across all examined points in time. For instance, a dataset is generated for the computer science department for each of the five time points.
3. METHODS
Several standard data preprocessing methods were applied, and are specified in Appendix A. Appendix B specifies a feature normalization technique we used to overcome variability in course statistics. We employed XGBoost and Neural Network models for training over multiple datasets, as mentioned in Section 2.2. The training was conducted using the random split method, to split the data into train and test subsets at an 80% to 20% ratio, respectively. The models and their hyper-parameters are described in Appendix C.
3.1 Course Clustering
Some of the features used in this study contain course-specific data such as grades and LMS engagement. As seen in [24], the success or failure in courses of varying difficulty levels has distinct effects on predictive outcomes. For instance, a failure in an easy course may signal a higher likelihood of a student dropout compared to a failure in a more challenging course. To address this issue, we opted to cluster the courses offered by the university into four distinct difficulty levels: easy, medium, hard, and very hard. Such clustering also solves the issue of sparsity in course data, where students have actual non-empty values only in the few courses they enrolled in at a particular semester.
To that end, we employed k-means with k=4 using all courses across all semesters, since a single course may exhibit varying levels of difficulty across different semesters. Each course-semester instance was characterized by two features: the average grade and the percentage of student failures.
The graphical representation of this clustering approach is illustrated in Figure 1. For example, we can observe that the easy cluster refers to courses exhibiting an average grade ranging from 90 to 100, and a failure percentage below 10%. In total, 24,776 instances of course-semester were gathered from the entire university database.
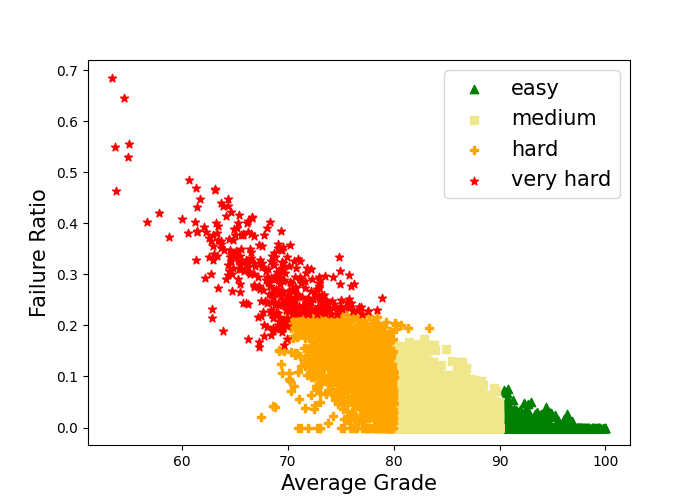
Using the identified clusters, we represent course data not in terms of features per course but instead by aggregated features per difficulty level clusters. This modification serves to decrease the number of potential features. For example, each student entry contains a single grade feature for each cluster, which is her average of grades in courses from that cluster, as opposed to individual grades for each course. Furthermore, we extracted a feature indicating the number of courses in the cluster, in which the students achieved grades surpassing the median grade of the course-semester instance. This method was applied to all course-specific features from the Learning-Behavior and Achievements data categories.
3.2 ’Studentship’ Aggregation Measurement
The LMS database includes a vast amount of information regarding students’ engagement with courses, such as video viewing, forum participation, frequency of logins, submission times, grades for assignments, and more. As noted in previous studies [9], students who exhibit high levels of forum engagement, timely submission of assignments, and frequent interaction with the LMS tend to display better academic performance and lower likelihood of dropping out of or failing the course.
In addition to the normalization techniques we applied to the raw LMS data, as detailed in Appendix B, we devised a method for quantifying and normalizing students’ activity based on their overall logging, recorded in the LMS database. We assigned weights to various types of interactions with the LMS system and calculated a score for each student by summing up these weighted values. The weights could be either positive or negative, akin to rewards or punishments, correspondingly. For example, the number of high (above mean) assignment grades will have a positive weight, while submitting an assignment after the deadline will have a negative weight. Afterwards, these weighted values were normalized, as mentioned in Appendix B. Overall, we refer to two LMS-based components, social studentship and cognitive studentship, replacing the raw LMS features in each of the clusters, as follows:
- Cognitive Studentship reflects the level of cognitive engagement of the students with the LMS system. It comprises of the grades and submission times of assignments and quizzes.
- Social Studentship reflects the level of social engagement of the students in the course. It comprises the students’ contribution to the course forum, the number of entries to the LMS system and a number of videos watched.
Appendix D provides a breakdown of the raw LMS features, including their weighted values and their classification as Social or Cognitive. The studentship metric is the weighted sum of these features, per each cluster.
3.3 Evaluation Metrics
In assessing the performance of our models, we employed a set of key evaluation metrics, specifically AUC and ’Recall for the Dropout Class’ (Dropout Recall). The selection of AUC stems from its efficacy in evaluating imbalanced datasets, being independent of specific classification thresholds, by calculating True Positive Rate (TPR) and False Positive Rate (FPR) across the threshold range. In accordance with prior research [4, 37], we opted to include the Dropout Recall metric, aligning with our primary research goal of identifying as many students at-risk of dropping out. Consequently, our aim is to minimize the potential of overlooking such students, as can be reflected by achieving high values for the Recall metric.
To assess the importance of the data categories for the prediction task, our methodology was similar to prior work [19, 34]. The evaluation metric employed measures the reduction in AUC score resulting from the permutation of columns associated with a specific data category across all instances.
4. RESULTS
To address our research questions, we assessed both XGBoost and NN models on various datasets. Each dataset corresponds to a time point, from the list in Section 2.2, whether LMS data was incorporated and whether studentship features were utilized instead of the raw LMS data. In sections 4.1 and 4.2 we limit our scope to data from the computer science department, addressing RQ1 and RQ2. The results described in these sections are summarized in Table 2. In Section 4.3 we address RQ3 and compare between academic departments.
| Type | Time | XGBoost | NN
| ||
|---|---|---|---|---|---|
| AUC | Dropout Recall | AUC | Dropout Recall | ||
| Student- | 4 weeks | 0.69 | 0.11 | 0.73 | 0.72 |
| ship | 8 weeks | 0.69 | 0.11 | 0.73 | 0.44 |
| Exam A | 0.79 | 0.33 | 0.78 | 0.61 | |
| Exam B | 0.9 | 0.64 | 0.89 | 0.92 | |
| Semester 2 | 0.94 | 0.76 | 0.92 | 0.92 | |
| LMS | 4 weeks | 0.62 | 0.0 | 0.75 | 0.72 |
| 8 weeks | 0.63 | 0.06 | 0.75 | 0.83 | |
| Exam A | 0.74 | 0.17 | 0.79 | 0.83 | |
| Exam B | 0.89 | 0.72 | 0.9 | 0.76 | |
| Semester 2 | 0.96 | 0.8 | 0.92 | 0.88 | |
| No LMS | Pre-Entry | 0.63 | 0.2 | 0.61 | 0.48 |
| Exam A | 0.75 | 0.22 | 0.77 | 0.56 | |
| Exam B | 0.86 | 0.56 | 0.88 | 0.84 | |
| Semester 2 | 0.92 | 0.68 | 0.92 | 0.84 | |
4.1 Early Prediction vs. Model Performance
Relating to RQ1, our objective in this section is to assess the balance between early predictions and the potential to improve prediction metrics as additional data is accumulated throughout an academic semester. Predictions early in the first academic semester, prior to reaching the first exam period, allow timely intervention and support to reduce the dropout risk. We refer to the results shown in Table 2 at the top block, labeled studentship, which is our initial reference point in terms of model performance.
First, we observe that the AUC scores after 4 weeks and 8 weeks of a semester are identical in both models. This is rather surprising, and suggests that studentship aggregation of LMS data from later in the semester, is not indicative of dropout. In later stages of the semester, and not surprisingly, we observe monotonically increasing AUC scores over time for both models, indicating that predictions made at the end of the semester and later on, when course final grades are available, yield better results. In addition, even though NN initially shows slightly higher AUC scores than XGBoost in the early stages of the semester, the latter model demonstrates enhanced AUC scores at later stages. Nevertheless, it is noteworthy that both models achieve AUC scores exceeding 0.9 at the end of the second semester.
Upon observing Dropout Recall scores, a notable distinction is evident between the models. In the case of NN, when grades from the second exam period are available (Exam B) and later on (Semester 2), the model achieves Dropout Recall scores of 0.92. As mentioned earlier, high Dropout Recall scores denote the model’s efficacy in identifying students at risk of dropout, thereby demonstrating proficiency in identifying instances of the minority class - student dropouts. Further examination of the corresponding AUC score indicates the NN’s comprehensive predictive performance. XGBoost displays lower Dropout Recall scores at all examined time points.
4.2 Prediction Improvements by LMS Integration
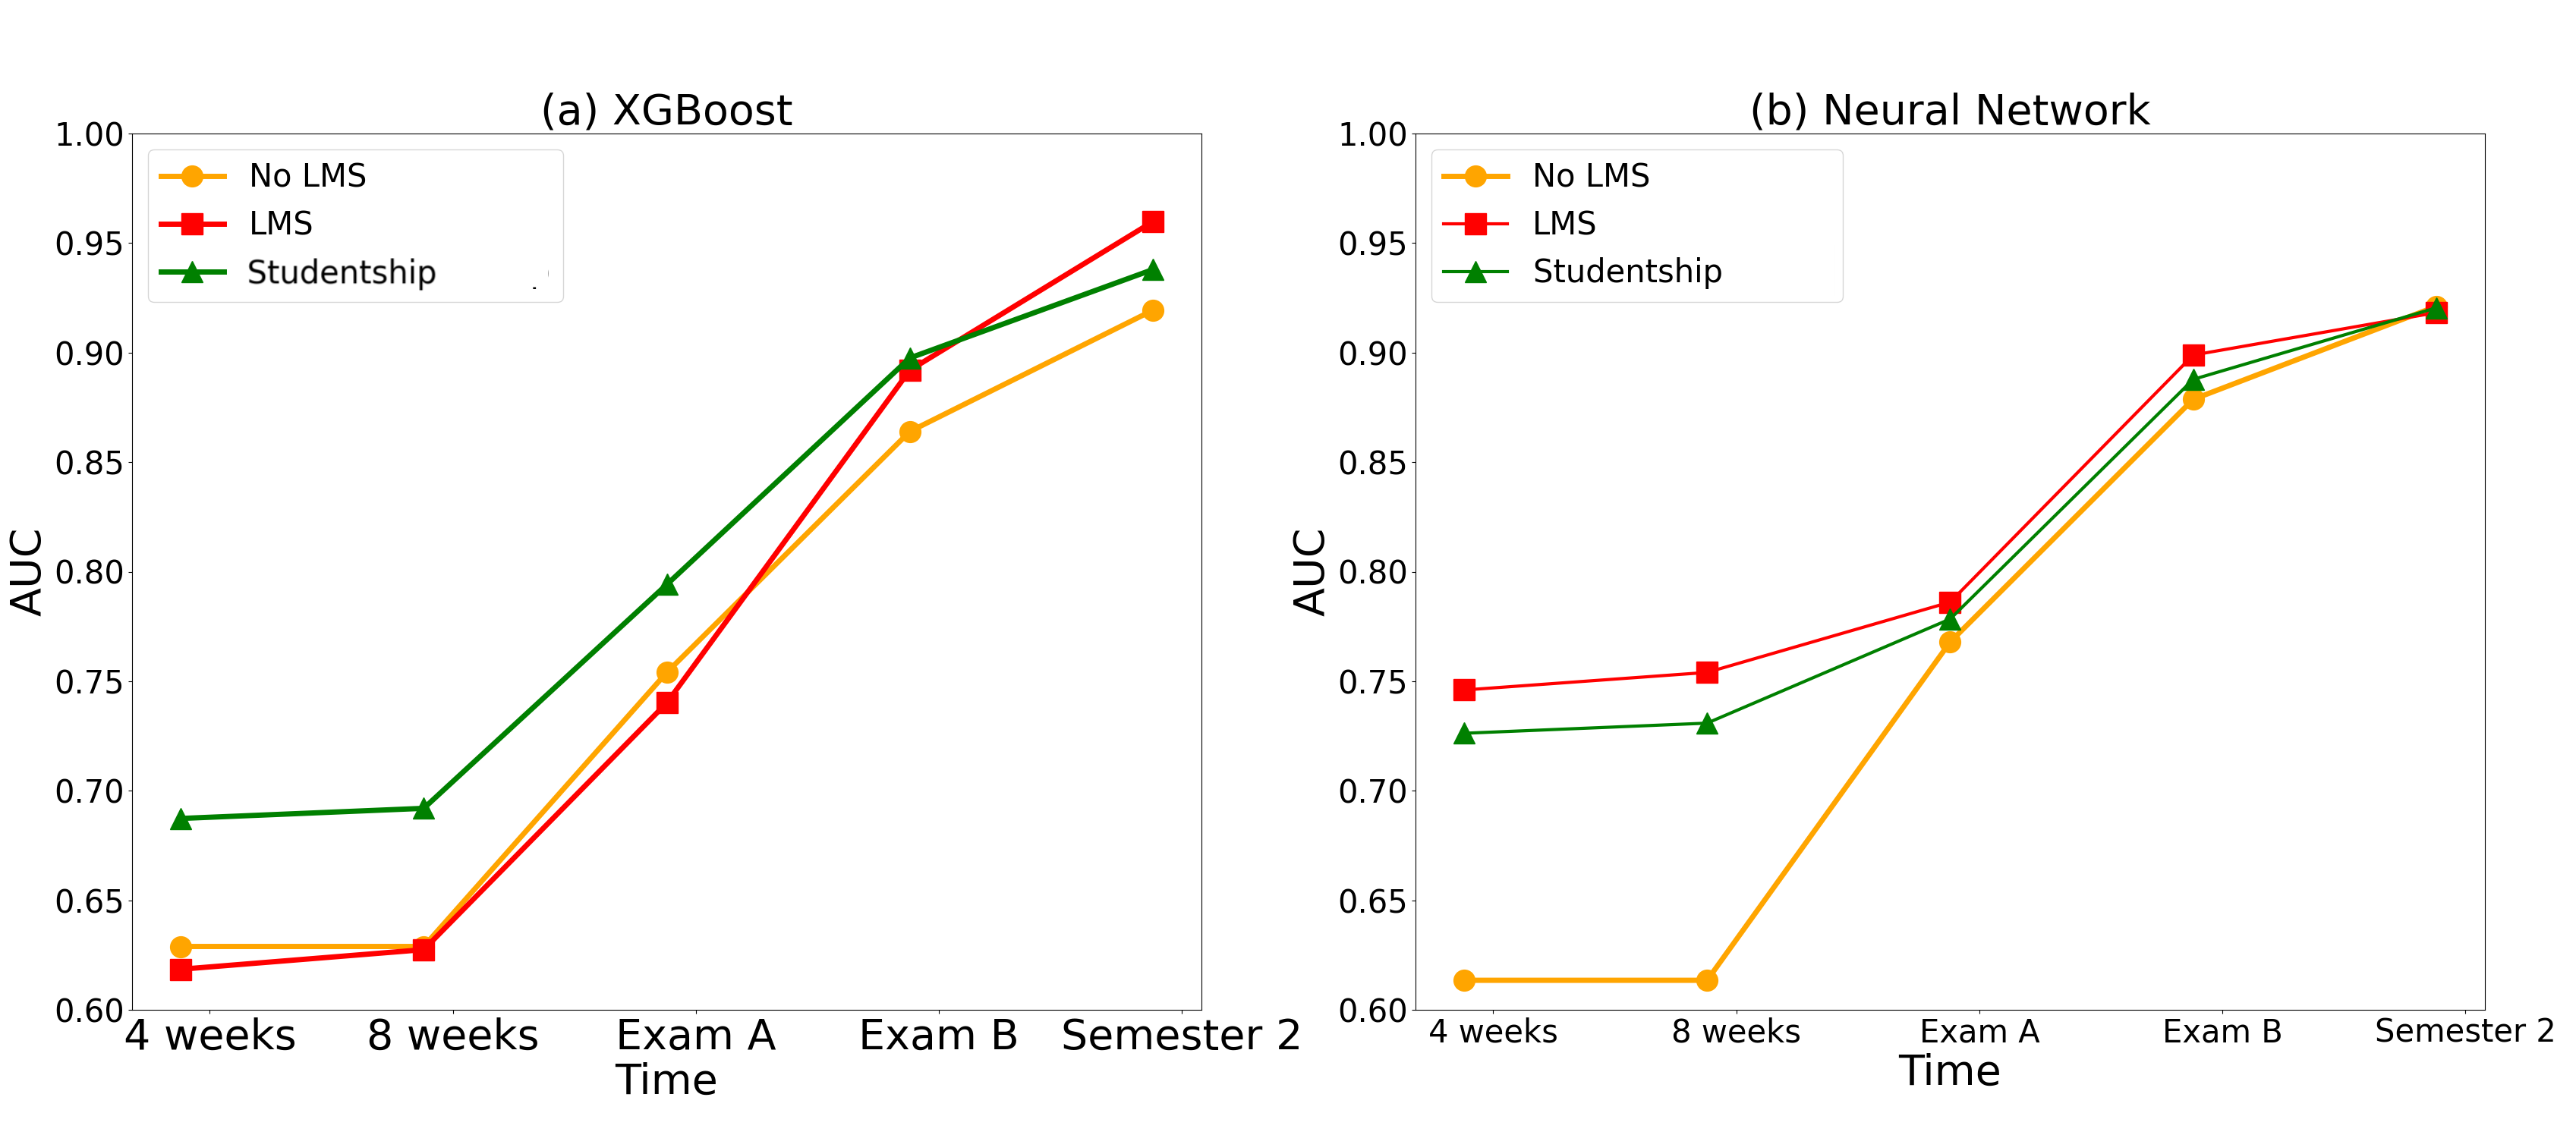
With regards to RQ2, the analysis in this section examines the impact of incorporating raw LMS data and its replacement with studentship features on the prediction quality – whether these data improve, diminish or have negligible impact across different time points in our two models. In conducting this analysis, our models were trained using two limited trainsets, namely without any LMS data (bottom block in Table 2) and with raw LMS data only (middle block). The AUC score results are visualized in Figure 2.
First, we note that when no LMS data is used, and at time points 4 weeks and 8 weeks before any course grades are available, the only data used for training belongs to the Pre-Entry category (in Table 2 this corresponds to the row labeled Pre-Entry). This allows us to examine the extent by which the “fate” of a student can be determined solely by their socio-economic, demographic and high-school achievements. Neither XGBoost nor NN models show much success in predicting dropout in this case (AUC 0.63 and 0.61, respectively).
Examining the AUC scores, the monotonicity over time in both models is preserved (compared to section 4.1) when training does not rely on LMS data at all and when it relies on its raw data. The contribution of raw LMS data is evident with the NN model before Exam A, and afterwards the effect narrows down and even disappears at the last time point, with all three datasets reaching AUC=0.92. With XGBoost, however, it appears LMS alone is not enough to significantly improve prediction quality, but replacing it with studentship is advantageous in the first three time points examined. As for the Dropout Recall, the NN model significantly outperforms XGBoost with all three datasets discussed. We conclude, therefore, that the contribution of our proposed studentship feature is inconsistent, and that LMS data may be significant, depending on the model used.
4.3 Comparison Between Academic Disciplines
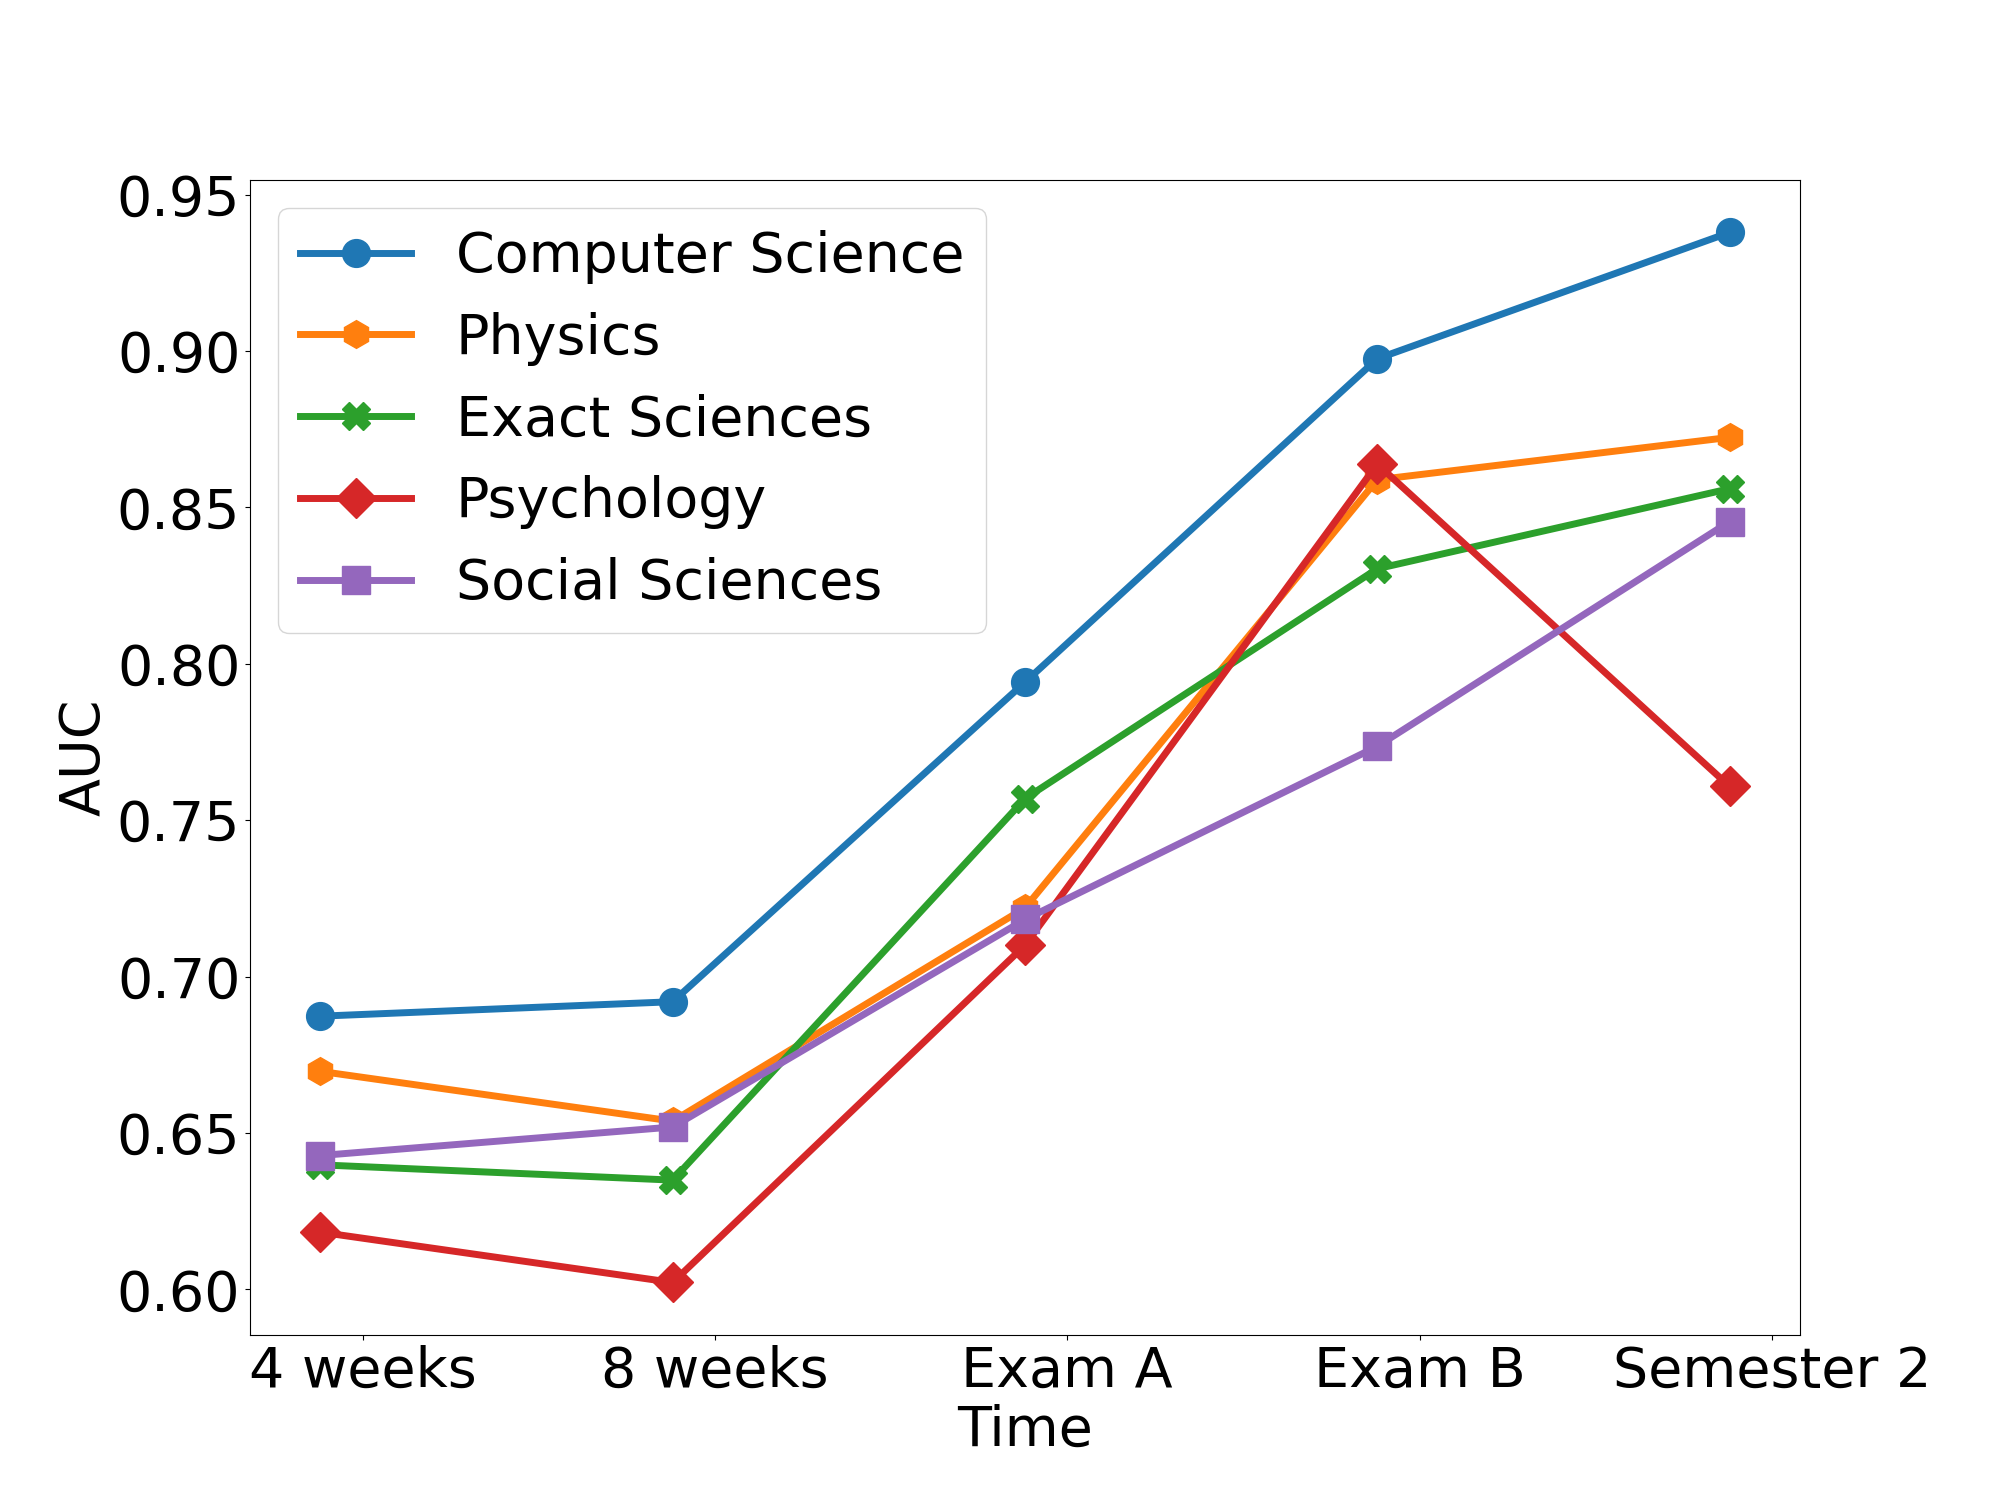
With regard to RQ3, in this section we aim to compare several academic disciplines in terms of prediction performance and feature importance. Our analysis includes the departments of computer science and physics from the faculty of exact sciences, and psychology from the faculty of social sciences. To that end, we use the results obtained from the XGBoost model, and analyze the datasets containing the studentship feature aggregation, in order to assess the importance of social and cognitive studentship.
Figure 3 illustrates the corresponding AUC scores obtained. Notably, in contrast to computer science and physics, the monotonicity in the AUC score is violated for psychology in Semester 2. This is a surprising behavior, which is discussed in the next section. Furthermore, this behavior does not occur in psychology’s hosting faculty, the home for other units such as the departments of social work and economy. Also, the transition between 4 weeks and 8 weeks involves a slight decrease in AUC scores for physics, psychology, and the faculty of exact sciences. This non-intuitive result is in contrast to all previous results shown in Table 2 regarding computer science.
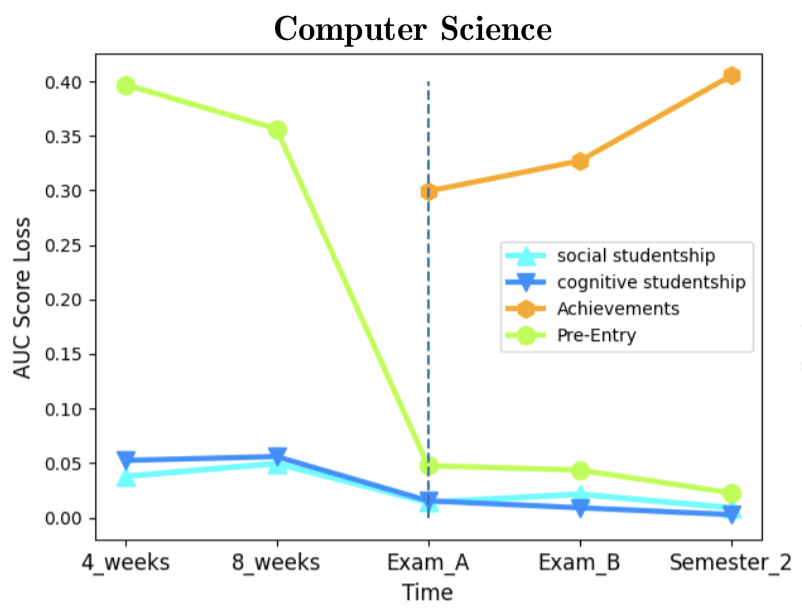
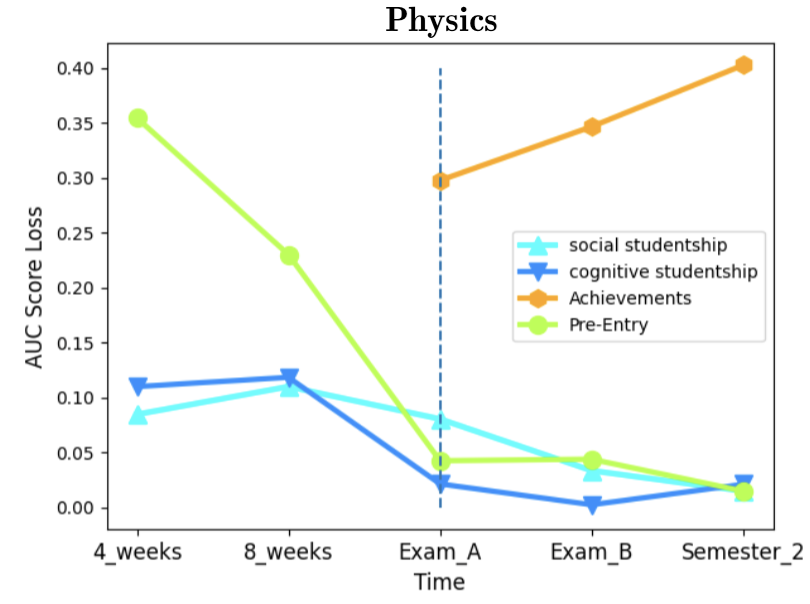
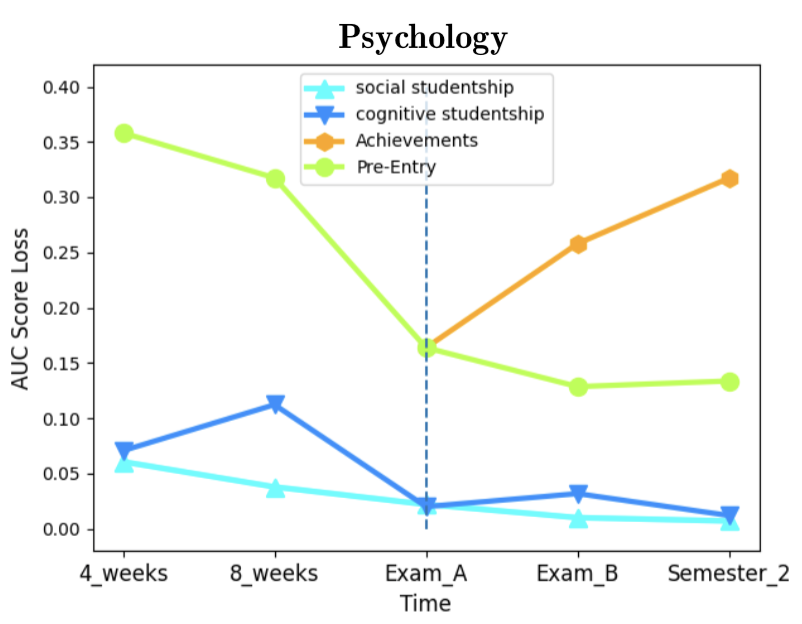
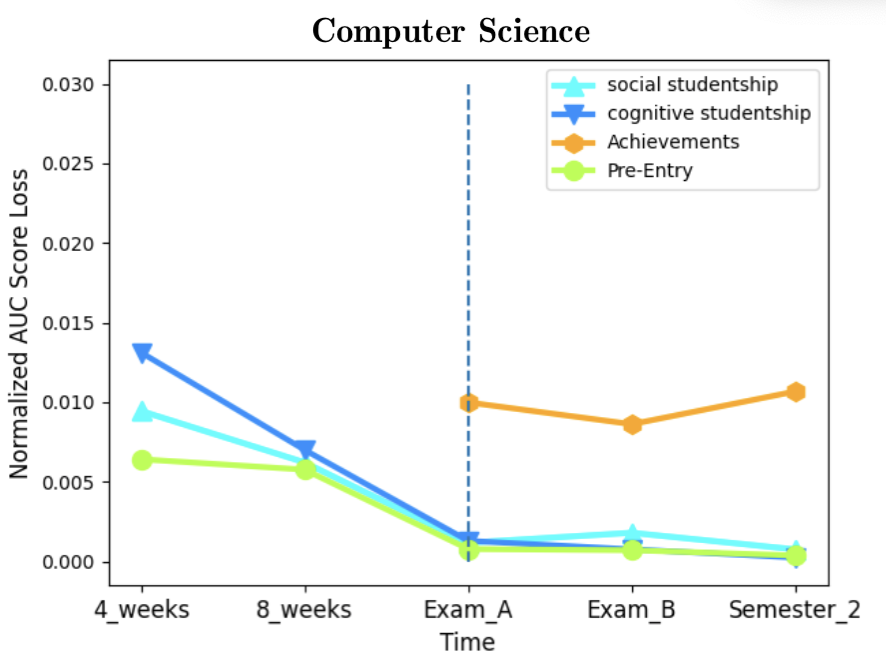
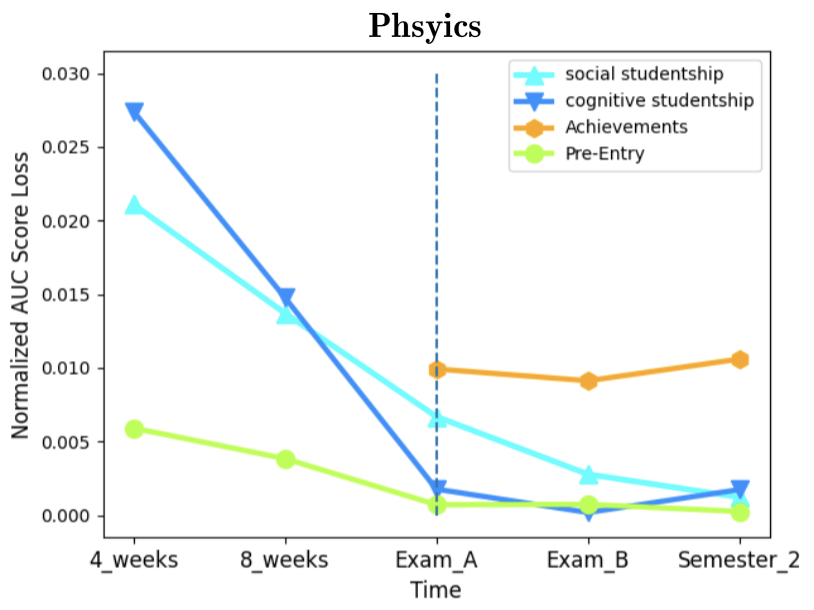
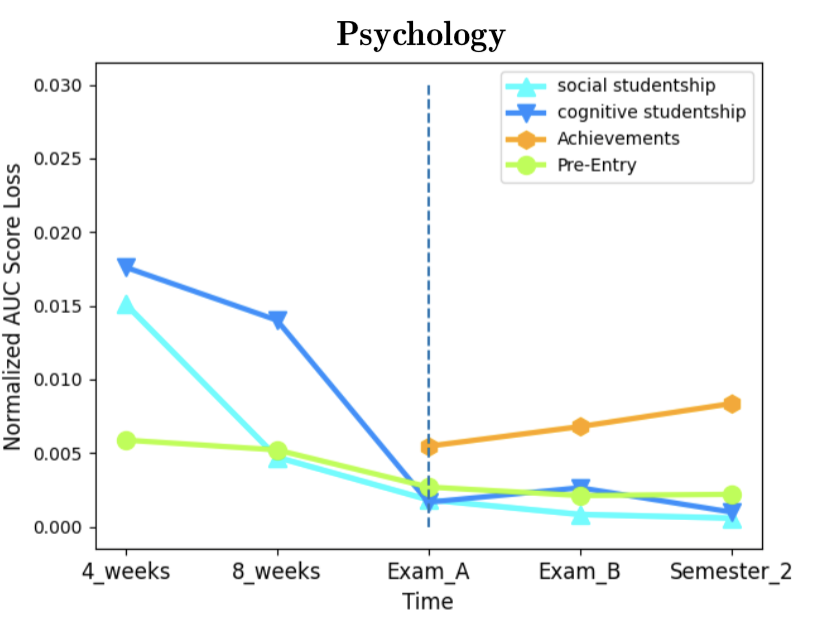
As for feature importance, we aimed to assess the importance of the data categories presented in section 2.1. We computed category (rather than single feature) importance [19, 34]. Figure 4 illustrates the AUC score loss effect by each data category. A higher loss indicates higher importance in the prediction for that data category. An evident common pattern exists in all three departments - the decrease in Pre-Entry combined importance over time, with a sharp decrease once Achievements data becomes available at the first exam period. Indeed, the Achievements category is expected to be the best indicator for dropout when treated as a group of features, with the disadvantage that it becomes available only when the semester already ended. Furthermore, the importance of Achievements increases monotonically as more grades are assigned in the second exam period and further on in the second semester. As for the studentship-related features, the results show their importance decreases during the semester and is limited compared to Pre-Entry data, while at the end of the semester and later on these features become roughly as predictive as Pre-Entry data. Some differences can be observed when comparing psychology to the exact sciences mentioned departments. In the former, Pre-Entry data is more predictive at the expense of Achievements. To conclude, in all three departments Achievements data overshadows other data categories in terms of predictive capabilities, and prior to their availability, Pre-Entry data serve as a much better predictor than Learning-Behavior related data from the LMS. Looking at the normalized AUC score loss (Figure 5 in Appendix E) we can examine the average importance of single features in each data category, as the score loss is normalized with the number of features in each category. For example, there are more features in the Pre-Entry data category (29) than in the Studentship (8), and their combined importance could be affected by the category size and therefore be misleading. Still, the results clearly support the earlier conclusions that Achievements data is a much better indicator for dropout, especially in the exact sciences. However, these normalized plots also show that Learning-Behavior outperforms Pre-Entry data as a predictor, if category sizes are normalized. We conclude that Pre-Entry data gains part of its predictive power from the mere fact that it contains numerous features.
5. CONCLUSIONS
The dropout phenomenon in higher education has gained a lot of interest over the years, with an attempt to understand its origins and characteristics, allowing a timely intervention to reduce its extent. Many academic institutes put extensive effort into this challenge, providing educational consultation and support for struggling students. More recently, approaches based on machine learning methods to predict dropout have shown promising results, and consequently there is a growing corpus of research utilizing such methods.
In this study, we employ two standard models (XGBoost and Neural Networks) on a leading local university database and Learning Management System. We examine the effect of the following elements on the prediction quality: the temporal impact along the academic timeline, the contribution of LMS-related data, and possible differences between fields of study. We believe our results provide several interesting insights regarding these three aspects.
We examine two time points during the first semester of studies, namely after 4 weeks and after 8 weeks in a typical 13-week semester. Two additional data points we inspected are the first and the second exam periods at the end of the first semester, when final course grades are available. A fifth time point we chose is at the end of the second semester of the academic year. Our initial results clearly reflect a steady increase in prediction metrics quality as additional data is accumulated through the progress of the academic timeline. However, waiting until the end of the first semester, not to mention the second one, in order to achieve better prediction has its clear disadvantages – less time is left to intervene, with possibly a more limited potential to reduce dropout. Still, both models examined show a substantial leap in terms of prediction quality at the second exam period, when students get their second chance to express their academic competence. Thus, as an initial recommendation to university staff, this point in time should be exploited to scan the lists of students in order to assist struggling ones.
The impact of LMS-related data was revealed to be inconsistent in more than a single manner. First, the effect of LMS raw data is significant in only one of the models used (Neural Networks). This effect becomes negligible starting the first exam period of the first semester, suggesting that final grades overshadow the impact of LMS raw data. In contrast, the studentship aggregation feature we propose, which captures cognitive and social elements of student engagement with the LMS, significantly benefits the XGBoost model only. A neural network model is indeed expected to generate such generalizations and aggregation of the data with no human-generated “scaffolds” (perhaps additional hidden layers can improve this ability further). In terms of learning capabilities, this reflects the differences in a model’s ability to generalize from raw data that, albeit structured, is also somewhat inconsistent and variant. To conclude, we believe the described inconsistency can be explained by the fact that LMS data tends to be highly variant across disciplines, courses and even semesters, and is much less reliable than other data categories we use.
As for the impact of the disciplinary nature of an academic department, our results indicate that different fields of study (e.g. computer science vs. psychology), may exhibit somewhat different dropout patterns. This may not be surprising, yet important to acknowledge when striving to develop a “one model fits all” prediction methodology. As a notable example, a surprising result is that the prediction quality in the psychology department drops substantially between the second exam period of the first semester and the second semester. This is in contrast to the pattern we see in the two other departments examined - computer science and physics. When looking deeper into the difficulty levels of courses in psychology we recognize a possible cause for this phenomenon: courses’ difficulty levels are distributed much more uniformly than in the other departments. Therefore, when additional course grades are available at the end of the second semester, student profiles are practically averaged and become less divergent, which hinders prediction. This interpretation requires deeper examination to prove or falsify. Further investigation of feature importance shows some common aspects between academic fields, but also some differences. In common, final course grades are the best indicators of dropout, and prior to their availability, Pre-Entry data serves as a better indicator when treated as a group of features, but not when considering the importance of an average individual feature. On the other hand, final grades appear to be more meaningful in the exact sciences than in psychology, while in the latter Pre-Entry data has more impact even at the end of the semester. These analyses indicate that disciplinary factors could improve prediction if taken into consideration.
We believe this research contributes an interesting case study and provides several important insights into the emerging corpus of studies on dropout prediction in higher education.
6. ACKNOWLEDGEMENTS
This work was supported in part by Len Blavatnik and the Blavatnik Family foundation.
References
- A. O. Ameen, M. A. Alarape, and K. S. Adewole. Students’ academic performance and dropout predictions: A review. Malaysian Journal of Computing, 4(2):278–303, 2019.
- A. Asselman, M. Khaldi, and S. Aammou. Enhancing the prediction of student performance based on the machine learning xgboost algorithm. Interactive Learning Environments, 31(6):3360–3379, 2023.
- L. Aulck, N. Velagapudi, J. Blumenstock, and J. West. Predicting student dropout in higher education. arXiv preprint arXiv:1606.06364, 2016.
- L. Aulck, D. Nambi, N. Velagapudi, J. Blumenstock, and J. West. Mining university registrar records to predict first-year undergraduate attrition. International Educational Data Mining Society, 2019.
- G. Baars and I. Arnold. Early identification and characterization of students who drop out in the first year at university. Journal of College Student Retention: Research, Theory & Practice, 16(1):95–109, 2014.
- M. Baranyi, M. Nagy, and R. Molontay. Interpretable deep learning for university dropout prediction. In Proceedings of the 21st annual conference on information technology education, pages 13–19, 2020.
- A. Behr, M. Giese, H. D. Teguim Kamdjou, and K. Theune. Dropping out of university: a literature review. Review of Education, 8(2):614–652, 2020.
- J. Berens, K. Schneider, S. Görtz, S. Oster, and J. Burghoff. Early detection of students at risk–predicting student dropouts using administrative student data and machine learning methods. 2018.
- K. A. Bird, B. Castleman, Y. Song, and R. Yu. Is big data better? lms data and predictive analytic performance in postsecondary education. EdWorking Paper, 2022.
- L. A. Buschetto Macarini, C. Cechinel, M. F. Batista Machado, V. Faria Culmant Ramos, and R. Munoz. Predicting students success in blended learning—evaluating different interactions inside learning management systems. Applied Sciences, 9(24):5523, 2019.
- T. Chen and C. Guestrin. Xgboost: A scalable tree boosting system. In Proceedings of the 22nd acm sigkdd international conference on knowledge discovery and data mining, pages 785–794, 2016.
- E. B. Costa, B. Fonseca, M. A. Santana, F. F. de Araújo, and J. Rego. Evaluating the effectiveness of educational data mining techniques for early prediction of students’ academic failure in introductory programming courses. Computers in human behavior, 73:247–256, 2017.
- F. Dalipi, A. S. Imran, and Z. Kastrati. Mooc dropout prediction using machine learning techniques: Review and research challenges. In 2018 IEEE global engineering education conference (EDUCON), pages 1007–1014. IEEE, 2018.
- S. Fauvel and H. Yu. A survey on artificial intelligence and data mining for moocs. arXiv preprint arXiv:1601.06862, 2016.
- J. Figueroa-Cañas and T. Sancho-Vinuesa. Early prediction of dropout and final exam performance in an online statistics course. IEEE Revista Iberoamericana de Tecnologias del Aprendizaje, 15(2):86–94, 2020.
- V. Flores, S. Heras, and V. Julian. Comparison of predictive models with balanced classes using the smote method for the forecast of student dropout in higher education. Electronics, 11(3):457, 2022.
- J. Gardner, Z. Popovic, and L. Schmidt. Subgroup robustness grows on trees: An empirical baseline investigation. Advances in Neural Information Processing Systems, 35:9939–9954, 2022.
- D. R. Garrison, T. Anderson, and W. Archer. Critical inquiry in a text-based environment: Computer conferencing in higher education. The internet and higher education, 2(2-3):87–105, 1999.
- B. Gregorutti, B. Michel, and P. Saint-Pierre. Grouped variable importance with random forests and application to multiple functional data analysis. Computational Statistics & Data Analysis, 90:15–35, 2015.
- L. Grinsztajn, E. Oyallon, and G. Varoquaux. Why do tree-based models still outperform deep learning on typical tabular data? Advances in Neural Information Processing Systems, 35:507–520, 2022.
- M. Jadrić, Ž. Garača, and M. Čukušić. Student dropout analysis with application of data mining methods. Management: journal of contemporary management issues, 15(1):31–46, 2010.
- C. Jin. Mooc student dropout prediction model based on learning behavior features and parameter optimization. Interactive Learning Environments, 31 (2):714–732, 2023.
- J. Kabathova and M. Drlik. Towards predicting student’s dropout in university courses using different machine learning techniques. Applied Sciences, 11(7): 3130, 2021.
- K. Kaur and K. Kaur. Analyzing the effect of difficulty level of a course on students performance prediction using data mining. In 2015 1st International Conference on Next Generation Computing Technologies (NGCT), pages 756–761. IEEE, 2015.
- L. Kemper, G. Vorhoff, and B. U. Wigger. Predicting student dropout: A machine learning approach. European Journal of Higher Education, 10(1):28–47, 2020.
- G. Kostopoulos, M. Tsiakmaki, S. Kotsiantis, and O. Ragos. Deep dense neural network for early prediction of failure-prone students. Machine Learning Paradigms: Advances in Deep Learning-based Technological Applications, pages 291–306, 2020.
- M. Kumar, A. Singh, and D. Handa. Literature survey on educational dropout prediction. International Journal of Education and Management Engineering, 7 (2):8, 2017.
- S. K. Kumar. On weight initialization in deep neural networks. arXiv preprint arXiv:1704.08863, 2017.
- M. V. Martins, L. Baptista, J. Machado, and V. Realinho. Multi-class phased prediction of academic performance and dropout in higher education. Applied Sciences, 13(8):4702, 2023.
- M. Nagy and R. Molontay. Predicting dropout in higher education based on secondary school performance. In 2018 IEEE 22nd international conference on intelligent engineering systems (INES), pages 000389–000394. IEEE, 2018.
- H. S. Park and S. J. Yoo. Early dropout prediction in online learning of university using machine learning. JOIV: International Journal on Informatics Visualization, 5(4):347–353, 2021.
- A. Pasini. Artificial neural networks for small dataset analysis. Journal of thoracic disease, 7(5):953, 2015.
- T. H. Phan and K. Yamamoto. Resolving class imbalance in object detection with weighted cross entropy losses. arXiv preprint arXiv:2006.01413, 2020.
- L. Plagwitz, A. Brenner, M. Fujarski, and J. Varghese. Supporting ai-explainability by analyzing feature subsets in a machine learning model. Challenges of Trustable AI and Added-Value on Health, page 109, 2022.
- L.-V. Poellhuber, B. Poellhuber, M. Desmarais, C. Leger, N. Roy, and M. Manh-Chien Vu. Cluster-based performance of student dropout prediction as a solution for large scale models in a moodle lms. In LAK23: 13th International Learning Analytics and Knowledge Conference, pages 592–598, 2023.
- B. Prenkaj, P. Velardi, G. Stilo, D. Distante, and S. Faralli. A survey of machine learning approaches for student dropout prediction in online courses. ACM Computing Surveys (CSUR), 53(3):1–34, 2020.
- C. F. Rodríguez-Hernández, M. Musso, E. Kyndt, and E. Cascallar. Artificial neural networks in academic performance prediction: Systematic implementation and predictor evaluation. Computers and Education: Artificial Intelligence, 2: 100018, 2021.
- K. Swan. Learning effectiveness online: What the research tells us. Elements of quality online education, practice and direction, 4(1):13–47, 2003.
- M. M. Tamada, R. Giusti, and J. F. d. M. Netto. Predicting students at risk of dropout in technical course using lms logs. Electronics, 11(3):468, 2022.
- V. Tinto. Dropout from higher education: A theoretical synthesis of recent research. Review of educational research, 45(1):89–125, 1975.
- E. Vinker and A. Rubinstein. Mining code submissions to elucidate disengagement in a computer science mooc. In LAK22: 12th international learning analytics and knowledge conference, pages 142–151, 2022.
- W. Xing and D. Du. Dropout prediction in moocs: Using deep learning for personalized intervention. Journal of Educational Computing Research, 57(3): 547–570, 2019.
APPENDIX
A. DATA PREPROCESSING
Various standard data preprocessing methods were applied to the data. For example, in the case of missing values in course grades (a student who did not attend the exam), we filled the missing grade entries with -1. Similarly, for raw features related to Learning-Behavior, we filled missing values with 0 to denote no activity was recorded under the evaluated LMS interactions.
As another example, the majority of students did not have a value under ”country of immigration”. The raw value of this feature corresponds to the origin country ID in the database, and for the purpose of this research, the specific country of origin is of minimal importance. Hence we converted this feature to a boolean feature indicating whether the students are immigrants or not. We applied this same boolean transformation methodology to several other features. Features with more than two distinct values were coded into multiple discrete values. Furthermore, one-hot vector was applied to some of these features.
B. FEATURE NORMALIZATION
As course difficulty levels are distinct and may vary between semesters, we normalized the student Achievements data with respect to other students from the same course-semester instance rather than relying on the raw data, allowing the evaluation of students’ performance relative to their classmates. For example, the student grade features were normalized based on the mean grade and standard deviation of the course-semester instances. The normalized grade is the distance from the mean grade of the course offering in standard deviation units, as can be seen in Equation 1.
\begin {equation} \label {eq:norm_grade} normalized\_value = \frac {feature\_value-mean(course)}{stddev(course)} \end {equation}
In addition, the task of capturing LMS information poses significant challenges, due to the varied teaching strategies employed across different courses [35]. For instance, some courses encourage active participation in forums while others lack forums altogether. Similarly, requirements related to submission of assignments and video components may differ across courses and even between semesters. For that matter, we employed the normalization techniques on LMS features as well. For example, forum participation features were normalized by considering the average forum participation of all students in the corresponding course-semester. Specifically, the same normalization approach for grades, detailed in Equation 1, is applied to LMS features as well.
C. MACHINE LEARNING MODELS
C.1 XGBoost
XGBoost is considered a good choice of model for prediction on tabular data. In order to solve the dataset imbalance, SMOTE was utilized prior to model training, to ensure an equal amount of entries for dropout and non-dropout classes. We trained this model using GridSearch cross-validation mechanism, in which we set the options for the hyper-parameters in order to optimize the AUC metric. The initial hyper-parameter configurations were based on the recommendations presented in [17]. By employing iterative training, we evaluated a range of additional hyper-parameter combinations, deriving the set of options documented in Table 3. Optimal AUC was obtained by different combinations of parameters for different datasets.
| Hyper-parameter | values | Description |
|---|---|---|
| \(max\_depth\) | \(\{5,10,15\}\) | Maximal tree depth |
| \(n\_estimators\) | \(\{100,200,300\}\) | Number of trees |
| \(learning\_rate\) | \(\{0.01,0.1,0.3\}\) | Determines the training step size |
| \(subsample\) | \(\{0.8, 1\}\) | Training data ratio for each tree |
C.2 Neural Networks
Following the guidelines outlined in [32], we designed the Neural Network architecture suitable for small datasets, incorporating a single hidden layer. The hidden layer was constructed by 10,000 nodes, initialized with Xavier initialization [28]. We used a Stochastic Gradient Descent (SGD) optimizer with a learning rate of 0.01 and a weight decay of 0.01 as a regularization to prevent overfitting, and utilized the Weighted Cross Entropy Loss [33] to address the dataset imbalance. The model was trained for 100 epochs, which resulted in negligible train loss.
D. STUDENTSHIP FEATURES BY TYPE
Table 4 provides the classifications of the raw LMS features into either Cognitive or Social, along with their corresponding weights. The specific weights used are +5, +3, +2 for large, medium and small rewards, and -3, -2 for medium and small punishments. While the exact weights are somewhat arbitrary, they allow us the quantification of LMS activity importance, as we perceive it.
| Category | Feature | Weight |
|---|---|---|
| Social | No. logins | Medium(+) |
| Social | No. forum messages written | Large(+) |
| Social | No. forum messages read | Small(+) |
| Social | No. video views | Small(+) |
| Cognitive | No. grades above mean | Large(+) |
| Cognitive | No. assignment submissions | Small(+) |
| Cognitive | No. submissions within 70% of submission period | Large(+) |
| Cognitive | No. submissions above 70% of submission period, and before deadline | Medium(+) |
| Cognitive | No. submissions on the day of deadline | Small(-) |
| Cognitive | No. submissions after deadline | Medium(-) |
E. NORMALIZED FEATURE IMPORTANCE
1https://docs.moodle.org/403/en/Learning_analytics_indicators - Accessed Feb. 2024