ABSTRACT
Assessing the difficulty of reading comprehension questions is crucial to educational methodologies and language understanding technologies. Traditional methods of assessing question difficulty rely frequently on human judgments or shallow metrics, often failing to accurately capture the intricate cognitive demands of answering a question. This study tackles the task of automated question difficulty assessment, exploring the potential of leveraging Large Language Models (LLMs) to enhance the comprehension of the context and interconnections required to address a question. Our method incorporates multiple LLM-based difficulty measures and compares their performance on the FairytaleQA educational dataset with the human-annotated difficulty labels. Besides comparing different computational methods, this study also bridges the gap between machine and human understanding of question difficulty by analyzing the correlation between LLM-based measures and human perceptions. Our results provide valuable insights into the capabilities of LLMs in educational settings, particularly in the context of reading comprehension.
Keywords
1. INTRODUCTION
Assessing question difficulty in educational settings is a critical yet challenging task relevant for both educators and researchers. The ability to identify what determines the difficulty of reading comprehension questions holds value since it can serve as a base for educational methods. It informs the design of educational content, tailoring learning experiences to meet individual student needs, and assists in developing more effective language understanding technologies.
Understanding and predicting question difficulty is crucial in adaptive education systems, where learning experiences are personalized to each student’s capabilities and progress. Adaptive education relies on accurately assessing learners’ comprehension levels and presenting them with appropriately challenging material. By ensuring that questions are diverse in terms of difficulty, these systems can maintain student engagement, encourage growth, and prevent frustration. Effective question difficulty assessment enables the creation of dynamic and responsive educational experiences that adapt to the evolving needs of diverse learners. Moreover, the significance of accurately predicting question difficulty extends beyond the domain of adaptive education and directly impacts automatic question generation. The generated questions can be tailored to specific learning objectives and proficiency levels by incorporating question difficulty estimation.
Traditional approaches to determining question difficulty have relied heavily on subjective human judgments and simplistic metrics, often overlooking the intricate cognitive processes involved in answering questions effectively. This paper introduces a novel approach to automated question difficulty assessment, leveraging the potential of Large Language Models (LLMs) to better understand the context and interconnections inherent in comprehension questions. By utilizing language models of different types and sizes, we aim to bridge the gap between machine and human understanding of question difficulty while providing a more objective and nuanced perspective.
The study’s main contributions are as follows:
-
We introduce novel metrics that characterize question difficulty using LLMs, which go beyond traditional methods and effectively leverage the intrinsic connections between the question and underlying context. We provide empirical evidence on the effectiveness of different metrics in discriminating question difficulty, contributing to the development of more accurate and efficient educational assessment tools. Moreover, we release our code as open-source1.
-
We argue for the viability of smaller language models in evaluating question difficulty, challenging the notion that larger models are always superior. This finding is relevant as it suggests the potential for efficient use of consumer-level hardware in educational settings.
2. RELATED WORK
An early attempt at predicting and defining question difficulty is presented by Ullrich et al. [11]. The approach builds upon Bloom’s taxonomy of questions [2] and maps the scale to be used as a prediction label. The authors start by manually defining keywords for each cell of Bloom’s matrix. Those keywords describe the main focus of a question, such as the task that the student would need to do to answer the query. The SQuAD [8] training dataset is used, and the questions are labeled by matching the keywords with the question content. However, this method proves unreliable since only a small percentage of the dataset can be labeled in this manner, and the complexity distribution is highly unbalanced due to keywords with low frequency. As such, the authors address the task as a binary classification, with factual-recall questions as representatives of easy queries, while categorizing cognitive-evaluation questions as challenging, requiring multi-step reasoning. This adjustment leads to a more balanced dataset through automated labeling, increasing the volume of annotated examples. The questions’ tokens are tagged with their corresponding parts of speech to predict complexity. Subsequently, a multi-layered perceptron network is trained on the automatically annotated dataset to predict complexity based on the question’s part-of-speech structure.
A study by Srivastava et al. [9] on adaptive education systems defines the difficulty of a question as the student’s ability to solve it based on previous behavior. Although the questions are presented in the form of translation exercises and not reading-comprehension inquiries per se, the study is relevant for proposing a novel complexity approach. The dataset is extracted from Duolingo and consists of examples of translation tasks and students’ activities on those tasks. The question is represented as a list of tokens. A student state is modeled as a temporally-evolving sequence of pairs: the question and whether the student responded correctly. A language model-based knowledge tracing [5] (LM-TK) system is used to predict the probability of a student answering a question correctly. A GPT-2 model [7] is fine-tuned for this task, given as training examples a pool of students and their sequence of question-answering activities. The negative log-likelihood is used as a loss function to predict the difficulty, which is defined as \(d_{QS} = \Pr (correct \mid Q, S)\), where Q is the asked question and S is the sequence of question-answering activities.
3. METHOD
We aim to build upon the current related work and use the zero-shot capabilities of LLMs to act as a proxy for human perception and, instead of relying on scarce student data to calculate the probability that a student answers the question accurately, like Srivastava et al. [9], we look at the problem from the perspective of an LLM and use the probability of the model to return the correct answer.
3.1 Dataset
The FairytaleQA dataset [13] is a comprehensive collection of questions and answers derived from a corpus of children’s stories from Project Gutenberg. This dataset is curated by educational experts and is designed to effectively assess and train the narrative comprehension skills of kindergarten to eighth-grade students. Unlike conventional reading comprehension assessments, which typically focus on isolated sentences or paragraphs, FairytaleQA explores the nuances of story structure, character development, plot progression, and thematic elements. This approach serves a dual purpose: a) to effectively assess the narrative comprehension skills of students and b) to help train and evaluate language models on reading proficiency.
Each question is framed within a fairytale context, requiring models to comprehend and reason about narrative content for accurate answers. This diverse set of questions serves as a robust benchmark for evaluating the performance of question-answering models.
The questions are manually annotated on two dimensions that we use to measure their difficulty:
-
Explicit versus Implicit - Explicit questions directly extract information from the text. Implicit questions, on the other hand, rely on a deeper understanding, requiring students to make inferences, draw connections, and interpret subtle nuances within the narrative.
-
Local versus Summary - Local annotations indicate that a specific sentence or span can be used to answer the question. In contrast, summary question annotations indicate that a question asks about the text’s overall meaning or main points. These questions are typically more open-ended and require the student to consider the entire text to answer them.
3.2 Assessing Question Difficulty using the Required Context
We assess the difficulty of a question by the performance of a model that is prompted to answer. LLMs can follow complex human instructions in a zero-shot setting [3] and answer a question by spanning attention over a context, which is not entirely different from the cognitive process of a student. We use these models to assess question difficulty by observing how accurately they would answer. Because LLMs often tend to formulate the answer differently, depending on the generation strategy and their previous training, we assess the likelihood of them providing the annotated answer. More formally, we calculate the cross-entropy loss (QA_Loss) for the annotated correct answer, given the prompt for answering a question based on the context. We hypothesize that a higher QA_Loss signifies a greater uncertainty in generating the correct response, thus reflecting a more challenging question for the model.
By assuming that complex questions require combining, bridging, and summarizing information from multiple sentences, we propose a method that measures the amount of context that a model needs to answer correctly. In this approach, the context is sequentially augmented while we observe the evolution of question-answering (QA) cross-entropy losses computed by a language model. The resulting sequence of losses provides a nuanced perspective on how the difficulty of questions evolves as additional context is introduced.
The algorithm starts with an empty context. At each step, all remaining sentences are tested by individually adding them to the current context. The sentence with the lowest QA_Loss is chosen and permanently added to the context. The order of sentences is preserved during the iterative expansion process, ensuring coherence and maintaining the inherent structure of the text.
The QA_Loss is computed at each iteration based on the evolving context. The loss reflects the model’s performance in answering questions with the given context level. The sequence of QA_Loss values, denoted as \(L = [L_1, ..., L_N]\), is observed and recorded for each incremental addition of context. This sequence is a dynamic indicator of question difficulty, denoting how the model’s performance improves or plateaus as more contextual information becomes available.
![ReIqnuiirtiea:li Aze liasnt e omfp stenyteconnctesexSt = C [S1,...,SN ]
Initialize an empty list L to store QA_Loss values
while S ⁄= ∅ do
min-loss ← inf
selected-sentence← None
for Si ∈ S do
temp C ← C ∪ Si
loifsslo←ss<QAmiLnosloss(tse tmhpenC)
min loss← loss
selected sentence← Si
end if
end for
C ← C ∪ {selected sentence}
S ← S ∖{selected-sentence}
endL.wahpilpeend(min-loss)
return L](./tmp-make4ht1x.svg)
These QA_Loss values (\(L_i\)) should capture the evolution of the capability of a language model to answer a fixed item, given a subset of context. A sample of 10 questions and their corresponding sequences of \(QA\_Losses\) are plotted in Figure 1).
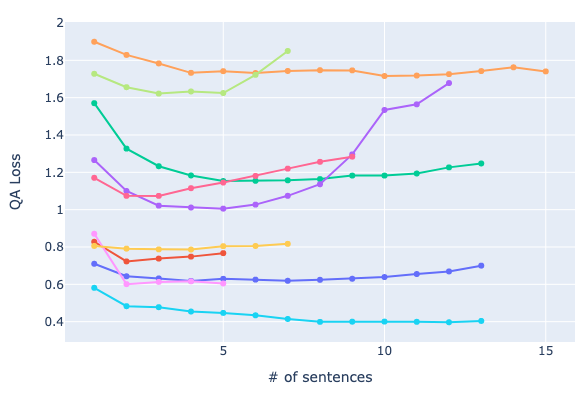
The majority of examples exhibit the same behavior: at first, using minimal context, the QA_Loss is higher. It then iteratively lowers until a global minimum point is reached by adding only the necessary sentences to answer the query. After that, the loss continuously rises, as more unnecessary context is uninformative and hinders the model’s performance.
For each item (context, question, correct answer) and its corresponding sequence of \(QA\_Loss\) values (\(L_i\)), we calculate different metrics and experiment with different ways of estimating difficulty. The following scores are computed for each question:
-
Minimum \(QA\_Loss\) index (MinLossIdx): The index of the minimum \(QA\_Loss\) from the sequence. This metric assesses how large the context must be for a model to answer the question optimally.
\begin {equation*} MinLossIdx = argmin(L) \end {equation*}
-
LossRange: The difference between the maximum and the minimum losses. This metric assesses how much the additional sentences help the model answer the question correctly.
\begin {equation*} Loss Range = max(L) - min(L) \end {equation*}
-
Full context loss (FullLoss): The \(QA\_Loss\) calculated with the whole given context. This is the last element in the sequence (\(L_N\)) and assesses the model’s capability to answer when the entire context is provided.
-
MinLossAUC: The area under the curve until the minimum \(QA\_Loss\) is achieved. The loss curve is translated so that the minimum loss has a value of 0 to remove the bias. This metric assesses the slope of the \(QA\_Loss\) graph, showcasing the model uncertainty drop as more context is added.
\begin {equation*} MinLossAUC = \sum _{i=1}^{argmin(L)}{(L_i-min(L))} \end {equation*}
-
ExpertiseGap: The difference between the FullLoss of the current model (Amateur) and the FullLoss of a larger model of the same type (Expert). This metric assumes that complex inferences, mostly needed in difficult questions, are handled differently by larger models.
\begin {equation*} ExpertiseGap = FullLoss_{Amateur} - FullLoss_{Expert} \end {equation*}
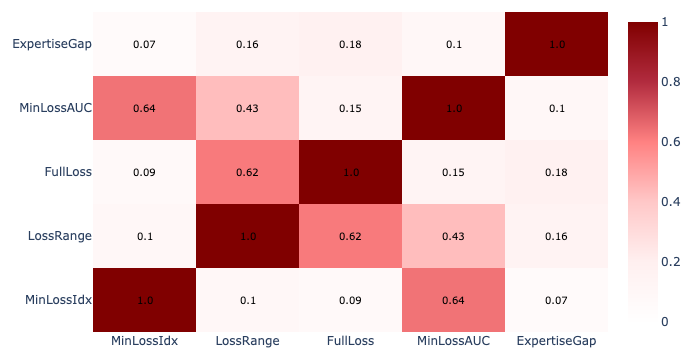
After computing these scores, we performed a Pearson’s test to observe their correlation and assess the extent to which the studied features measure the same underlying construct (see Figure 2). The majority of the difficulty-computation methods are weakly correlated, with two pairs being moderately correlated; as such, our scores capture different dimensions regarding the question difficulty.
3.3 Experimental Setup
Our models and the dataset are downloaded from the Huggingface platform and used with the Transformers library [12]. We experiment with different LLMs, Flan-T5 and Qwen 1.5, with varying sizes.
Flan-T5 [4] (encoder-decoder architecture) is an improved
version of the T5 language model, fine-tuned on various
tasks for better performance. This enhanced performance
stems from its adaptability to diverse instructions. It is
particularly performant on tasks like question answering. For
our experiments, we used the models flan-t5-large (0.8B
parameters), flan-t5-xl (3B parameters), and flan-t5-xxl (11B
parameters). The prompt used as input to the model had the
following format: "Answer the following question based on the
context. Context:
Qwen 1.5 [1] (decoder-only architecture) is one of the latest
developed, open-source LLMs that achieves competitive
performance on benchmark datasets. It outperforms the popular
Llama2 [10] in a variety of tasks. Moreover, even smaller
versions (under 7B parameters) compete effectively with
leading small-scale models. For our experiments, we used the
following models: Qwen1.5-0.5B-Chat, Qwen1.5-1.8B-Chat,
Qwen1.5-4B-Chat, Qwen1.5-7B-Chat, and Qwen1.5-14B-Chat.
The prompt was in the chat format, with the instruction:
"Answer the following question based on the context. Keep the
answer short, maximum 1 sentence, without any additional
explanations. Context:
4. RESULTS
We calculated the previously stated metrics for the official test partition of the FairytaleQA dataset. In order to measure how the selected features can discriminate between questions, we computed the Kruskal-Wallis non-parametric tests between our scores and the labels annotated by humans on the two dimensions (Explicit-Implicit and Local-Summary). More specifically, we split the scores into two populations: the ones corresponding to Explicit questions and those corresponding to Implicit questions; we had an analogous approach for Local-Summary. We performed the Kruskal-Wallis test [6] on these two populations and presented the results in Tables 1 and 2, including the test statistic and p-value significance. The following notations were used for highlighting statistical significance: no mark for a p-value higher than 0.05, one mark (*) for a p-value between 0.05 and 0.001, and two marks (**) for a p-value lower than 0.001. Key outcomes and high-effectiveness results are highlighted in bold for ease of reference.
5. DISCUSSION
5.1 Analysis
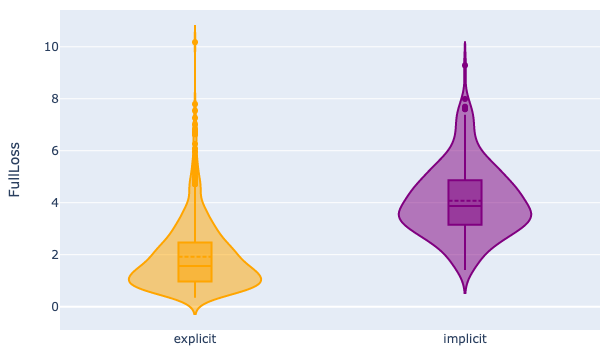
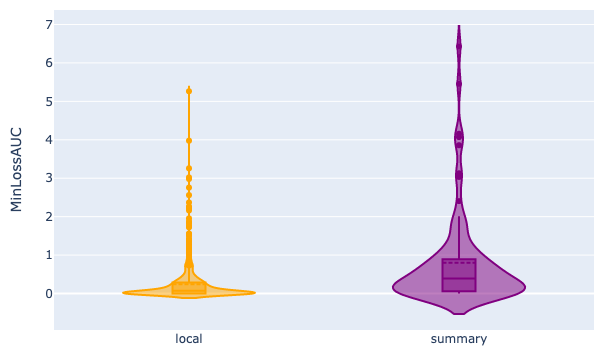
Based on the results, for the Explicit/Implicit approach to question difficulty, the LossRange and FullLoss features are the most discriminative, as they assess to what extent additional context helps in accurately answering the question and the model’s capability to answer when the entire context is provided, respectively. For the Local/Summary dimension, again, the LossRange approach and now the LossAUC are the most appropriate, as the latter measures the slope of the loss curve toward reaching the most appropriate context setup for answering correctly.
Since the Explicit/Implicit annotation is related to the answer’s occurrence in the text, it was expected that the FullLoss would be a significant metric, as it is easier for a model to generate an answer that is part of the original text. In contrast, the Local/Summary annotation checks whether the question requires information from multiple sentences, therefore the metrics rooted in context coverage perform best.
Based on the results, small language models (particularly Qwen 0.5B and 1.8B for Explicit/Implicit) are very effective in evaluating question difficulty and often surpass the performance of larger models. It appears that a larger size or a more recent model is not necessarily on par with the human concept of question difficulty. This is especially helpful since language models of reduced size can be efficiently run on consumer hardware and do not require expensive setups.
Analyses of the distributions of scores computed with the most discriminative metrics and model, categorized by the human-annotated difficulty dimensions, can be found in the Appendix A.
As the QA_Loss is the main contributor to all of our score computations, we plotted in Figure 3 the distribution of these values by model type and size.
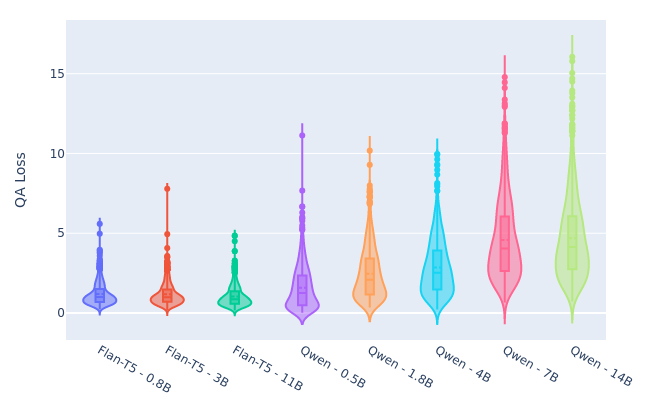
An increase in the \(QA\_Loss\) range of values can be seen for the Qwen models, as their decoder-only architecture and chat-assistant training made their responses highly verbose and long, even with a prompt that restricts the length. In contrast, encoder-decoder Flan-T5 models exhibit more brief responses and lower loss values. This behavior is not particularly detrimental to their effectiveness; however, it is important to consider.
A detailed example illustrating the response characteristics of different models to a specific question is provided in Appendix B.
5.2 Limitation
This study acknowledges a significant limitation: the evaluation relies solely on the FairytaleQA dataset. While the method effectively leverages prompt-adaptable LLMs in a zero-shot setting, future research should explore a wider range of datasets for increased generalizability. However, there is a scarcity of datasets annotated on their test partition with some form of difficulty labeling, hindering broader experiments. Furthermore, a comprehensive assessment of student perception of difficulty would strengthen the findings. Although the FairytaleQA dataset benefits from curation by educational experts, independent verification is crucial to ensure alignment between the proposed metrics and student performance. This necessitates collecting student data and analyzing the correlation between the proposed metrics and students’ perceived difficulty.
6. CONCLUSIONS AND FUTURE WORK
In conclusion, this paper experiments with novel approaches for assessing question difficulty using LLMs, particularly focusing on their zero-shot capability. This research argues for the potential of these models to mimic human perception and comprehension in answering questions based on contextual understanding.
Our iterative methodology employed in this study, which gradually augments context and observes the evolution of question-answering cross-entropy losses, offers valuable insights into the dynamics of question difficulty. Our approach clarifies how adding context initially reduces the loss, reaching an optimal point where further context may even hinder the model’s performance. This nuanced understanding of question difficulty provides a framework for developing more effective educational assessments.
Furthermore, the experimentation with different metrics and model sizes highlights the effectiveness of smaller language models in accurately assessing question difficulty. Contrary to expectations, larger models or recent advancements do not necessarily outperform smaller counterparts in this context. This finding underscores the practicality of utilizing smaller models, which can be efficiently run on consumer hardware without requiring expensive setups. Overall, the results suggest promising avenues for enhancing question difficulty computation and educational assessment methodologies through integrating advanced language models.
In terms of future work, this study can be extended to more types of questions. While this research focuses solely on short-answer, open-ended questions, future iterations could incorporate multiple-choice questions, requiring an assessment of both the question and the difficulty level of the provided answer choices. Furthermore, delving into long-answer quiz items, such as those requiring comparisons or in-depth analysis, holds significant potential. Such explorations could necessitate the model engaging in more intricate reasoning and generating responses with a broader range of possibilities, potentially leading to a paradigm shift in the capabilities of traditional language models.
A novel future direction stemming from these experimental findings is the utilization of the proposed metrics as indicators for the automated generation of questions with elevated difficulty levels. In conjunction with the advancements in steerable language models and proximal policy optimization, reinforcement learning algorithms now offer the capability for language models to generate improved text based on a scoring system. Our metrics have the potential to function as a reward system guiding the language model toward generating more complex questions.
Acknowledgments
The research reported here was supported by the Institute of Education Sciences, U.S. Department of Education, through Grant R305T240035 to Arizona State University and by the Learning Engineering Tools Competition. The opinions expressed are those of the authors and do not represent the views of the Institute or the U.S. Department of Education.
References
- J. Bai, S. Bai, Y. Chu, Z. Cui, K. Dang, X. Deng, Y. Fan, W. Ge, Y. Han, F. Huang, et al. Qwen technical report. arXiv preprint arXiv:2309.16609, 2023.
- B. S. Bloom and D. R. Krathwohl. Taxonomy of educational objectives: The classification of educational goals. Book 1, Cognitive domain. longman, 2020.
- C.-H. Chiang and H.-y. Lee. Can large language models be an alternative to human evaluations? In A. Rogers, J. Boyd-Graber, and N. Okazaki, editors, Proceedings of the 61st Annual Meeting of the Association for Computational Linguistics (Volume 1: Long Papers), pages 15607–15631, Toronto, Canada, July 2023. Association for Computational Linguistics.
- H. W. Chung, L. Hou, S. Longpre, B. Zoph, Y. Tay, W. Fedus, Y. Li, X. Wang, M. Dehghani, S. Brahma, et al. Scaling instruction-finetuned language models, 2022.
- A. T. Corbett and J. R. Anderson. Knowledge tracing: Modeling the acquisition of procedural knowledge. User modeling and user-adapted interaction, 4:253–278, 1994.
- W. H. Kruskal and W. A. Wallis. Use of ranks in one-criterion variance analysis. Journal of the American statistical Association, 47(260):583–621, 1952.
- A. Radford, J. Wu, R. Child, D. Luan, D. Amodei, and I. Sutskever. Language models are unsupervised multitask learners. 2019.
- P. Rajpurkar, J. Zhang, K. Lopyrev, and P. Liang. SQuAD: 100,000+ questions for machine comprehension of text. In J. Su, K. Duh, and X. Carreras, editors, Proceedings of the 2016 Conference on Empirical Methods in Natural Language Processing, pages 2383–2392, Austin, Texas, Nov. 2016. Association for Computational Linguistics.
- M. Srivastava and N. Goodman. Question generation for adaptive education. In C. Zong, F. Xia, W. Li, and R. Navigli, editors, Proceedings of the 59th Annual Meeting of the Association for Computational Linguistics and the 11th International Joint Conference on Natural Language Processing (Volume 2: Short Papers), pages 692–701, Online, Aug. 2021. Association for Computational Linguistics.
- H. Touvron, L. Martin, K. Stone, P. Albert, A. Almahairi, Y. Babaei, N. Bashlykov, S. Batra, P. Bhargava, S. Bhosale, et al. Llama 2: Open foundation and fine-tuned chat models, 2023.
- S. Ullrich and M. Geierhos. Using bloom’s taxonomy to classify question complexity. In M. Abbas and A. A. Freihat, editors, Proceedings of the 4th International Conference on Natural Language and Speech Processing (ICNLSP 2021), pages 285–289, Trento, Italy, 12–13 Nov. 2021. Association for Computational Linguistics.
- T. Wolf, L. Debut, V. Sanh, J. Chaumond, C. Delangue, A. Moi, P. Cistac, T. Rault, R. Louf, M. Funtowicz, et al. Transformers: State-of-the-art natural language processing. In Proceedings of the 2020 conference on empirical methods in natural language processing: system demonstrations, pages 38–45, 2020.
- Y. Xu, D. Wang, M. Yu, D. Ritchie, B. Yao, T. Wu, Z. Zhang, T. J.-J. Li, N. Bradford, B. Sun, et al. Fantastic questions and where to find them: Fairytaleqa–an authentic dataset for narrative comprehension. 2022.
APPENDIX
A. SCORES DISTRIBUTIONS
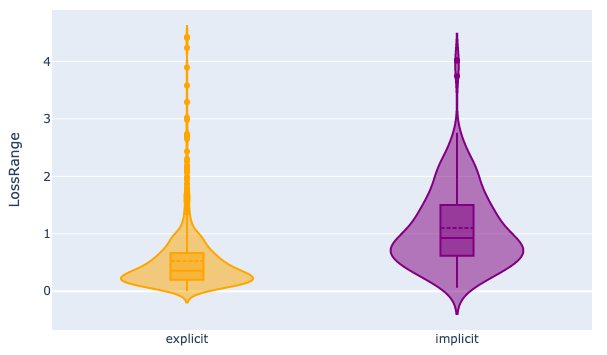
Figures 4, 5, and 6 depict how our computed scores perform in differentiating question difficulty, also assessed through human annotations. These violin plots depict the distribution of scores computed by the Qwen with 1.8B parameters model for questions categorized into two difficulty levels based on human judgment. They reveal distinct distributions for the two difficulty categories, suggesting a clear separation between the model’s scores for easy versus difficult questions. This visual separation underscores the model’s capacity to capture the inherent difficulty of the questions, as evidenced by the alignment between the model’s score distribution and the human-assigned difficulty levels.
B. MODEL RESPONSES
Table 3 showcases a specific example to effectively observe how these models would respond to a question instead of the annotated answer. It can be observed that Qwen models tend to chat and be very verbose in answering, as opposed to Flan-T5 models. However, they both answer appropriately in a greedy-decoding setup, while the generated text varies by model size.