ABSTRACT
Tailoring written texts to a specific audience is of particular importance in settings where the embedded information affects decision-making. Existing methods for measuring text complexity commonly rely on quantitative linguistic features and ignore differences in the readers’ backgrounds. In this paper, we evaluate several machine learning models that determine the complexity of texts as perceived by teenagers in high school prior to deciding on their postsecondary pathways. The models are trained on data collected at German schools where a total of 3262 German sentences were annotated by 157 students with different demographic characteristics, school grades, and language abilities. In contrast to existing methods of determining text complexity, we build a model that is specialized to behave like the target audience, thereby accounting for the diverse backgrounds of the readers. We show that text complexity models benefit from including person-related features and that K-Nearest-Neighbors and ensemble models perform well in predicting the subjectively perceived text complexity. Furthermore, SHapley Additive exPlanation (SHAP) values reveal that these perceptions not only differ by the text’s linguistic features but also by the students’ math and language skills and by gender.
Keywords
1. INTRODUCTION
Text complexity, i.e., the level of difficulty of intricacy, affects a reader’s overall perception of the content and how the embedded information is processed [20]. If a text is not adjusted to the intended audience, transmitting the relevant information can become largely ineffective [8] and knowledge gaps within the audience may occur [14].
Early research on text complexity introduced readability scores based on countable lexical or syntactic elements such as the Flesch-Reading-Ease (FRE) [10]. More recent studies on text complexity mostly relate to text simplification for non-native speakers and train machine learning models with annotated texts to incorporate additional features such as a foreign language learner’s skills [16]. Yet, due to the multidimensional nature of text complexity [20] and the specific needs of the audience, existing models to predict the perceived text complexity are scarce. In this paper, we thus build a model to predict text complexity as perceived by teenagers prior to major educational choices. To train the model, we self-collected data from 157 high school students in Germany who completed a short survey and then annotated 20 to 100 sentences from official study guides with regard to text complexity. The dataset is described in more detail in section 3 and will be published along with this work1.
In order to incorporate person-related features such as gender, age, language and cognitive abilities, mother tongue, and occupational interests into the predictions, we evaluate the performance of different feature-based machine learning models. The results show that K-Nearest-Neighbors (KNN) and ensemble models based on KNN and XGBoost achieve good results in predicting the perceived text complexity. Importantly, our models outperform baseline models that do not include person-related features. Furthermore, we perform a SHapley Additive exPlanation (SHAP) [15] analysis on the best performing model to get a better understanding of the model’s predictions. The model learned that students with stronger math and language skills as well as male students tend to perceive a text as less complex.
The study contributes to different areas of text complexity. First, we show that person-related features enhance the model’s predictions and outperform baseline models. Second, we show that adjusting text complexity to the reader’s needs goes beyond text simplification. The results reveal severe differences based on the students demographic backgrounds and language and cognitive skills so that using text simplification tools is unlikely to serve the students’ needs in our context. Third, we provide a novel dataset based on a large number of annotators who differ in their individual characteristics. Related datasets usually lack individual characteristics of the annotators [18]. Overall, this paper’s insights are important because adjusting informational texts to the needs of the target audience comes at low cost but may help attracting underrepresented groups in specific occupations.
2. RELATED WORK
This paper improves upon existing models on determining a written text’s complexity or readability. Early research on text complexity dates to the late eighteenth century [23] and developed various formulas for determining readability. Typically, these formulas calculate readability scores based on quantitative linguistic features such as syllables per word, sentence length, and vocabulary difficulty. A popular and still widely used measure is the Flesch-Reading-Ease (FRE), developed for the English language by Flesch [10] and adjusted to the German language by Amstad [1]. The FRE score maps the years of schooling a reader must have completed to understand the text (see Appendix A). It ranges from 0 to 100 where higher scores refer to less complex texts. Similar measures are the Gunning-Fog index [12] and the LIX readability score [2].
While early research concentrated on the development of static formulas, enhancements in machine learning and natural language processing allowed to develop predictive models to determine text complexity. These predictions can be made for single words [19] or for entire sentences [18, 17]. For instance, on the level of sentences, the Text Complexity DE Challenge 2022 (TCDE) [18] aimed for building regression models that could predict text complexity solely on linguistic features. The sentences were extracted from Wikipedia articles and then rated by non-native German speakers. The results show that ensemble models consisting of transformers and linear regression models could achieve good results in predicting the average text complexity scores [17].
Existing research on text complexity as perceived by the intended audience is scarce and mostly related to language learners or experts. The few studies show heterogeneity in these subjective assessments and also surprising results such as that experts perceive domain-specific texts as more complex than non-experts [22]. Understanding how readers perceive a text is of particular importance to transmit the embedded information efficiently, extending beyond mere text simplification: Psychological research suggests that a low level of text complexity may lead to inattention during reading because mind wandering can increase [11]. While a large number of models exist that solely use linguistic features to predict a text’s readability, there is a considerable gap in understanding how the intended audience actually perceives a text’s complexity.
3. DATA
Data on teenagers’ perceived text complexity was collected in four different classroom settings after a short presentation on generative AI in education. The presentation excluded any association with text complexity to avoid any bias arising from anchoring effects [24]. Afterwards, all teenagers accessed a randomly assigned annotation set by connecting to an online tool with their cell phones (see Appendix B.1).
3.1 Compilation of text corpus
The text corpus comprises sentences evaluated during the Text Complexity DE Challenge 2022 (TCDE), sentences from student guides on study and career choices, and two edge sentences representing the extreme ends of the FRE distribution.
The sentences from the TCDE challenge cover a total of 1000 different sentences from Wikipedia articles and have already been evaluated for readability by non-native German speakers during the challenge. This allows us to train a model with annotations made by a different target group. The sentences from student guides are based on the annually updated books "Study and Career Choice" published by the German Federal Employment Agency. These are provided to high school students to assist them during the transition from high school to college or to the labor market [5, 13]. We digitized all guides from 1971 to 2021 and extracted texts on fields of study and occupations using PDFAct [4]. Afterwards, we automatically checked for punctuation and grammar using language tool python2. The resulting text corpus had 1336 unique sentences, each assigned a FRE score for German language using the Python library textstat3. Finally, all sentences were categorized into five groups based on their FRE scores, ranging from least (FRE: 100 to 80) to highly complex (FRE: 0 to 20). The edge sentences include one least complex (FRE score: \(91.3\)) and one highly complex (FRE score: \(9.75\)) sentence related to higher education. The exact wording of these sentences is provided in Appendix B.2.
3.2 Data Collection
We collected students’ perceptions of the complexity of different sentences via a simple online survey tool (see Appendix B.3). The first question asked for consent to use the students’ data for research purposes. Afterwards, the survey started with eight questions on their demographic characteristics (age, gender), information on their language skills (language spoken at home, self-stated German skills), their plans after high school (type of education, field), and their school grades in German language and Maths. Table 4 in Appendix B.3 provides a complete list of variables and values of the survey. Finally, the students were asked to rate the complexity of twenty sentences on a 5-point-Likert scale, one sentence at a time.
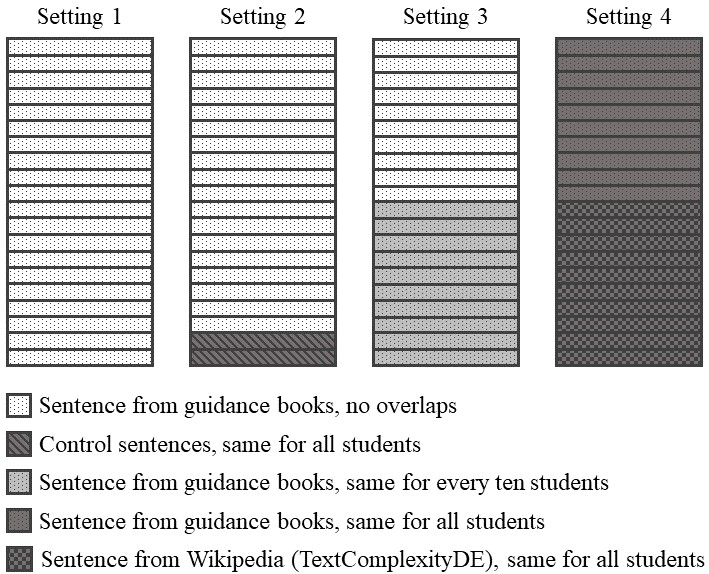
To ensure a high linguistic diversity in the rated sentences and facilitate comparison among students with varied backgrounds, we randomly selected sentences to be rated from different subsamples of the text corpus, as illustrated in Appendix B.4. In the first setting, each student received a unique set of sentences to maximize linguistic diversity. In the second setting, all students received the two edge sentences, while the remaining sentences varied uniquely for each student, again to maximize the diversity. In the third and fourth setting, we subsequently increased the number of overlapping sentences to account for the heterogeneity across students.
We combined all individual characteristics and annotations into one dataset. To comply with data protection regulations, we excluded responses from students below the age of 16 and those who did not consent to the use of their data for research purposes.
3.3 Resulting Dataset and Evaluation
| Setting | Number of | Number of | IAA |
|---|---|---|---|
| students | sentences | ||
| 1 | 29 | 473 | - |
| 2 | 67 | 1296 | 0.17 |
| 3 | 56 | 1073 | 0.22 |
| 4 | 5 | 420 | 0.20 |
| Total | 157 | 3262 |

The final dataset comprises 3262 sentences for which students indicated how they perceive the sentences’ complexity. In total, 157 different students evaluated 1336 unique sentences, meaning that every sentence was annotated on average 2.44 times (see Table 1). We calculate Krippendorff’s \(\alpha \) for ordinal data using the Python library krippendorff 4 to measure the inter annotator agreement (IAA) between the students. Table 1 reveals that the students achieve rather low IAA scores between 0.17 and 0.22. Figure 1 illustrates the distribution of the sentences’ complexity based on their FRE scores. It shows that the majority of sentences are more complex (indicated by lower FRE score) than what would be suitable for high school students (FRE score of 60 to 80). However, the students rated 49.2% of the sentences as very easy, 25.4% as easy, 17% as medium, 6.3% as hard and 2.1% as very hard. The distribution of perceived text complexity is thus heavily skewed towards the easier end of the spectrum (see Appendix B.5).
4. METHODOLOGY
Based on person-related and linguistic features, we train machine learning models to perform text complexity predictions. We furthermore use a SHAP analysis to explain how each feature contributes to the best performing model’s predictions. The feature selection, regression models, and SHAP analysis are explained in the following.
4.1 Person-related and Linguistic Features
We include eight person-related features based on the short survey that students completed before annotating the sentences (see Section 3). These features are age, gender, language spoken at home, self-stated German skills, type of training after high school, field or occupation, German grade and Maths grade. We removed the annotations of seven students who stated non-binary or skipped this question in the survey due to them being underrepresented in the dataset. For further details on the encoding, see Appendix B.6
To also account for linguistic features, we train two BERT models to label the complexity of each sentence. These are trained on the TCDE dataset and on our self-collected student dataset, respectively. Both models were trained separately due to differences in annotation settings, groups of annotators, and overall sentence compilation. We later use the predictions of both models as features for our perceived text complexity model. Training two distinct models is furthermore advantageous as regression models can weigh the importance of the corresponding features separately.
For the predictions based on TCDE dataset, we fine-tune
DistilBERT [21] for the regression task. Following [3], we use
the pre-trained distilbert-base-german-cased model and set its hyperparameters as follows: learning_rate=2e-5,
batch_size=10 and epochs=5. After training, we use this model
to predict average values on our student dataset.
For the predictions based on student dataset, we calculate the
arithmetic mean of the students’ complexity ratings for each
sentence. We fine-tune variations of pre-trained BERT [9]
models to predict the average text complexity scores for each of
these sentences. We perform an exhaustive search with a 5-fold
cross-validation to find the best hyperparameters for the model
based on the range of values as suggested in [9]. We find the
best hyperparameters to be as follows: learning_rate=2e-5,
batch_size=32 and epochs=2. For the implementation we use the
Huggingface5
library and adjust the model to perform a linear regression. We
compare the results of German and multilingual BERT models
and use the resulting predictions as an input feature for the
perceived text complexity models.
The predictions of the BERT models are the only linguistic features that we include in the regression model. All remaining features are the aforementioned person-related features.
4.2 Perceived Text Complexity Prediction
To incorporate the linguistic and person-related features for the text complexity predictions, we train several machine learning models to perform a regression task. We use the student-annotated dataset containing 3146 annotated sentences. We split the data into \(80\%\) training data and \(20\%\) test data. All models are optimized using a \(5\)-fold cross-validation and a parameter grid for hyperparameter tuning. We use the following regression models: Linear Regression (LR), Support Vector Regression (SVR), XGBoost (XGB), K-Nearest-Neighbors (KNN) and Multilayer Perceptron (MLP). For further information on the model’s best hyperparameters, see Appendix B.7. We evaluate all possible combinations of the base regressors listed above and adjust the weight of the voting regressor to get the best possible results. We decide to implement a voting regressor due to the fact that ensemble models can improve the robustness and reduce overfitting.
4.3 SHAP Analysis
SHapley Additive exPlanations (SHAP) [15] is a method to explain how each feature in a dataset contributes to a model’s prediction. To calculate the SHAP value \(\phi _i\) for feature \(i\), the model needs to be retrained on all possible feature subsets \(S \subseteq F\), where \(F\) is the set of all features. A model \(f_{S \cup \{i\}}\) that was trained including feature \(i\) is then compared to a model \(f_{S}\) that is trained excluding feature \(i\). The model’s predictions are subtracted \(f_{S \cup \{i\}}(x_{S \cup \{i\}}) - f_S(x_S)\) on the current input \(x_S\) in the set \(S\) with and without the presence of feature \(i\). SHAP values are described as a weighted average of all possible differences [15]:
\(\phi _i = \sum _{S \subseteq F \setminus \{i\}} \frac {|S|!(|F| - |S| - 1)!}{|F|!} \left [f_{S \cup \{i\}}(x_{S \cup \{i\}}) - f_S(x_S)\right ]\).
We use SHAP values to interpret the feature importance of our selected features. Moreover, we analyze how different values of our features affect the predictions of our model. Due to the additive property of SHAP values, it is possible to perform the analysis for specific instances.
5. RESULTS
In this section, we evaluate average and perceived text complexity predictions of several models. Our main evaluation metric is the root mean squared error (RMSE) because it penalizes larger errors more severely. A SHAP analysis then reveals how the features affect the best performing model’s predictions.
5.1 Model Evaluation
| Model | RMSE | \(R^2\) |
|---|---|---|
| Baseline (Mean) | 1.016 | 0.000 |
| Avg. Text Complexity (BERT) | 1.011 | 0.047 |
| Support Vector Regression (SVR) | 0.966 | 0.071 |
| Linear Regression (LR) | 0.948 | 0.106 |
| XGBoost (XGB) | 0.926 | 0.146 |
| Multilayer Perceptron (MLP) | 0.911 | 0.174 |
| K-Nearest-Neighbors (KNN) | 0.883 | 0.224 |
| SVR + LR | 0.933 | 0.133 |
| LR + MLP | 0.921 | 0.156 |
| SVR + MLP | 0.919 | 0.159 |
| LR + XGB | 0.916 | 0.166 |
| KNN + SVR | 0.898 | 0.197 |
| XGB + MLP | 0.898 | 0.198 |
| SVR + XGB | 0.891 | 0.217 |
| KNN + LR | 0.889 | 0.215 |
| KNN + MLP | 0.876 | 0.237 |
| KNN + XGB | 0.875 | 0.238 |
First, we measure the quality of the results for the average text complexity score predictions for the different large language models that were trained using our student dataset. The lowest RMSE of 0.889 is achieved by fine-tuning a bert-base-german-cased model (see Appendix B.8). Thus, we use the predictions of this German BERT model as an input feature for training the perceived text complexity models.
As shown in Table 2, all regression models that are trained on person-related features outperform the baseline models when predicting the text complexity as perceived by students. K-nearest-Neighbors is the best single regressor and achieves an RMSE of 0.883 and an \(R^2\)-Score of 0.224. Most of the ensemble models that include KNN outperform the other models. The best results are achieved by combining KNN and XGB into a weighted voting regressor (KNN: 80%, XGB: 20%). This model had an RMSE of 0.875 and \(R^2\)-Score of 0.238. We assume that KNN achieves superior results compared to other models because it maps all instances in a multidimensional space, thereby making predictions based on a conjunction of similar characteristics, and considering annotations from students with similar profiles when making predictions.
5.2 Model Explanation
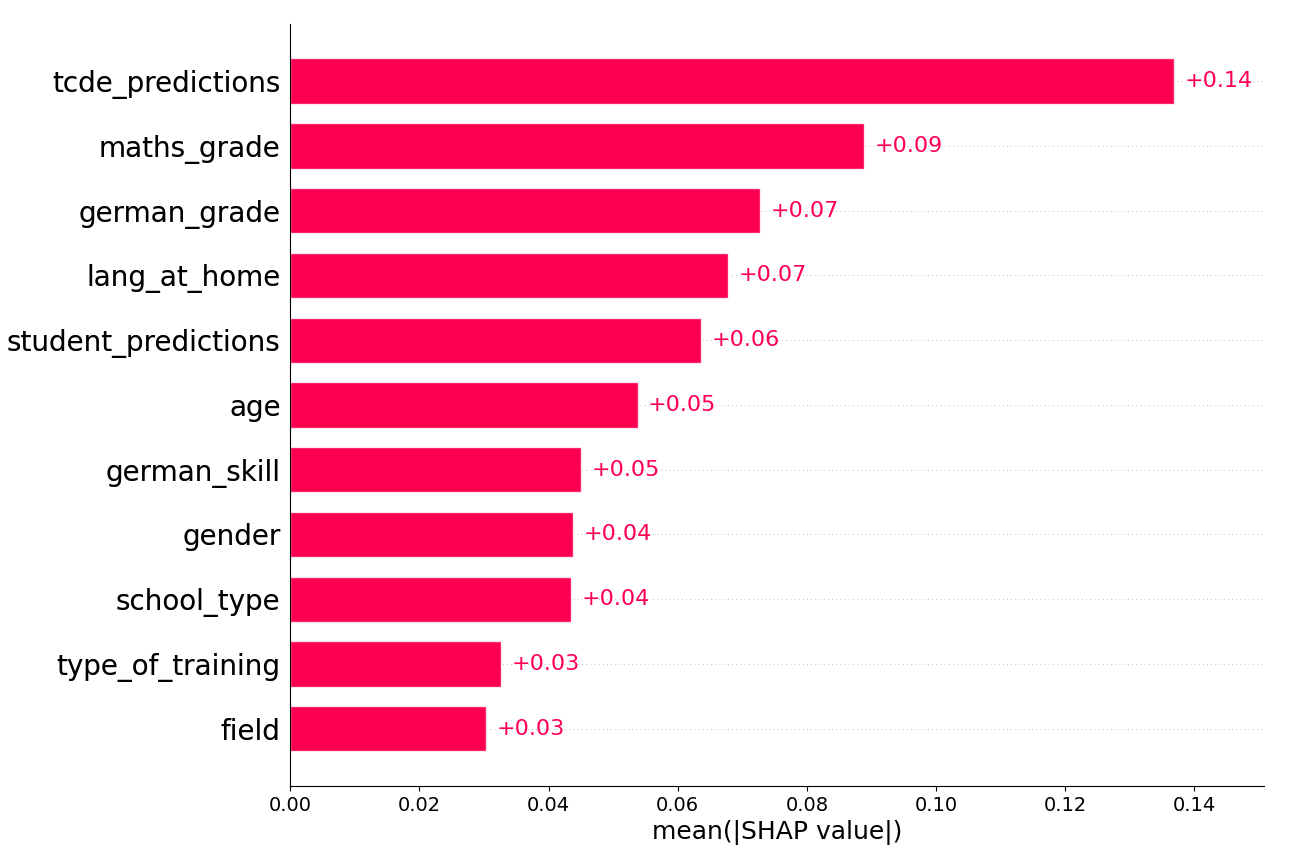
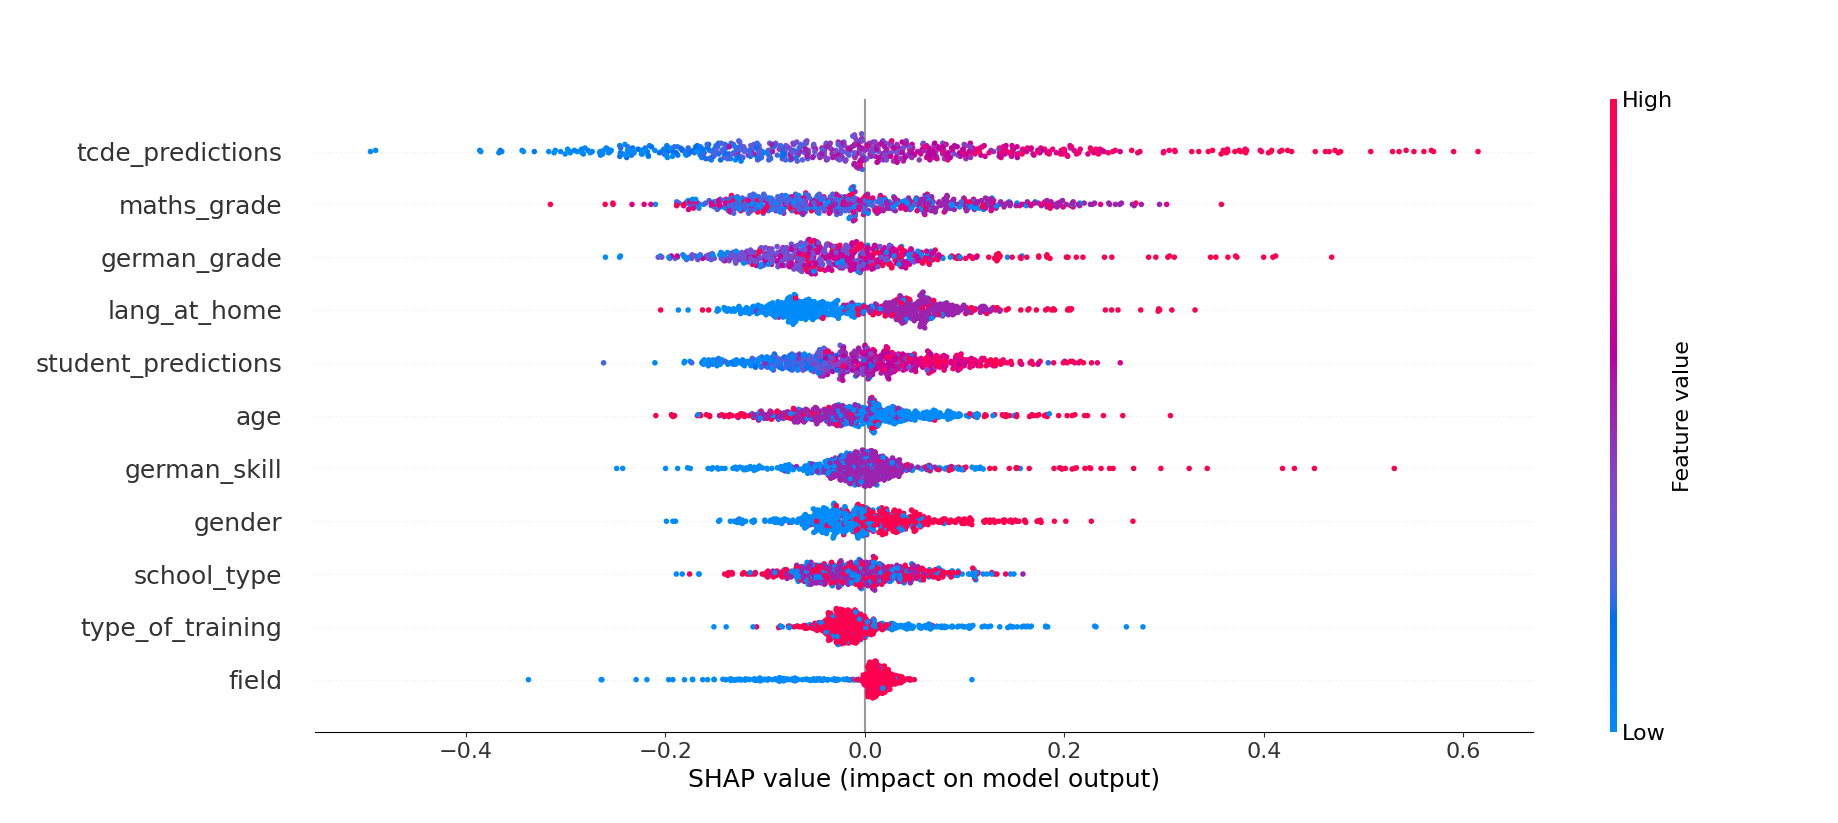
We perform a SHAP analysis to analyze how the different features influence the predictions of our best performing model, i.e., the voting regressor consisting of KNN (80%) and XGB (20%). We illustrate the results using the feature importance (see Figure 2) and the feature influence (see Figure 3). The feature importance is measured by the mean absolute SHAP values aggregated over all instances. In Figure 2, the \(x\)-axis depicts the mean absolute SHAP values of the features with a higher value reflecting a stronger impact on the predictions of the model. The feature impacts are shown in Figure 3 where the position of a dot on the \(x\)-axis represents the SHAP value of the feature for that specific instance. A positive SHAP value indicates an increase in the predicted value, meaning that the model assesses the text as more complex. In turn, a negative SHAP value indicates the opposite, i.e., a lower value for the predicted text complexity. The color gradient represents the features’ characteristics (from blue to red) and depends on the intensity of the feature values.
With a mean absolute SHAP value of 0.14, the TCDE predictions are the most relevant feature for our predictions and even have a higher importance than the student predictions with a SHAP value of 0.06. This difference may stem from the TCDE dataset sentences being annotated on average 9.5 times, while sentences in the student dataset are annotated on average only 2.4 times. Annotating the sentences multiple times seemingly increases the reliability of the dataset when it comes to the average text complexity values. The feature influence in Figure 3 reveals, that the TCDE predictions have a linear relationship with the model’s prediction.
Regarding the person-related features, the student’s maths grade emerges as the most influential aspect for the model, with a feature importance score of 0.09. The feature impact reveals that students with higher math grades tend to rate sentences as less complex. One explanation is that students with high math grades often have high cognitive abilities that can also enhance language abilities. However, contrary to expectations, Figure 3 also shows that the model learned that outliers exist, i.e., students with low math grades who perceive the texts as less complex.
In addition, student’s German grade and the language they speak at home also achieve high SHAP values of 0.07. Both of these features are indicators for the students’ actual language skills. The SHAP values in Figure 3 reveal that the language the students speak at home – German (blue), German and another language (purple) or no German (red) – affect the predictions of the model. The model’s predictions are adjusted downwards if the student speaks a foreign language at home. This effect is even stronger when the students state to not speak any German at home.
Finally, even though the students’ gender has a small effect on the predictions, there is a recognisable separation between male (0) and female (1) students. The model learned to rate sentences as slightly less complex when the person is male and slightly more complex when the person is female student. This relationship may be attributed to male teenagers’ overconfidence, leading them to rate sentences as less complex compared to female students [7].
6. CONCLUSION
In this paper, we investigate whether incorporating person-related features in machine learning models improve the prediction of perceived text complexity. Utilizing data collected from 157 German high school students who rated the complexity of different sentences, we train multiple regression models to predict the perceived text complexity based on different student profiles and few linguistic features. Our findings show that K-Nearest-Neighbor (KNN) and ensemble models perform well in predicting the perceived text complexity. Most importantly, all regression models that incorporate person-related features outperform the baseline models that predict average text complexity values. A SHAP analysis reveals that students’ grades and the language they speak at home play a decisive role for the predictions of our model.
Future research could leverage this method to enhance generative models tailored to specific target groups beyond language learners or individuals with low literacy levels. Providing teenagers from various backgrounds with texts adjusted to their needs may help them processing the embedded information. However, students’ perceptions may be influenced by over- or underestimation of their abilities, warranting investigation into measuring these effects in future works. Similarly, our dataset could be extended to include other subgroups of the population to allow adjusting texts also to their needs.
7. ACKNOWLEDGEMENTS
This work was funded by the Federal Ministry of Education and Research (BMBF) and Next Generation EU as part of the project “NLP in Education Research: Development of the German higher education market since the 1970s (Studi-BUCH)”; grant numbers 16DKWN139A and 16DKWN139B.
8. REFERENCES
- T. Amstad. Wie verständlich sind unsere Zeitungen? Studenten-Schreib-Service, 1978.
- J. Anderson. Lix and rix: Variations on a little-known readability index. Journal of Reading, 26(6):490–496, 1983.
- D. Arps, J. Kels, F. Krämer, Y. Renz, R. Stodden, and W. Petersen. Hhuplexity at text complexity de challenge 2022. In Proceedings of the GermEval 2022 Workshop on Text Complexity Assessment of German Text, pages 27–32, 2022.
- H. Bast and C. Korzen. A benchmark and evaluation for text extraction from pdf. In 2017 ACM/IEEE joint conference on digital libraries (JCDL), pages 1–10. IEEE, 2017.
- K. H. Bock. Studien- und Berufswahl - Entscheidungshilfen für Abiturienten und Absolventen der Fachoberschulen. Number 1. Verlag Karl Heinrich Bock, 1974.
- T. Chen and C. Guestrin. Xgboost: A scalable tree boosting system. In Proceedings of the 22nd acm sigkdd international conference on knowledge discovery and data mining, pages 785–794, 2016.
- K. M. Cooper, A. Krieg, and S. E. Brownell. Who perceives they are smarter? exploring the influence of student characteristics on student academic self-concept in physiology. Advances in physiology education, 42(2):200–208, 2018.
- A. C. Dahl, S. E. Carlson, M. Renken, K. S. McCarthy, and E. Reynolds. Materials matter: An exploration of text complexity and its effects on middle school readers’ comprehension processing. Language, Speech, and Hearing Services in Schools, 52(2):702–716, 2021.
- J. Devlin, M.-W. Chang, K. Lee, and K. Toutanova. Bert: Pre-training of deep bidirectional transformers for language understanding, 2019.
- R. Flesch. A new readability yardstick. Journal of applied psychology, 32(3):221, 1948.
- S. M. Fulmer, S. K. D’Mello, A. Strain, and A. C. Graesser. Interest-based text preference moderates the effect of text difficulty on engagement and learning. Contemporary Educational Psychology, 41:98–110, 2015.
- R. Gunning. The technique of clear writing. (No Title), 1952.
- F. Hertweck, L. Jonas, B. Thome, and S. Yasar. Study subjects at universities and universities of applied sciences in germany between 1971 and 1996: A compilation based on the guides to “study and career choice” for high school students. mimeo, 2024.
- J. Kleinnijenhuis. Newspaper complexity and the knowledge gap. European Journal of communication, 6(4):499–522, 1991.
- S. M. Lundberg and S.-I. Lee. A unified approach to interpreting model predictions. Advances in neural information processing systems, 30, 2017.
- S. Mohtaj, B. Naderi, and S. Möller. Overview of the germeval 2022 shared task on text complexity assessment of german text. In Proceedings of the GermEval 2022 Workshop on Text Complexity Assessment of German Text, pages 1–9, 2022.
- A. Mosquera. Tackling data drift with adversarial validation: An application for german text complexity estimation. In Proceedings of the GermEval 2022 Workshop on Text Complexity Assessment of German Text, pages 39–44, 2022.
- B. Naderi, S. Mohtaj, K. Ensikat, and S. Möller. Subjective assessment of text complexity: A dataset for german language. arXiv preprint arXiv:1904.07733, 2019.
- G. Paetzold and L. Specia. Semeval 2016 task 11: Complex word identification. In Proceedings of the 10th International Workshop on Semantic Evaluation (SemEval-2016), pages 560–569, 2016.
- H. S. Petro Tolochko and H. Boomgaarden. “that looks hard!”: Effects of objective and perceived textual complexity on factual and structural political knowledge. Political Communication, 36(4):609–628, 2019.
- V. Sanh, L. Debut, J. Chaumond, and T. Wolf. Distilbert, a distilled version of bert: Smaller, faster, cheaper and lighter. arXiv preprint arXiv:1910.01108, 2019.
- L. Seiffe, F. Kallel, S. Möller, B. Naderi, and R. Roller. Subjective text complexity assessment for german. In Proceedings of the Thirteenth Language Resources and Evaluation Conference, pages 707–714, 2022.
- L. A. Sherman. Analytics of literature: A manual for the objective study of English prose and poetry. Ginn and Co., Boston, 1978.
- A. Tversky and D. Kahneman. Judgment under uncertainty: Heuristics and biases: Biases in judgments reveal some heuristics of thinking under uncertainty. Science, 185(4157):1124–1131, 1974.
APPENDIX
A. INTRODUCTION
Table 3 shows how the Flesch-Reading-Ease is used to determine the educational level required to understand a certain text.
B. DATA
| FRE score | Readibility | Educational level |
|---|---|---|
| 0 to 30 | very difficult | Academics |
| 30 to 50 | difficult | |
| 50 to 60 | fairly difficult | |
| 60 to 70 | standard | secondary school |
| 70 to 80 | fairly easy | |
| 80 to 90 | easy | |
| 90 to 100 | very easy | primary school |
| Table based on [10] |
B.1 Screenshots of the online tool
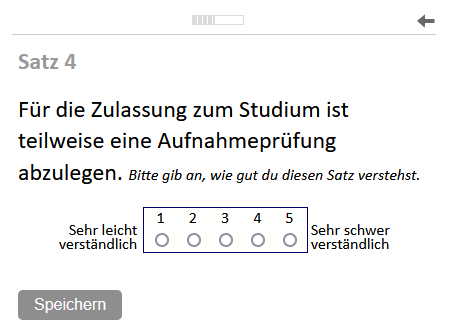
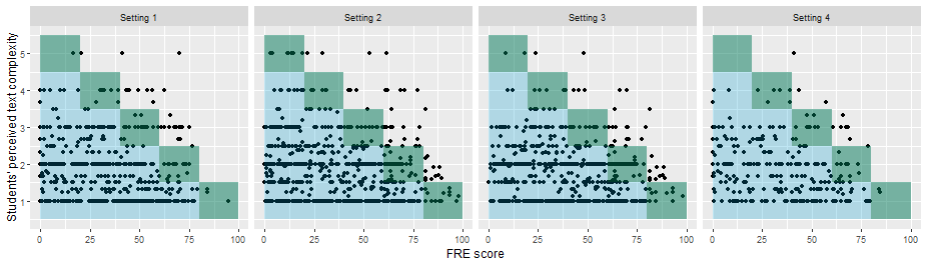
Figure 4 shows screenshots of the online tool that we used to run the survey. The students scanned QR-codes using their mobile phones and got redirected to their individual survey page.
B.2 Edge sentences
Two edge sentences were added to the dataset to capture a least complex and a highly complex sentence. These sentences are: "The uni has a mensa." (in German: "Die Uni hat eine Mensa.") with a Flesh-Reading-Ease score (FRE score) of \(91.3\) and "You can find detailed information on the requirements, course content and the course of a teacher training course in the information sheets of the student advisory services of the individual universities and federal states or in the current version of the teacher training laws of the federal states or the teacher examination regulations, which you can find on the websites of the relevant federal state ministries." (in German: "Detailinformationen zu den Voraussetzungen, den Studieninhalten und dem Ablauf eines Lehramtsstudiums finden Sie in den Merkblättern der Studienberatungsstellen der einzelnen Hochschulen und Länder bzw. können Sie der jeweils gültigen Fassung der Lehrerbildungsgesetze der Länder oder den Lehramtsprüfungsordnungen entnehmen, die Sie auf den Internetseiten der zuständigen Landesministerien aufrufen können.") with a FRE score of \(9.75\).
B.3 Details on survey
| Variable | Values |
|---|---|
| Age | 15 or younger; 16; 17; 18 or older |
| Gender | male; female; non-binary |
| Language at home | German; another language; German & another language |
| German skills | very good; good; medium; bad; |
| (self-stated) | very bad |
| Type of training | Vocational training; college; not yet decided |
| Field/occupation | STEM; Languages & Humanities; Social Sciences; Teaching & Education; other; not yet decided |
| German grade | very good; good; satisfactory; sufficient; poor |
| Maths grade | very good; good; satisfactory; sufficient; poor |
| Note: Students could refuse to answer a question by
ticking an additional box that was stating "Don’t want
to answer" or skipping the question. | |
Further details about the answering options of the survey as shown in Table 4.
B.4 Survey Settings
Figure 6 illustrates the composition of the survey within each setting.
B.5 Distribution of Labels
Figure 5 visualizes students’ perceived text complexity of the sentences compared to their FRE scores. Each point is one annotation in the four different settings. The green shaded area provides the overlapping regions, i.e., where the perceived text complexity equals the FRE scores. The blue shaded are on the bottom left part are those annotations where students perceived the texts’ complexity as easier to read than suggested by the FRE scores. Figure 5 shows that the vast majority perceived the readability of a text as less complex than suggested by the FRE scores.
B.6 Person-related Feature Encoding
Age: Ranges from 16 to 18 years old. We removed students that
were 15 or younger due to data protection regulations.
Gender: Binary encoding: Male (0), female (1). We removed the
annotations of seven students who stated non-binary or who
skipped this question in the survey.
Language at home: Ordinal encoding: German (1), German and
another language (2), another language (3)
German skills (self-stated): Ranges from very good (1) to very
bad (5)
Type of training: Binary encoding: Does not know yet (0),
knows if study or vocational training (1)
Field / occupation: Binary encoding: Does not know field or
occupation yet (0), knows field or occupation (1)
German grade: Ranges from very good (1) to no answer
(6)
Maths grade: Ranges from very good (1) to no answer
(6)
School type: Academic high school (1), mixed school types (2),
comprehensive school (3)
B.7 Model Hyperparameters
We use the following regression models and found these
hyperparameters to achieve the best results:
Linear Regression (LR): -
Support Vector Regression (SVR):kernel=rbf, degree=2, gamma=0.1, C=10, epsilon=1
Multilayer Perceptron (MLP):activation=relu, hidden_layer_sizes=(100, 50),learning_rate=adaptive, alpha=0.01, solver=adam,max_iter=5000
XGBoost (XGB) [6]:gamma=0.5, learning_rate=0.1, n_estimators=100,min_child_weight=1, subsample=0.6, max_depth=7,colsample_bytree=0.8
K-Nearest-Neighbors (KNN):k=15, weights=distance, metric=euclidian
B.8 BERT Model Comparison
Table 5 shows that all pre-trained models achieve comparable
RMSE values ranging from 0.889 to 0.895. BERT models
outperform DistilBERT models slightly, and German models
generally outperform multilingual models. Table 2 compares
these models. The hyperparameter values for the best model,
bert-base-german-cased, are set as follows: batch_size=32,
epochs=2 and learning_rate=2e-5.
| model name | RMSE |
|---|---|
| distilbert-base-multilingual-cased | 0.895 |
| distilbert-base-german-cased | 0.890 |
| bert-base-multilingual-cased | 0.892 |
| bert-base-german-cased | 0.889 |