ABSTRACT
This study investigates the dynamics of group interactions within an immersive collaborative astronomy learning environment, focusing on the role of individual contributions and their impact on group dynamics. Through a multi-level analytical framework, we examined the distribution of constellation annotation behaviors among group members, the influence of individual annotations on peers’ navigational choices and heading trajectories, and the emergence of leader-follower patterns through coordinated navigation. Utilizing the Gini coefficient to quantify the equity of participation on annotations, our findings revealed that high-performing groups exhibited higher Gini coefficients, indicating less equitable distribution of contributions. Further dynamic time wrapping clustering analysis investigated the impacts of individual annotations on peer navigation, uncovering two distinct response patterns to peer annotations that characterize pairwise interactions: immediate response and individual exploration. Examining the temporal evolution of these response patterns throughout the session, we found that high-achieving groups engaged in more individual exploration patterns during the middle of the task. Collectively, the study’s findings suggest that an uneven distribution of annotation contributions and individual exploration, rather than hindering, may underpin effective collaborative learning within groups. This comprehensive analysis highlights the complex interplay between individual contributions, group coordination, and emergent leader roles, enriching an understanding of the mechanisms that drive productive collaboration.
Keywords
1. INTRODUCTION
Collaborative learning environments, where students work together in small groups to complete tasks, have become increasingly prevalent in both formal and informal learning settings [8]. A growing body of research has demonstrated the benefits of collaborative learning for developing critical thinking skills, metacognition, and domain-specific knowledge [4, 19]. However, simply putting students together does not guarantee successful collaboration or learning [22, 27]. The quality of the group interactions and dynamics significantly shape the effectiveness of collaboration [8]. While prior work has provided insights, there remains a gap in understanding the complex interplay between individual and group learning processes. As collaboration involves constructing shared meaning through reciprocal engagement [2, 12], it is critical to analyze how individual contributions impact other group members’ actions and constitute collaborative interactions. Collaboration analytics must incorporate analysis at both the individual and group levels [23], focusing on the nuanced interactions between them.
This study seeks to bridge this gap through a fine-grained analysis of how individual behavior influences other group members within an immersive astronomy simulation platform. We focus on reciprocal interactions through the lens of annotation behaviors and their impact on navigation. Extending our prior work exploring annotation and re-annotation behaviors [35], the current study investigates how one student’s annotation impacts other members’ navigational choices and heading trajectories within the simulation. By examining peer responses to individual annotations and emerging interaction patterns, we aim to uncover the dynamics of group interactions that underpin effective collaborative learning. This work examines annotation coordination behaviors at multiple levels of analysis, including annotation distribution within groups, pairwise interactions, and the identification of collaboration behaviors through coordinated navigation. This study addresses the following questions: (1) How does individual annotation distribution, measured by Gini coefficients, vary across groups and relate to learning outcomes? (2) How do annotations influence the navigational choices and heading trajectories of their group members? (3) Can we identify distinct patterns and dynamics by analyzing coordinated navigation trajectories in response to peer annotations?
Integrating these research questions provides a nuanced understanding of the interrelations between individual contributions to group tasks, the influence of these contributions on group dynamics, and the resulting patterns of collaboration.
2. RELEVANT WORK
2.1 Collaboration in Immersive Learning Environments
Immersive learning environments, like Augmented Reality (AR), have emerged as an engaging platform for learning [11]. These environments enhance authentic learning experiences by facilitating a sense of immersion [32], and have shown to benefit face-to-face collaboration [32, 21]. These environments, however, also present challenges. Immersive platforms like AR headsets [14] and virtual environments where individuals often work on separate devices or interfaces [6] might hinder awareness of peer’s gaze and focus, potentially creating a disconnection between social interaction and problem spaces. This adds complexity to linking virtual objects to discussions and building shared understanding, raising questions how students interact and establish mutual awareness within these environments. Previous research has used monitoring tools (e.g., eye trackers and motion trackers) to capture student engagement [3], yet the finer details of how students navigate and interact within these virtual environments remain largely unexplored. This study bridges this gap by examining the reciprocal relationship between navigation decisions and annotations within an astronomy simulation.
2.2 Social Annotation
Social annotation (SA) tools enable users to create and share annotations such as comments, notes, explanations, or other types of external remarks on online resources [18, 36]. The collaborative nature of SA tools encourages annotation sharing with peers or group members, catalyzing discussions and enhancing knowledge sharing [33]. SA tools thus serves as social platforms that enable meaningful interactions and knowledge co-construction. Empirical studies in computer-supported collaborative learning contexts demonstrate SA’s potential benefits, including promoting knowledge sharing, inquiry learning, cognitive engagement, and idea argumentation [33, 15, 5, 20]. However, most research primarily focuses on analyzing the quantity and quality of annotations produced by initiators (i.e., annotators), with limited studies delving into how annotations are received and interacted with by peers. To the best of our knowledge, only few studies have analyzed annotation replies [5, 33, 35], suggesting that both annotations and replies were positive indicators of interactions. This gap warrants further investigation into the reciprocal nature of annotation interactions — how individual annotations influence peers’ attention of focus and shape collaboration processes. Such investigations can contribute to a better understanding of the potential of SA tools in supporting collective knowledge construction.
3. METHODS
3.1 Participants
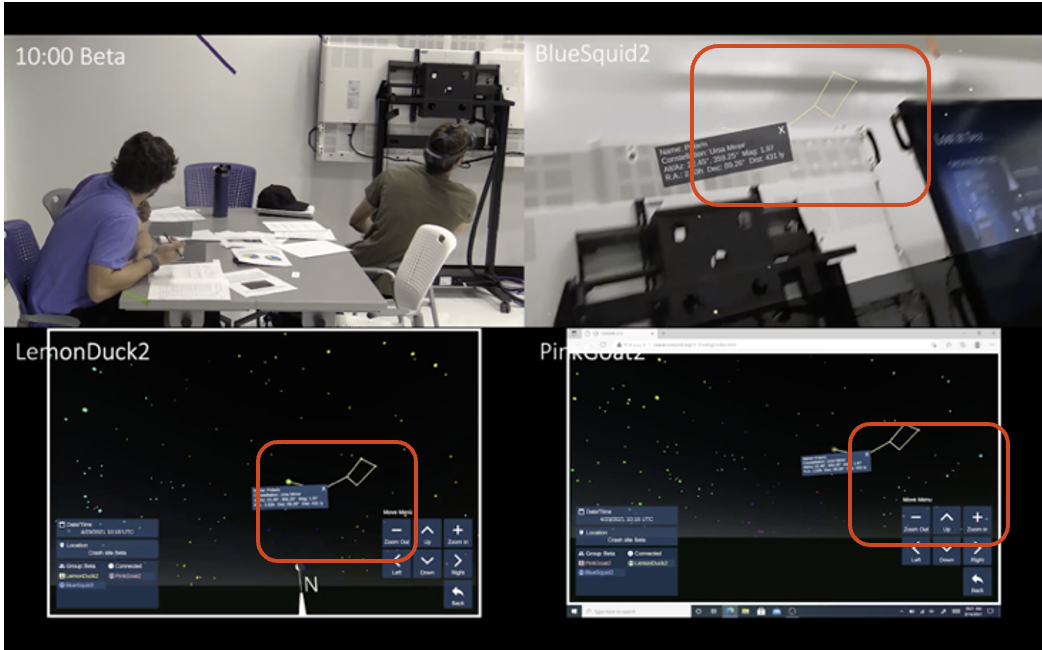
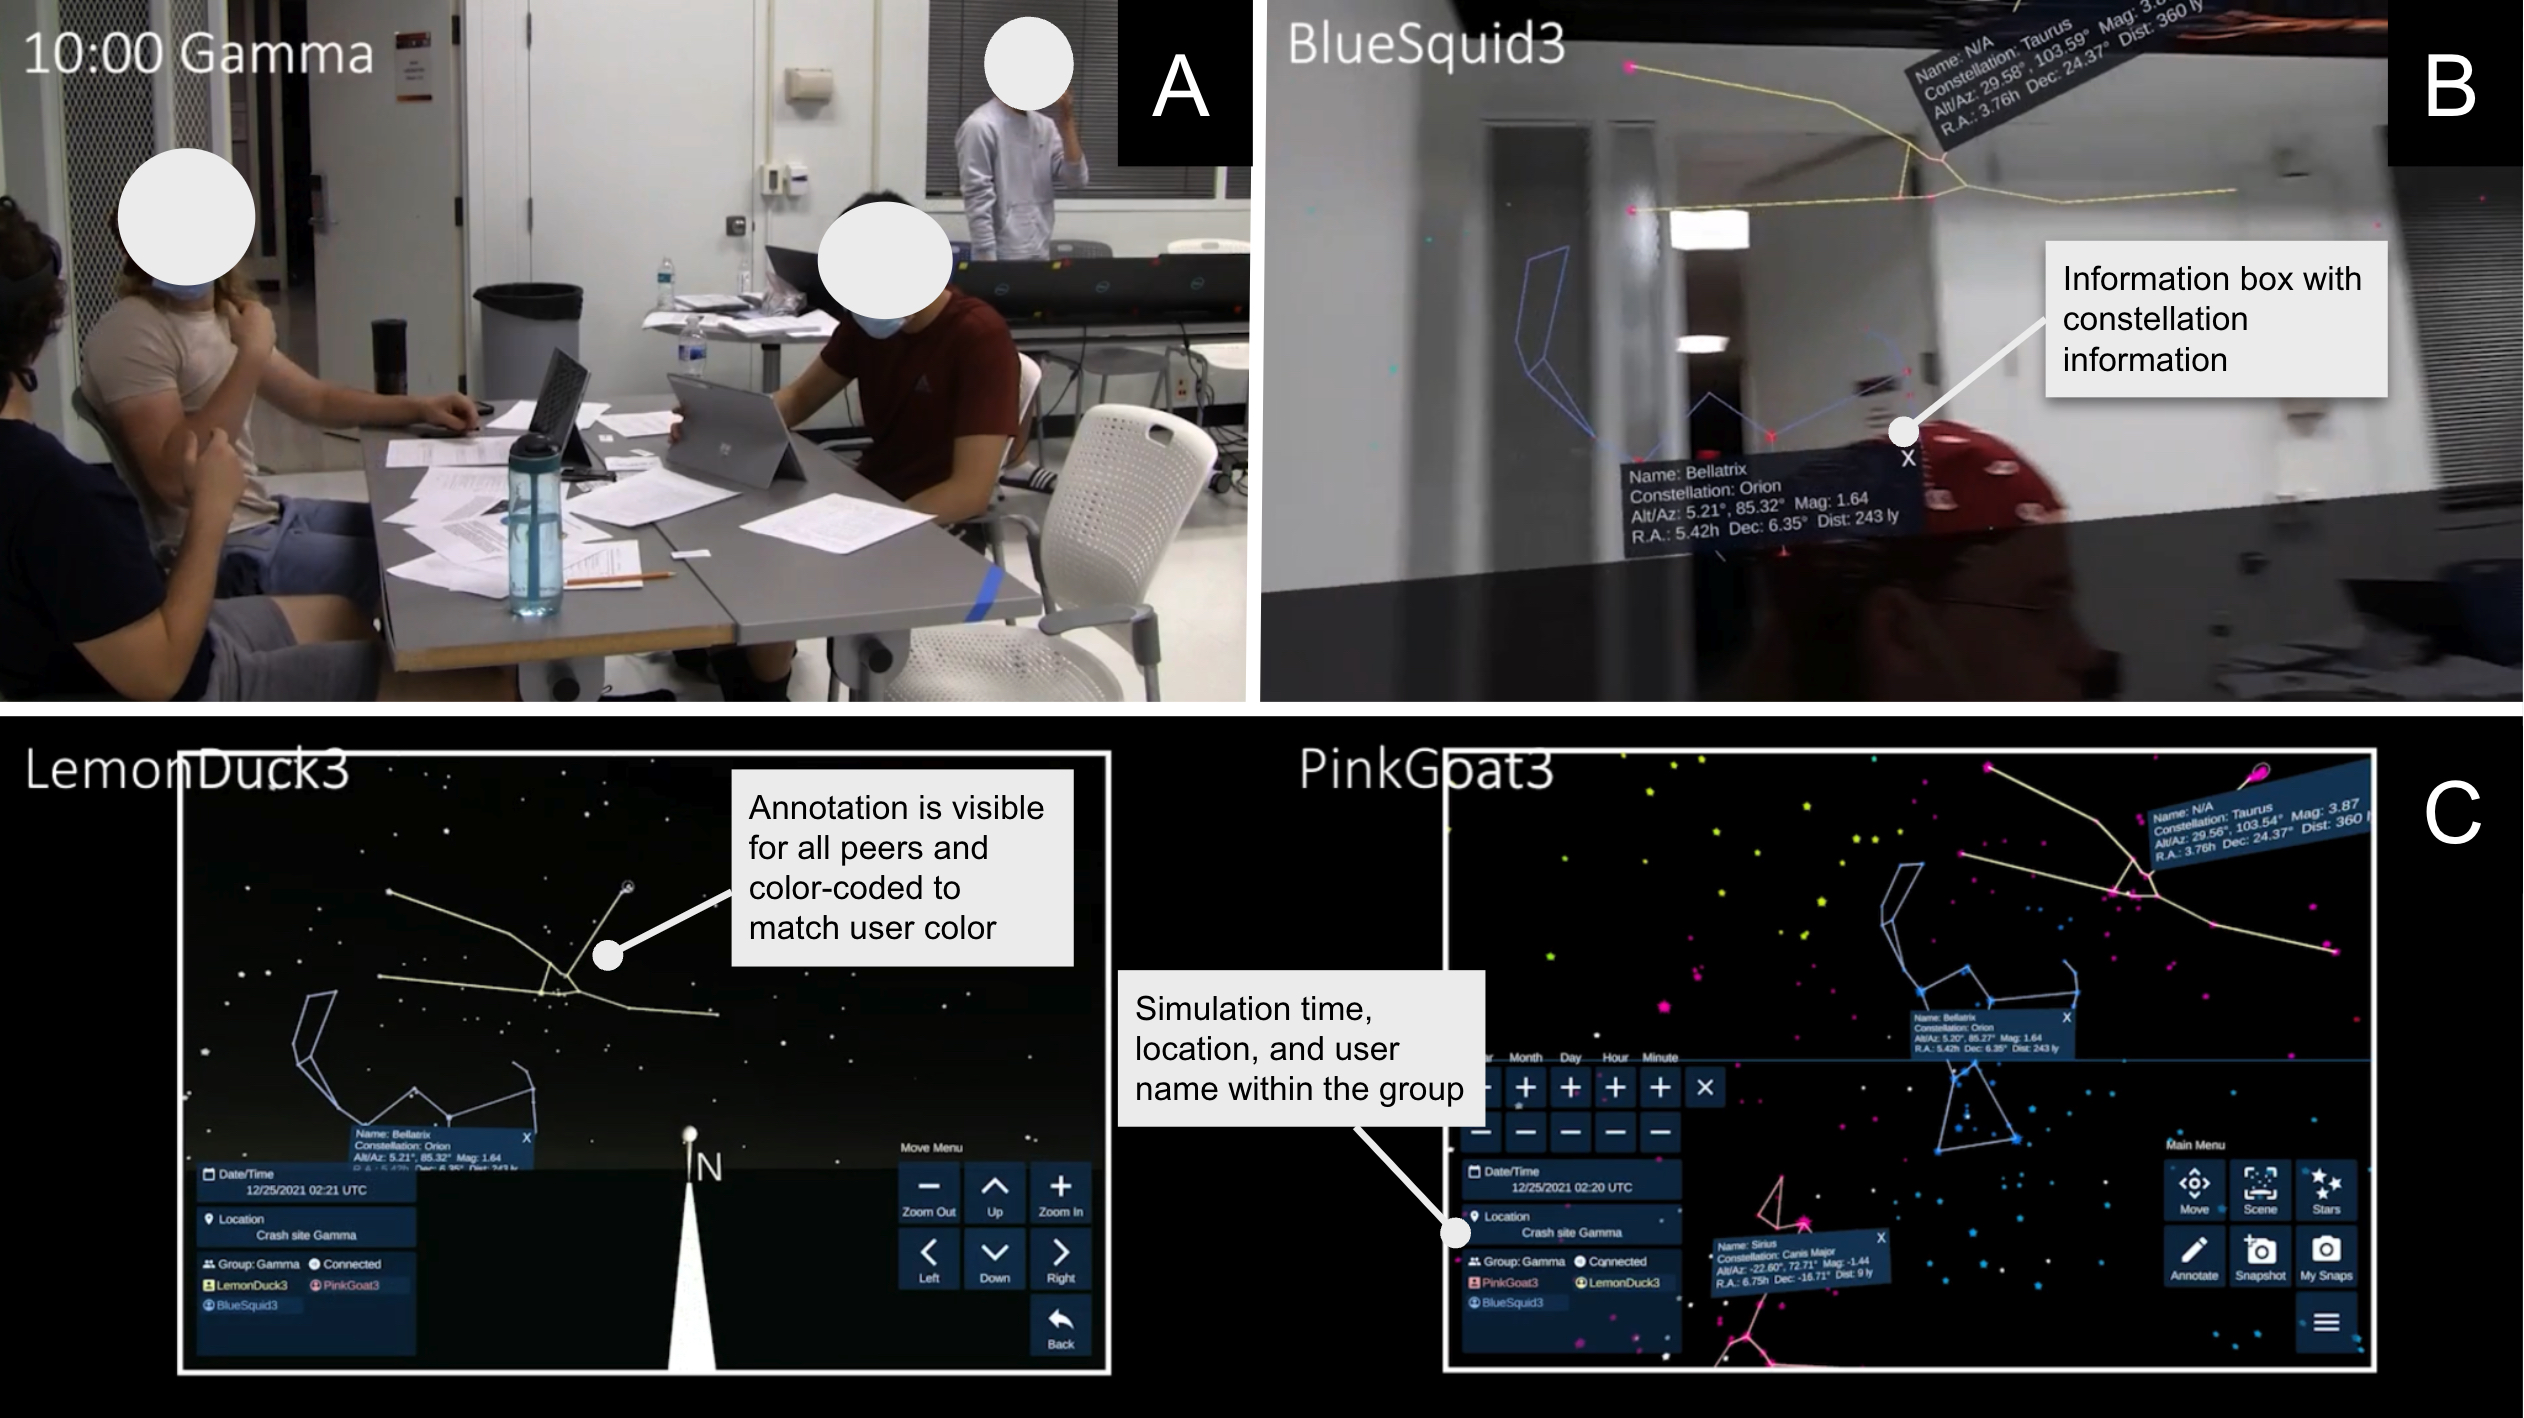
The participants included 77 undergraduates enrolled in an introductory astronomy course at a Midwestern United States university. The course included a main lecture and seven smaller discussion sections. Participants were randomly selected from three discussion sections to ensure diverse representation. Students participated in over three weekly 50-minute lab sessions: two introductory sessions and one simulation session. This cross-device simulation is networked between tablet and AR users within each group, allowing all members to annotate the constellations of interest, share location information, and transition to a peer’s locations and perspectives. Annotations trigger an information box displaying the star’s name, position, and constellation membership, with the constellation highlighted and visible to the whole group (see Appendix A). To foster accountability and recognition within the group, each group member was assigned a unique color to track their annotations. In the final session, students engaged in the "Lost at Sea" problem-solving task, determining the latitude and longitude of a space capsule’s unknown location using the simulation. The 4-part task involved identifying constellations to determine hemisphere and cardinal directions, then calculating latitude and longitude. Groups of 3-4 students was given one AR headset and two touch-based tablets, resulting in 25 groups. Participants had the option to work at a table where no data was collected; 16 groups remained for further analyses.
3.2 Data Sources
Log and assessment data were collected during the simulation session. Interaction logs recorded rows of events, where event = Username, Groupname, Device, Activity, Event, UTC time, Heading vectors, Simulation time, Crashsite, Location, Scene, Selected object, Selected star. A new event was logged each time students changed their heading, selected a star, switched scenes, or manipulated the simulation time. Heading vectors (x,y,z) captured the direction students faced (for AR) or moved their screen to look at (for Tablet) within the simulation. This study considers only x and y components, capturing horizontal and vertical movement. Analyzing sequences of these heading vectors enables tracing how students navigated the simulation space.
Pre-/post-assessments measured conceptual knowledge based on an open-ended question about latitude and longitude calculation. Individual responses were scored from 0 to 2 based on completeness and accuracy: 0 for incorrect, 1 for partially correct, and 2 for full understanding. Normalized learning gains were calculated as: (post-pre) / (post_max-pre) [13]. Groups were thus categorized as low-achieving (n=7, range: [-0.2222, 0.1667]) or high-achieving (n=9, range: [0.3125, 0.6875]) based the distribution of average gains and divergence in knowledge acquisition.
3.3 Analysis
Our analysis unfolds in three steps. We first examine the equity of annotation behaviors,leveraging the Gini coefficient to quantify the distribution of annotation contributions. This analysis examines whether specific students dominate the annotation, or contributions are more balanced. Next, we explore how individual annotations influence the navigation and heading trajectories of their peers. This is achieved by tracking the change in heading direction after an annotation was made and comparing it to the annotator’s heading. The variances in heading trajectories represent the extent to which individual actions can redirect the focus of their peers. Finally, we employ Dynamic Time Warping to uncover responsive patterns to annotations. By tracking the frequency of each identified pattern, we analyze how these patterns evolve over time and how they differ across learning performance levels.
3.3.1 Gini Coefficient
Gini coefficient quantifies the distribution of annotation behaviors within the group. This metric assess inequality in distribution, ranging from 0 (perfect equality) to 1 (maximum inequality; all contributions are made by a single student). The Gini coefficient for unordered data was calculated using the following formula [10, 7]: \begin {equation} G = \frac {\sum _{i=1}^{n}\sum _{j=1}^{n} |x_i - x_j|}{2n^2\mu } \end {equation} where \( n \) represents the total number of students within the group, \( x_i \) and \( x_j \) respresent the counts of annotations made by the \( i^{th} \) and \( j^{th} \) students respectively, and \( \mu \) is the average count of annotations per group.
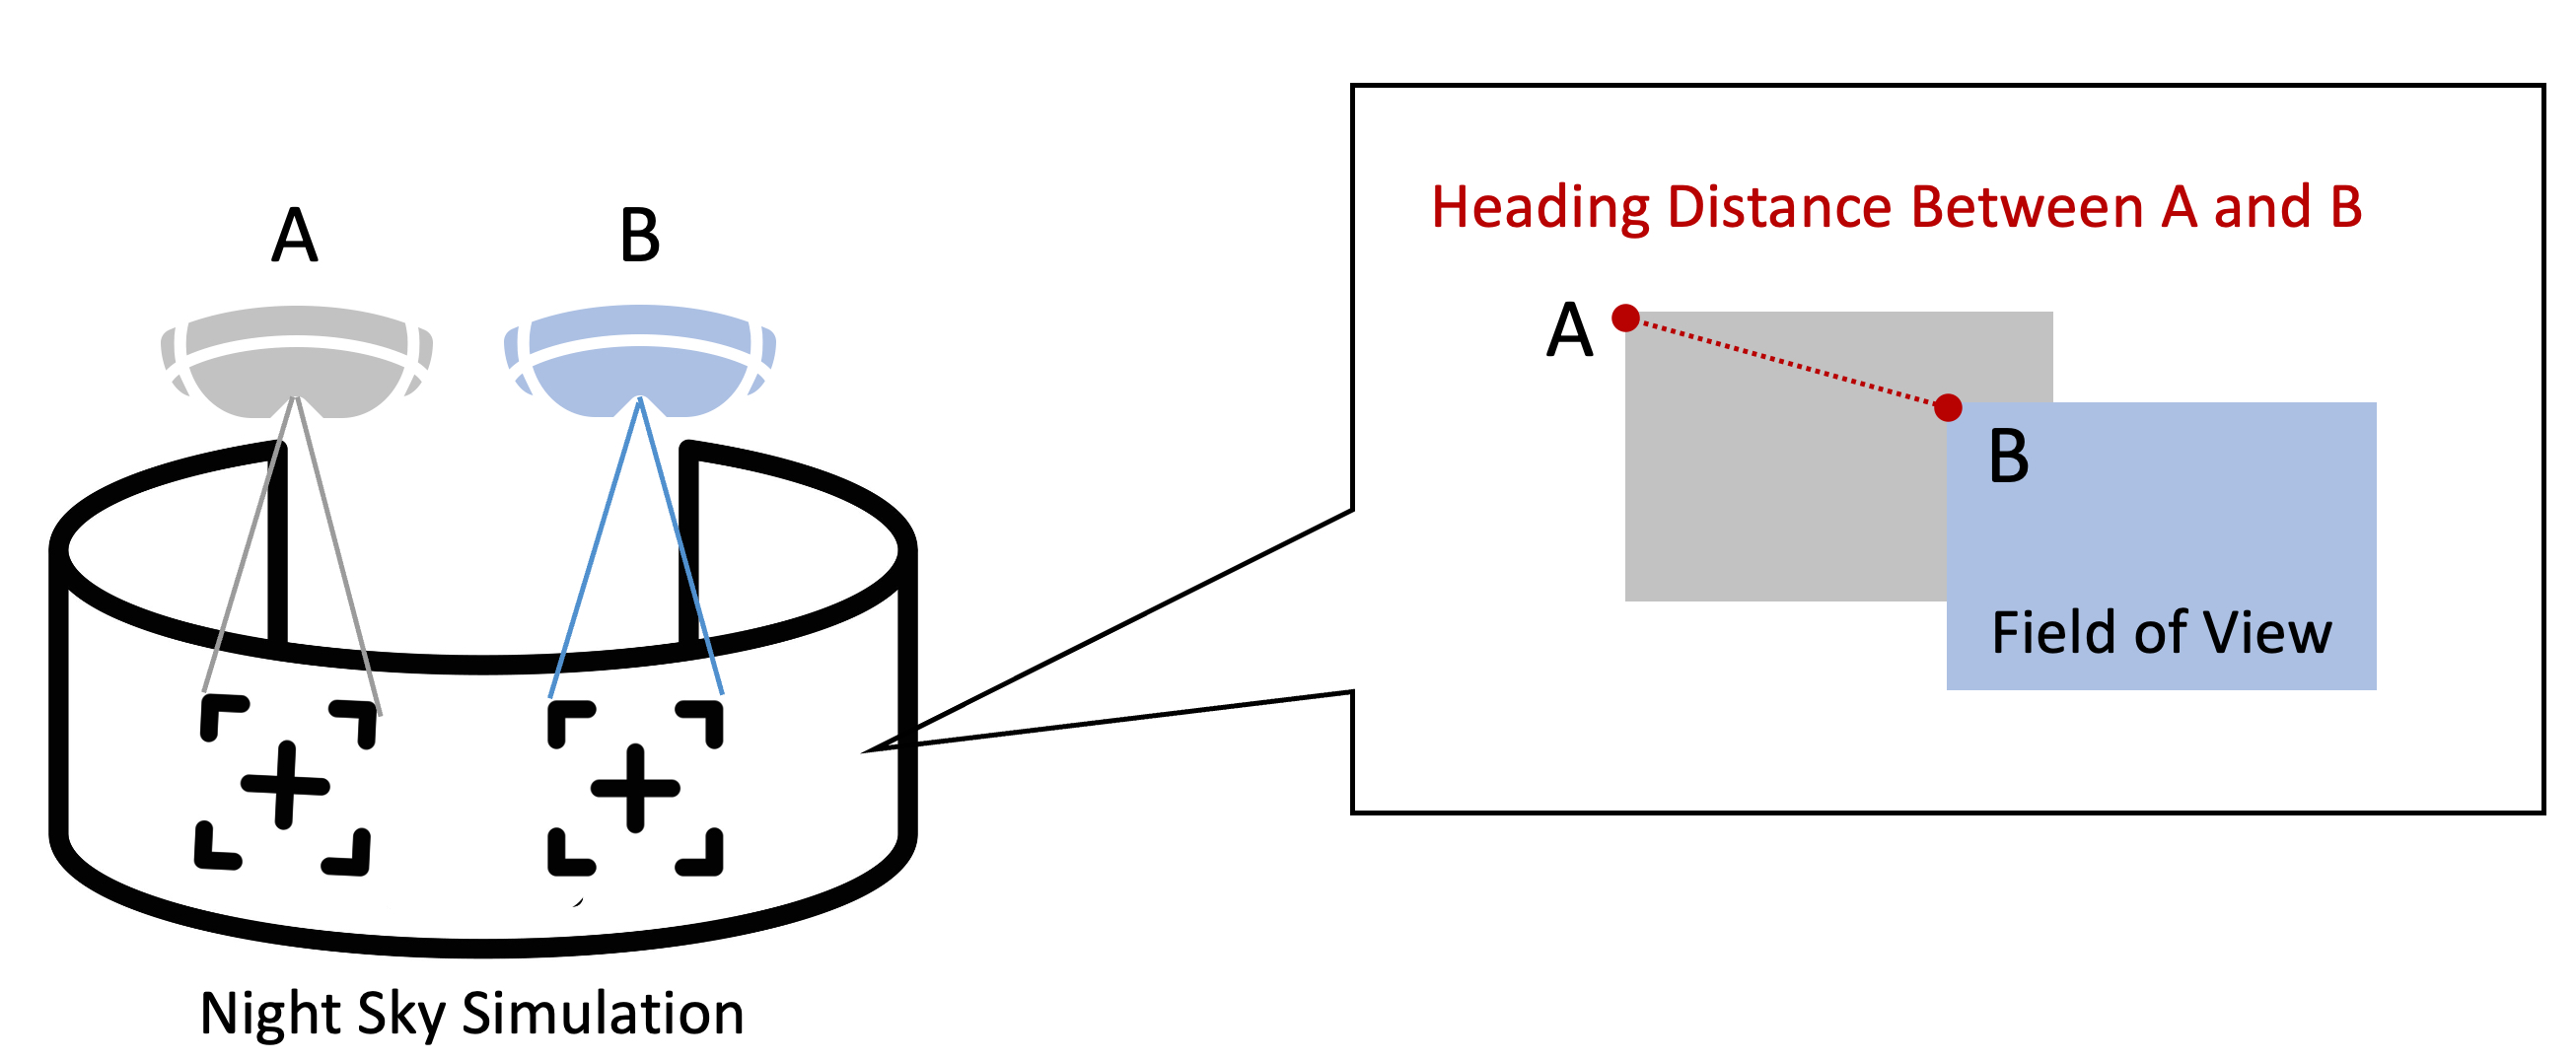
3.3.2 Heading Distance Trajectories
Fig. 6 illustrates how heading distances are represented and quantified. The heading distance measures the degree of overlap in their fields of view, calculated as: \begin {equation} d_{\text {Euclidean}} = \sqrt {(x_1 - x_2)^2 + (y_1 - y_2)^2} \end {equation} Here, \( x_1 \) and \( y_1 \) represent the annotator’s heading vector at the moment of annotations, while \( x_2 \) and \( y_2 \) denote the heading vector of another student. These heading vectors act as digital “gazes”, indicating where students were looking within the simulated night sky. A smaller distance suggests potential alignment in their attention and focus as their “gazes” were closer together.
Since our goal is to understand how a student’s focus changes in response to peer annotations, we tracked their heading distances for 80 seconds following each annotation event, resulting in heading distance trajectories. This timeframe is chosen as we observed a significant drop in the frequency of responsive behaviors after 80 seconds, suggesting that most meaningful responses to annotations occur within this time window. We standardized the time sequence at 5-second increments (0, 5, 10, 15, 20... up to 80 seconds), where 0 represents the moment of annotation. At each time point, heading distances were assigned based on the closest available data, ensuring the continuity and comparability of heading trajectories. By tracking changes in heading direction relative to the annotator’s initial focus, we could quantify the impact of annotations.
3.3.3 DTW Clustering
Dynamic Time Wrapping (DTW) is an algorithm that calculates the optimal alignment between two time series sequences [17, 1]. It allows for flexible matching between data by wrapping the time axis iteratively and the resulting DTW distances can be used as input for cluster analysis. The optimal number of clusters was determined by the Silhouette method [24]. We used tslearn package in Python [28] to perform DTW clustering on the heading distance trajectories to analyze attention change following peer annotation and categorize these trajectories into broader behavioral clusters. This categorization captures the degrees of similarity in how students adjusted their heading (i.e., digital "gazes") in response to peer annotations.
4. RESULT
4.1 RQ 1: Participation Equity
In addressing our first research question, we evaluated the equity of participation via annotation within the simulation. The Gini coefficient was employed to examine three dimensions: total annotations initiated throughout the session, unique constellation annotations, and frequency of being the first to annotate a constellation. Each metric reflects a distinct aspect of participation: total annotations measure overall engagement, unique annotations reflect the breadth of participation in navigating the problem space through exploring diverse constellations, and first annotations evaluate initiatives in exploring new celestial objects.
Table 1 presents a comparative analysis of the Gini coefficient for these metrics across groups with varying performance levels. Significant differences were observed between low- and high-achieving groups. Notably, the Gini coefficients were significantly higher in high-achieving groups, suggesting that these groups exhibited a more unequal distribution of total annotations. This pattern was consistent across the analysis of unique annotated constellations and first annotations, indicating greater inequality in these metrics within high-achieving groups.
| Gini Coefficient | T-statistic | P-value | Effect Size |
|---|---|---|---|
| Total Annotations | -3.12 | 0.008 | -1.65 |
| Unique Annotations | -3.03 | 0.009 | -1.61 |
| First Annotations | -3.30 | 0.005 | -1.73 |
4.2 RQ 2: Influence of Annotations
In response to our second research question, we computed the heading distance as a measure of directional difference between digital “gazes”, reflecting where students were looking within the simulated night sky relative to the annotated object. Shorter distances reflect more closely aligned “gazes” and a greater overlap in fields of view. In our context, an overlap in the fields of view means students looking at similar areas of the simulated sky (see Appendix B), indicating a level of shared attention and focus directed towards the annotated constellations. We can infer the degree of visual overlap from the heading distance between students (see Fig. 6 for the relationship between heading distance and the percentage overlap of students’ fields of view). For example, a heading distance of around 80 indicates minimal overlap in their fields of view, while a distance shorter than 50 corresponds to 35% overlap of their fields of view. Moreover, we visualized the heading distance trajectories – sequences of distances calculated at 5-second intervals for 80 seconds following each annotation – to track students’ responsive behaviors following peer contributions. There were 973 different trajectories generated in total.
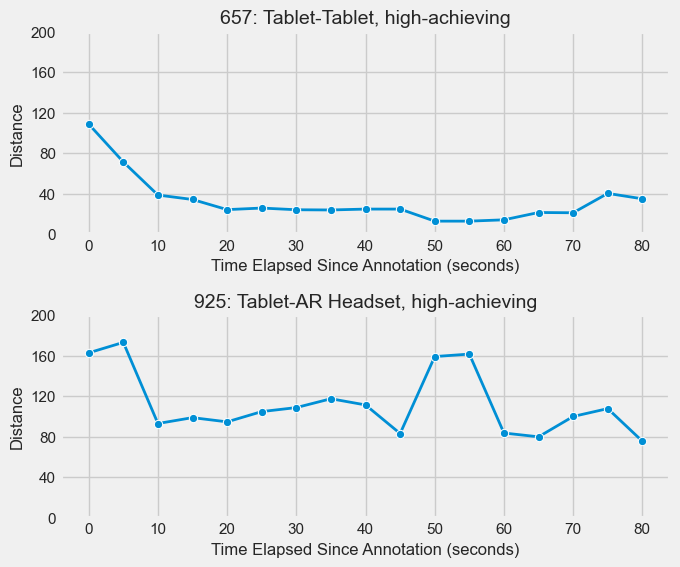
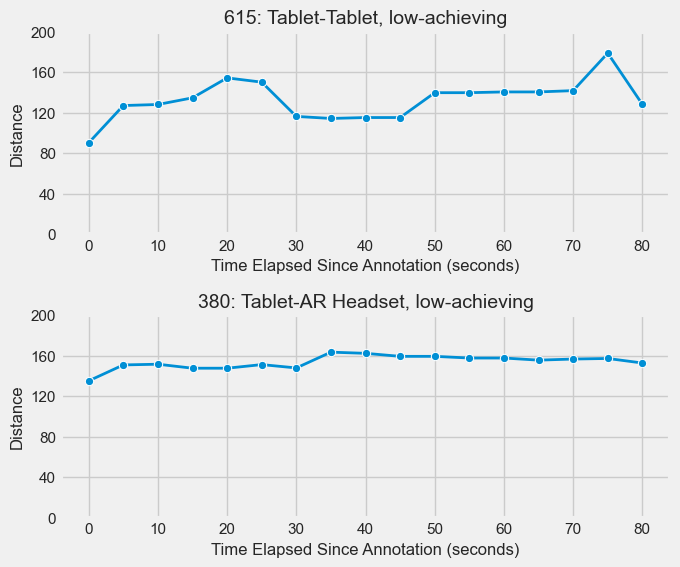
Fig. 2 and Fig. 3 showcase two distinct trajectories, encompassing both tablet-tablet and tablet-AR Headset interactions, drawn from both high-achieving and low-achieving groups. The x-axis represents the time elapsed since the annotation was highlighted within the simulation, while the y-axis documents the heading distance between a pair of students. When the trajectory is trending downward, it indicates that the student moved closer to the annotation. This pattern suggests efforts or intention to align their simulation view with the annotated constellation to establish joint attention within the simulation. For example, trajectory 657 shows a rapid decrease in heading distance within 10 seconds after the annotation, signifying an immediate focus shift towards the annotated constellation. In contrast, an upward trend or minimal change in heading distance, as illustrated in trajectories 380 and 615, could indicate prioritization of individual exploration without paying attention to peer contributions. This might suggest students value independent navigation and discovery, or perceive the annotation as less relevant to their current exploration path.
4.3 RQ 3: Responsive Patterns
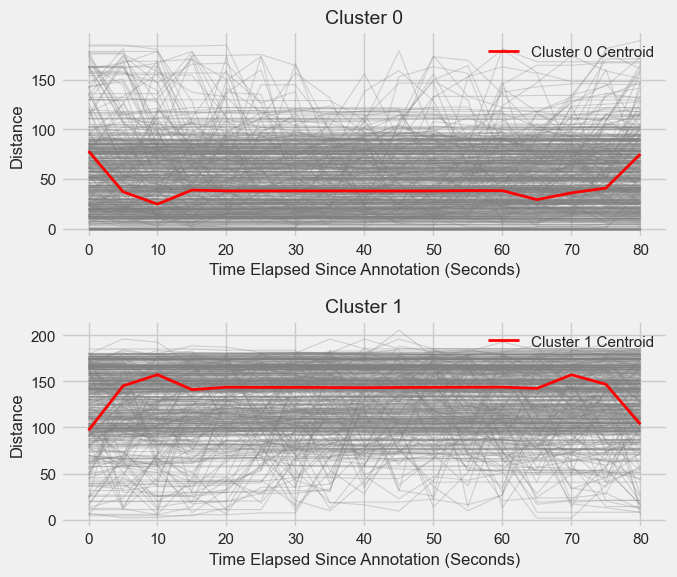
We employed DTW clustering to reveal distinct response patterns to peer annotations. Analyzing silhouettes from 2 to 8 clusters yielded an optimal value of k=2. Figure 4 visualizes all the heading trajectories within each cluster with their respective centroids highlighted in red. Two distinct response patterns to peer annotations emerged: immediate response (Cluster 0) and independent exploration (Cluster 1). The immediate response pattern, characterized by a rapid decrease in distances between students’ heading vectors, likely indicates a prompt shift in attention towards peer-annotated constellations. This suggests students actively engage with peer contributions by moving their screen to the annotated constellations within the simulation. The independent exploration pattern, on the other hand, does not show a decreasing trend in the distance of heading vectors within the defined time period. This pattern suggests that students may prioritize individual exploration and focus on their own navigation paths without responding to peer annotations.
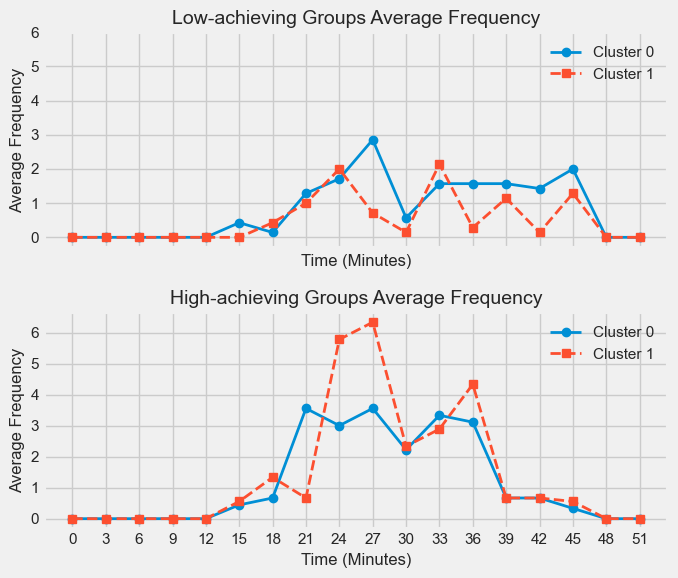
Further analysis explored the temporal evolution of these response patterns. Figure 5 displays the frequency of each cluster over time for both performance groups. Both groups initially exhibited minimal annotation activity, suggesting prioritization of independent exploration at the beginning. Interestingly, as the session progressed, differences emerged. While the exhibition of Cluster 0 behavior remained comparable across groups, there was variation in the demonstration of Cluster 1 behavior between high-achieving and low-achieving groups. Specifically, high-achieving groups displayed a higher frequency of Cluster 1, indicative of independent exploration without immediate response to peer annotations, particularly during the middle of the session.
5. DISCUSSION
Our findings shed light on the intricacies of collaborative learning within the simulation environment, showcasing the interplay between individual behaviors, group dynamics, and learning outcomes.
Notably, higher learning achievement was not associated with equitable participation in annotation activities. High-achieving groups exhibited a more unequal distribution of annotation contributions compared to low-achieving groups. This finding underscores the complex relationship between participation equity and learning achievement, suggesting that more equitable participation does not necessarily lead to higher learning gains. Instead of solely viewing this distribution as a lack of equity, we propose an alternative interpretation. This pattern may suggest the natural emergence of leader-follower roles, where specific individuals lead the annotation activity and guide the exploration process, while others coordinate with annotators. This finding aligns with Webb’s notion of group composition, where students often adopt different roles during collaboration [31]. These roles have been identified through various data sources under collaboration settings, including verbal and physical indicators [26], focus of attention based on eye-tracking data [25], and video-based facial emotions [9]. For instance, [26] identified four distinct collaboration profiles, including turn takers, driver-navigator, driver-passenger, and independent based on verbal and physical indicators of collaboration. These profiles inform us about the dynamic roles emergent within the group, ranging from shared leadership to a more centralized pattern. Further exploration is needed to unpack these various roles emerging in collaboration, such as leader and follower, and how they may hinder or contribute to efficient collaborative learning.
Furthermore, exploring the temporal evolution of these patterns across the session yielded another interesting finding. High-achieving groups displayed a higher frequency of the independent exploration pattern during the middle of the session. This could indicate a collaboration strategy with a focus on individual understanding and exploration before building joint attention, aligning with research highlighting the benefits of temporary divergence within collaborative learning. Individual explorations could benefit the entire group by gathering unique perspectives and information to enrich the knowledge pool and facilitate the idea exchange when groups re-establish shared attention [16, 34]. Convergence is not necessarily the only marker of effective collaboration, especially in exploratory environments [29]. According to Divergent Collaboration Learning Mechanisms framework [30], participants can move between shared and divergent goals during their investigation especially in open-ended settings. In our astronomy simulation, individual exploration may indicate engaging in divergent inquiry or testing personal hypotheses before converging to share findings and build shared understanding. This divergence-convergence cycle could also explain why high-achieving groups did not exhibit high participation equity in annotation activities.
In summary, our findings highlight the nuances beyond participation equity and the generally accepted notion that convergent conceptualization is the desired goal for collaborative learning.
5.1 Implications and Future Studies
This study has several limitations that highlight areas for further research. Firstly, we have a relatively small sample size containing only 16 groups. Future research should apply this analysis to a larger size of dataset. Secondly, relying on heading trajectories within the simulation provides a limited perspective on collaborative interactions. Future studies incorporating richer data sources like verbal communication could capture interactions within and beyond the simulation, offering a more holistic understanding. Finally, the specific task and exploratory nature of our astronomy simulation might influence the role of divergent exploration and the observed collaboration patterns. Investigating how these patterns persist or differ across diverse contexts will broaden our understanding of individual contributions and their impact on group learning.
6. CONCLUSION
This study explored collaborative learning dynamics in an astronomy simulation environment, shedding light on the interplay between individual behaviors, group dynamics, and learning outcomes. Our results yielded insights about participation equity, the influence of annotations on student focus, and responsive patterns to peer interactions. In specific, high-achieving groups had a less equal distribution of annotation contributions, potentially reflecting the emergence of leader-follower roles. Utilizing the time series clustering technique, we identified two distinct patterns in how individuals responded to peer annotations within the simulation: one pattern focused on individual exploration, while the other involved an immediate response to achieve virtual alignment. Tracking the frequency of these two patterns, we found a key difference between groups varying in learning performance: high-achieving groups engaged in more individual exploration during the middle of the session. These results collectively underscore the complexity of collaborative learning, recognizing the role of individual exploration as a valuable component of collaborative learning. The results suggest that such exploration, particularly within exploratory open-ended learning environments, can contribute to group discussions and collective understanding. Our study echoes existing research by highlighting the benefits of temporary divergence in collaborative learning, particularly in open-ended and exploratory learning environments like our astronomy simulation.
7. ACKNOWLEDGMENTS
This study was supported by the National Science Foundation (1822796). Any conclusions expressed in this material do not necessarily reflect the views of the NSF. The authors acknowledge the assistance of ChatGPT in the editing and proofreading process of this manuscript.
8. REFERENCES
- Dynamic time warping. In M. Müller, editor, Information Retrieval for Music and Motion, pages 69–84. Springer, 2007.
- S. Akkerman, P. Van den Bossche, W. Admiraal, W. Gijselaers, M. Segers, R.-J. Simons, and P. Kirschner. Reconsidering group cognition: From conceptual confusion to a boundary area between cognitive and socio-cultural perspectives? Educational Research Review, 2(1):39–63, 2007.
- M. Akçayır and G. Akçayır. Advantages and challenges associated with augmented reality for education: A systematic review of the literature. Educational Research Review, 20:1–11, 2017.
- M. Borge, T. Aldemir, and Y. Xia. How teams learn to regulate collaborative processes with technological support. Educational technology research and development, 70(3):661–690, 2022.
- J. W. W. Chan and J. W. C. Pow. The role of social annotation in facilitating collaborative inquiry-based learning. Computers & Education, 147:103787, 2020.
- C.-J. Chang, M.-H. Chang, B.-C. Chiu, C.-C. Liu, S.-H. Fan Chiang, C.-T. Wen, F.-K. Hwang, Y.-T. Wu, P.-Y. Chao, C.-H. Lai, S.-W. Wu, C.-K. Chang, and W. Chen. An analysis of student collaborative problem solving activities mediated by collaborative simulations. Computers & Education, 114:222–235, 2017.
- C. Damgaard and J. Weiner. Describing inequality in plant size or fecundity. Ecology, 81(4):1139–1142, 2000.
- P. Dillenbourg, M. Baker, A. Blaye, and C. O’Malley. The evolution of research on collaborative learning. In Learning in Humans and Machine: Towards an interdisciplinary learning science, pages 189–211. Oxford: Elsevier, 1996.
- M. Dindar, S. Jarvela, S. Ahola, X. Huang, and G. Zhao. Leaders and followers identified by emotional mimicry during collaborative learning: A facial expression recognition study on emotional valence. 13(3):1390–1400, 2022.
- P. M. Dixon, J. Weiner, T. Mitchell-Olds, and R. Woodley. Bootstrapping the gini coefficient of inequality. Ecology, 68(5):1548–1551, 1987. Publisher: Ecological Society of America.
- M. Dunleavy, C. Dede, and R. Mitchell. Affordances and limitations of immersive participatory augmented reality simulations for teaching and learning. Journal of Science Education and Technology, 18(1):7–22, 2009.
- S. Gerry, T. Koschmann, and D. Suthers. Computer-supported collaborative learning: An historical perspective. In Cambridge Handbook of the Learning Sciences, volume 2006, page 409. 2006. Journal Abbreviation: Cambridge Handbook of the Learning Sciences.
- R. R. Hake. Interactive-engagement versus traditional methods: A six-thousand-student survey of mechanics test data for introductory physics courses. American Journal of Physics, 66(1):64–74, 1998.
- E. Hoppenstedt, I. Radu, T. Joy, and B. Schneider. Augmented reality in collaborative problem solving: A qualitative study of challenges and solutions. In International Conference on Computer Supported Collaborative Learning, 2021.
- J.-C. Jan, C.-M. Chen, and P.-H. Huang. Enhancement of digital reading performance by using a novel web-based collaborative reading annotation system with two quality annotation filtering mechanisms. International Journal of Human-Computer Studies, 86:81–93, 2016.
- M. Kapur, J. Voiklis, and C. K. Kinzer. Sensitivities to early exchange in synchronous computer-supported collaborative learning (CSCL) groups. Computers & Education, 51(1):54–66, 2008.
- E. Keogh and C. A. Ratanamahatana. Exact indexing of dynamic time warping. 7(3):358–386, 2005.
- A. Krouska, C. Troussas, and M. Virvou. Social annotation tools in digital learning: A literature review. In 2018 9th International Conference on Information, Intelligence, Systems and Applications (IISA), pages 1–4. IEEE, 2018.
- M. Laal and S. M. Ghodsi. Benefits of collaborative learning. 31:486–490, 2012.
- S. Li, J. Pow, and W. Cheung. A delineation of the cognitive processes manifested in a social annotation environment. Journal of Computer Assisted Learning, 31(1):1–13, 2015. _eprint: https://onlinelibrary.wiley.com/doi/pdf/10.1111/jcal.12073.
- T.-J. Lin, H. B.-L. Duh, N. Li, H.-Y. Wang, and C.-C. Tsai. An investigation of learners’ collaborative knowledge construction performances and behavior patterns in an augmented reality simulation system. Computers & Education, 68:314–321, 2013.
- A. Meier, H. Spada, and N. Rummel. A rating scheme for assessing the quality of computer-supported collaboration processes. International Journal of Computer-Supported Collaborative Learning, 2:63–86, 2007.
- S. Puntambekar, G. Erkens, and C. Hmelo-Silver. Analyzing interactions in CSCL: Methods, approaches and issues, volume 12. Springer Science & Business Media, 2011.
- P. J. Rousseeuw. Silhouettes: a graphical aid to the interpretation and validation of cluster analysis. Journal of computational and applied mathematics, 20:53–65, 1987.
- B. Schneider and R. Pea. Real-time mutual gaze perception enhances collaborative learning and collaboration quality. 8(4):375–397, 2013.
- O. Shaer, M. Strait, C. Valdes, T. Feng, M. Lintz, and H. Wang. Enhancing genomic learning through tabletop interaction. In Proceedings of the SIGCHI Conference on Human Factors in Computing Systems, pages 2817–2826. ACM, 2011.
- G. Stahl, T. Koschmann, and D. Suthers. Computer-supported collaborative learning: An historical perspective. In Cambridge handbook of the learning sciences, pages 409–426. Cambridge University Press, 2006.
- R. Tavenard, J. Faouzi, G. Vandewiele, F. Divo, G. Androz, C. Holtz, M. Payne, R. Yurchak, M. Rußwurm, K. Kolar, and E. Woods. Tslearn, a machine learning toolkit for time series data. Journal of Machine Learning Research, 21(118):1–6, 2020.
- M. Tissenbaum. I see what you did there! divergent collaboration and learner transitions from unproductive to productive states in open-ended inquiry. Computers & Education, 145:103739, 2020.
- M. Tissenbaum, M. Berland, and L. Lyons. DCLM framework: understanding collaboration in open-ended tabletop learning environments. International Journal of Computer-Supported Collaborative Learning, 12(1):35–64, 2017.
- N. M. Webb, K. M. Nemer, A. W. Chizhik, and B. Sugrue. Equity issues in collaborative group assessment: Group composition and performance. 35(4):607–651, 1998. Publisher: American Educational Research Association.
- H.-K. Wu, S. W.-Y. Lee, H.-Y. Chang, and J.-C. Liang. Current status, opportunities and challenges of augmented reality in education. Computers & Education, 62:41–49, 2013.
- S. J. Yang, J. Zhang, A. Y. Su, and J. J. Tsai. A collaborative multimedia annotation tool for enhancing knowledge sharing in CSCL. Interactive Learning Environments, 19(1):45–62, 2011.
- Y. Zhou and J. Kang. Enriching multimodal data: A temporal approach to contextualize joint attention in collaborative problem-solving. Journal of Learning Analytics, 10(3):87–101, 2023.
- Y. Zhou and J. Kang. I know where you are looking! broadening the notion of annotation in a collaborative immersive simulation environment. Proceedings of the 18th International Conference of the Learning Sciences - ICLS 2024, 2024.
- X. Zhu, B. Chen, R. M. Avadhanam, H. Shui, and R. Z. Zhang. Reading and connecting: using social annotation in online classes. Information and Learning Sciences, 121(5):261–271, 2020. Publisher: Emerald Publishing Limited.
APPENDIX
A. APPENDIX A
The figure contains screencaptures from classroom and three devices (A: classroom; B: AR screen; C: tablet screens). It also illustrates the information box alongside each annotation within the simulation.
B. APPENDIX B
This figure shows overlapping fields of views across three devices in CEASAR simulation.