ABSTRACT
This work aims to develop a fairness-aware model while maintaining competitive predictive accuracy in online learning environment. We retrieved a large dataset that included 3,145,728 video watch log entries and 893,189 assessment results from 14,252 students on an online learning platform. Six classic machine learning (ML) models were built to predict changes in student summative performance. Our findings indicate that prediction bias exists for groups with varying demographics when using models that lack fairness awareness. To enhance fairness, we optimized the existing treatment equality metric, which was previously limited to assessing a single sensitive attribute, to evaluate the overall fairness on multiple attributes of the prediction model. Additionally, we introduced a treatment equality loss function penalty term to constrain the models’ training. The results demonstrate that our method can achieve comparable predictive performance while ensuring treatment equality across different groups.
Keywords
1. INTRODUCTION AND PRIOR WORK
Online learning has gained popularity due to its flexibility and accessibility [8, 25]. To assess the quality of online learning or provide timely interventions for students’ learning needs, accurately measuring students’ academic performance is particularly essential [3]. In the era of generative artificial intelligence (AI), predicting students’ academic performance in online learning environments through advanced data analytics and machine learning (ML) techniques has become a common practice [22].
Existing research on predicting academic performance in online learning environments has primarily focused on feature or model selection to enhance the predictive performance (e.g., accuracy and F1 score) of ML models [28, 25, 4]. For instance, some studies have explored how to convert educational log data into features suitable for building predictive models of student academic performance [6, 21], while others have compared the prediction accuracy of various models across different dataset features [1]. Previous studies also indicate that students’ behavioral data can significantly enhance predictions of their performance [28, 33, 32, 10, 31]. Learning behaviors, such as total login times, video consumption habits, engagement with test questions, and interactions with learning materials, are crucial for predicting students’ academic performance [12].
Using ML models to predict future performance can help teachers proactively assist students in achieving better academic outcomes and prevent dropouts [1]. However, employing ML models for prediction in educational settings raises significant concerns about fairness and bias. For instance, a lack of diversity in the training data can lead to inaccurate performance predictions for students from various socio-economic backgrounds, resulting in bias that disadvantages certain groups. This in turn affects the equitable distribution of educational resources and individual educational opportunities [17]. In a study, African American students were found to be almost twice as likely to be incorrectly predicted to be at risk of academic failure as their White counterparts due to historical biases in data [2]. Algorithmic bias in ML models can perpetuate existing inequalities and lead to discriminatory outcomes, particularly affecting students’ academic success [13]. Addressing fairness concerns in AI models is crucial to ensure equitable treatment and opportunities for all students in online learning environments [17].
This study focuses on ensuring fairness in performance predictive models used in online learning environments. By collecting a large dataset from an online learning platform and building six classic ML models, we provide further evidence that ML models lacking fairness-awareness exhibit prediction bias across different demographic groups. To combat this, we improved the original treatment equality metric, which was limited to comparing only two groups, to evaluate the model’s overall fairness. We also proposed a new treatment equality loss function penalty term for the model’s training to ensure better fairness. Furthermore, we incorporated this treatment equality loss function penalty into the LR model. Our findings demonstrate that our method can achieve comparable predictive performance while ensuring treatment equality across different groups. Based on the context of the prediction task, our main contributions include: (1) adapting the existing treatment equality fairness metric to assess overall fairness across multiple sensitive attributes, and (2) developing a novel approach that integrates fairness constraints into ML models while considering multiple sensitive attributes.
2. METHOD
2.1 Data Source Description
We collected data from Math Nation1, an extensive online learning platform serving over a million K-12 students and teachers across the United States. The platform offers students learning videos for each unit and enables them to assess their understanding through quizzes. The initial dataset included 3,145,728 learning log entries and 893,189 in-platform assessment results from 14,252 students2. This research and its data collection procedures received approval from the Institutional Review Board of the University of Florida (document number: IRB202201770).
2.2 Data Pre-processing and Feature Selection
Based on previous work, we processed all variables from the log data and categorized them into three levels: demographic, historical performance, and learning behavior. We used Pearson correlation coefficients and Variance Inflation Factor (VIF) [15] to filter out variables with a high degree of correlation (greater than 0.8) or a large VIF value (VIF > 10). Finally, we included all independent variables shown in Table 1, totaling 20 variables. The demographic data, which include Gender, Frl_Status, Race_Indicator, and His_Indicator, are used to identify groups and compare fairness during the fairness evaluation. In addition to demographic data, we incorporated three variables related to students’ learning performance and 13 variables concerning online learning behavior under the learning behavior category.
To predict changes in students’ summative performance, we collected their high school entrance exam FSA3 Math scores (listed as Fsa_Level in Table 1) and their state end-of-course (EOC) exam results. We then computed the dependent variable “risk"4, which represents the change in students’ performance. After removing students with missing log data, we compiled a dataset consisting of 4,834 students. We excluded all students with missing log data to prevent introducing bias through imputation methods [24].
| Category | Variable | Description | Value/Type |
|---|---|---|---|
| Demographic | Gender | Whether the student is male or female | No: 0; Yes: 1 |
| Frl_Status | Whether the student has free lunch or not | No: 0; Yes: 1 | |
| Race_Indicatoar | Whether the student is minority or not | No: 0; Yes: 1 | |
| His_Indicator | Whether the student is hispanic or not | No: 0; Yes: 1 | |
| Historical performance | Fsa_Level | The math achievement level of the student | 1-5 |
| Retaker | Whether the student retake the exam | No: 0; Yes: 1 | |
| Total_Absences | Total class absence times | 0-77 | |
| Learning Behavior | Sum_Session | Total login times | 2-2348 |
| Video_Watched | Total number of videos the student watched | 1-236 | |
| Total_Video_Time | Total time the student spent on video | 0-185h | |
| Video_Cpl | Number of video the student completed | 0-589 | |
| Video_Pause | Number of pause actions | 0-42251 | |
| Video_Play | Number of play actions | 0-42175 | |
| Video_Seek | Number of video progress adjustment actions | 0-64900 | |
| Correct_Answer_Rate | Average correct rate of answered questions | 0-1 | |
| Tys_Finish | Number of test questions finished | 0-274 | |
| Tys_Previous | Number of review old test questions | 0-1185 | |
| Tys_Review_Incorrect | Number of review explanations for wrong questions | 0-1991 | |
| Tys_Review_Solution | Number of review solution videos | 0-424 | |
| Wall_Load | Times the student open the discuss forum | 0-834 |
2.3 Model training and Evaluation
We selected six models to predict students’ performance change and evaluate their fairness, including Logistic Regression (LR), Support Vector Machines (SVM), Decision Tree (DT), Random Forest (RF), K-Nearest Neighbors (KNN), and Neural Network (NN). Before training, categorical variables were encoded using one-hot encoding, while numerical variables were standardized to facilitate convergence in models sensitive to feature scaling, such as LR and SVM. Each model was trained using a 10-fold cross-validation approach to ensure that the training and validation sets were representative of the overall dataset.
The prediction performance of each model was assessed using metrics appropriate for imbalanced datasets, as academic performance often displays class imbalance [19, 36]. The evaluation metrics included accuracy, F1-score, precision, recall, and AUC-ROC. The AUC-ROC is particularly effective in evaluating the classification effectiveness in unbalanced datasets [23].
2.4 Fairness Evaluation Metrics
Equity in education means that all schools and education systems provide equal learning opportunities to all students [18]. In this study, we conceptualize fairness as treatment equality (TE), which emphasizes equitable error rates [7]. TE is assessed by examining the ratio of False Negative Predictions (FNR) to False Positive Predictions (FPR), defined as follows:
\begin {equation} \frac {P_{g_i}\left ( \hat {y}=1|y=0 \right ) }{P_{g_i}\left ( \hat {y}=0|y=1 \right )}=\frac {P_{g_j}\left ( \hat {y}=1|y=0 \right )}{P_{g_j}\left ( \hat {y}=0|y=1 \right )} \label {eq:TE} \end {equation}
where \(y\) is the actual value and \(\hat {y}\) is the predicted value. \(g_i\) and \(g_j\) are identifier for groups based on sensative feature. \(P\) is the predicted score of an obsevation.
This metric ensures uniformity in the impact of mispredictions, which is crucial for ensuring that educational interventions are fair, allowing all students equitable access to support regardless of their demographic backgrounds. However, the original definition in equation 1 only considers a single sensitive feature. Consequently, we defined an adjusted TE to measure the model’s fairness across multiple groups involving more than one sensitive feature. Initially, we calculated the TE for two groups:
\begin {equation} TE_{g_i,g_j} = \frac {P_{g_i}\left ( \hat {y}=1|y=0 \right ) * P_{g_j}\left ( \hat {y}=1|y=0 \right )}{P_{g_i}\left ( \hat {y}=0|y=1 \right ) * P_{g_j}\left ( \hat {y}=0|y=1 \right )} \label {eq:OneFeatureTE} \end {equation}
In this case, we aim for the value of \(TE_{g_i,g_j}\) to be as close to 1 as possible, indicating that treatment equality has been similarly achieved across these two groups. To extend this approach and measure the overall fairness of a model across multiple sensitive features, we calculate the average of all \(TE_{g_i,g_j}\) values for each pair of sensitive features. If we have \(n\) sensitive features, the overall fairness metric of the model can be defined as:
\begin {equation} TE_m = \frac {1}{n} \sum _{k=1}^{n} TE_{g_{ik},g_{jk}} \label {eq:modelTE} \end {equation}
Where \(TE_{g_{ik},g_{jk}}\) is the TE measurement between two subgroups \(g_{ik}\) and \(g_{jk}\) within the \(k^{th}\) sensitive feature,\(n\) is the total number of sensitive features.
We also assessed the models for potential biases using the Subgroup-AUC [9]. A high Subgroup-AUC value indicates that the model predicts well within this group.
2.5 Fairness Constrain
To ensure our model integrates fairness considerations, we propose a treatment equality constraint for the training procedure. For binary classification problems, we define the loss function with an added fairness loss component as:
\begin {equation} L = L_{pred} + \lambda * L_{fair} \label {eq:loss} \end {equation}
\begin {equation} L_{pred} = -\frac {1}{N} \sum _{i=1}^{N}[y_i\log ({\hat {y} })+(1-y_{i})\log ({1-\hat {y}_i })] \label {eq:abroca} \end {equation}
\begin {equation} L_{fair} = {\textstyle \sum _{\forall (g_i,g_j)}|TE_{(g_i,g_j)}-1|} \end {equation}
Where \(L_{pred}\) represents the predictive loss of the model, which could be any suitable loss function based on the type of ML model used (e.g., cross-entropy loss for classification tasks). \(L_{fair}\) is the fairness loss, designed to assess and penalize any unfairness in the model’s predictions across different demographic groups. \(\lambda \) is a regularization parameter that controls the trade-off between predictive performance and fairness. Higher values of \(\lambda \) will instruct the model to prioritize fairness loss during the training process. In this study, we incorporate the TE constraint into a LR model5 using the Adam optimizer. Note that the fairness constraint can also be incorporated into other ML models.
3. RESULTS
3.1 Descriptive Analysis
Table 2 displays the risk distribution across different demographic groups, revealing evident disparities in the total number of individuals at academic risk.
| Demographic Attribute | Group 0 Risk 0 | Group 0 Risk 1 | Group 1 Risk 0 | Group 1 Risk 1 |
|---|---|---|---|---|
| Gender | 934 | 1678 | 806 | 1415 |
| FRL_Status | 550 | 1354 | 1190 | 1739 |
| Race_Indicator | 411 | 898 | 1329 | 2195 |
| His_Indicator | 1171 | 2023 | 569 | 1070 |
3.2 Performance Prediction
Table 3 displays the results from six ML models built on various sets of prediction data. It shows that all data categories contribute to improving the models’ accuracy. The F1 score for LR is 0.7598 when only student learning behavior data (L) is used to predict academic risk, suggesting that online learning behavior is a significant predictor of future changes in students’ summative academic performance. Additionally, incorporating historical performance variables (H + L) further enhances the prediction of risk for summative achievement. Using all three data categories (D + H + L) increases LR’s prediction accuracy by 6.34% compared to models that exclude demographic data (H + L).
| Category | Model | Acc | F1 | Precision | Recall |
|---|---|---|---|---|---|
| L | LR | 0.6487 | 0.7598 | 0.6755 | 0.8680 |
| SVM | 0.6447 | 0.7635 | 0.6651 | 0.8959 | |
| KNN | 0.6166 | 0.7097 | 0.6884 | 0.7323 | |
| DT | 0.5253 | 0.6164 | 0.6384 | 0.5959 | |
| RF | 0.6027 | 0.7102 | 0.6660 | 0.7608 | |
| NN | 0.6276 | 0.7114 | 0.7056 | 0.7174 | |
| H + L | LR | 0.6743 | 0.7730 | 0.6976 | 0.8668 |
| SVM | 0.6720 | 0.777 | 0.6878 | 0.8927 | |
| KNN | 0.6679 | 0.751 | 0.722 | 0.7824 | |
| DT | 0.5994 | 0.6772 | 0.6991 | 0.6566 | |
| RF | 0.6667 | 0.7565 | 0.7104 | 0.8089 | |
| NN | 0.6896 | 0.7583 | 0.7559 | 0.7608 | |
| D + H + L | LR | 0.7377 | 0.8046 | 0.7692 | 0.8429 |
| SVM | 0.7261 | 0.8041 | 0.7413 | 0.8784 | |
| KNN | 0.6679 | 0.7510 | 0.7219 | 0.7824 | |
| DT | 0.6091 | 0.6748 | 0.7068 | 0.6651 | |
| RF | 0.6706 | 0.7600 | 0.7112 | 0.8099 | |
| NN | 0.6983 | 0.7663 | 0.7584 | 0.7468 |
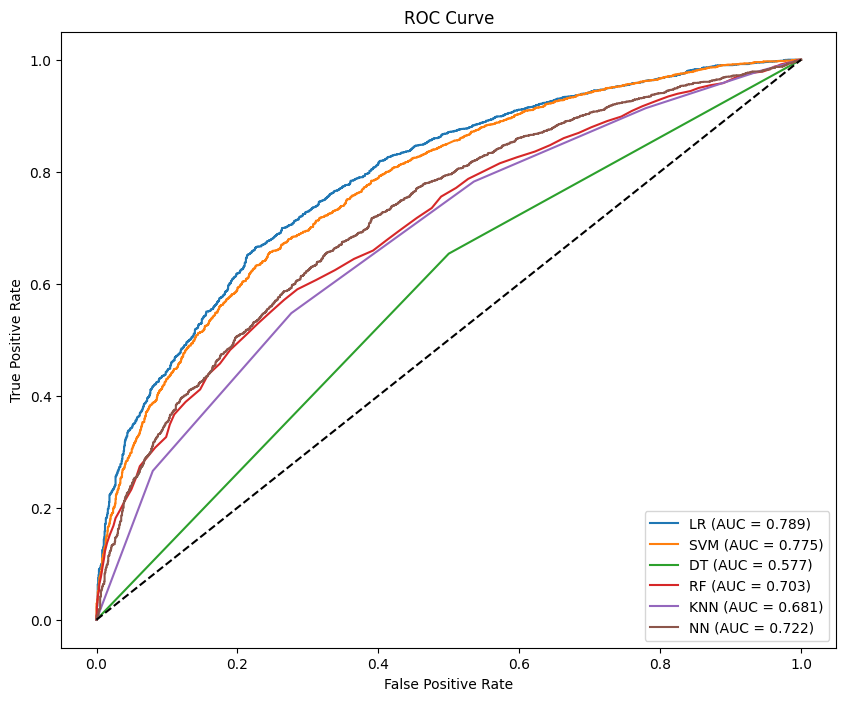
The ROC curves for various models, which incorporate data from all three categories, are illustrated in Figure 1. The results indicate that LR and SVM models achieve the highest performance, with ROC-AUC values of 0.789 and 0.775.
3.3 Fairness Evaluation
We evaluated model fairness using the TE defined in equation 2 and Subgroup-AUC. As indicated in Table 4, discrepancies in TE performance across various models, observed in individual sensitive attribute columns, may be attributed to factors such as imbalanced data distribution, differing learning capabilities, and model complexity. Although LR achieves higher predictive performance than other models (as shown in Table 3), it fails to ensure treatment equality between different groups. This failure may stem from LR’s relatively simple architecture, which, while achieving better generalization across the dataset, leads to higher predictive accuracy but does not necessarily address fairness across groups. In contrast, more complex models like NN can capture intricate patterns in the data, potentially resulting in better fairness for certain sensitive attributes. According to the \(TE_m\), NN has the highest score of 0.9511, indicating the most balanced TE across all considered sensitive attributes.
| Model | Gender | FRL_Status | Race_Indicator | His_Indicator | TE_m
|
|---|---|---|---|---|---|
| LR | 0.9469 | 0.5114 | 0.5001 | 0.6469 | 0.6513 |
| SVM | 0.9029 | 0.6522 | 0.7817 | 0.7500 | 0.7717 |
| KNN | 0.9780 | 0.6534 | 0.7940 | 0.9549 | 0.8451 |
| DT | 0.8711 | 0.9541 | 0.8022 | 0.9522 | 0.8949 |
| RF | 0.8809 | 0.6425 | 0.8095 | 0.9578 | 0.8227 |
| NN | 0.9960 | 0.8962 | 0.9227 | 0.9895 | 0.9511 |
Table 5 displays the Subgroup-AUC values of the LR model across various demographic groups. It is observed that the disparity in the model’s Subgroup-AUC across different groups can reach a maximum of 28% (as indicated by the bold texts). This significant variation indicates the necessity of addressing the model’s bias in predictions.
| Gender | FRL_Status | Race_Indicator | His_Indicator | AUC |
|---|---|---|---|---|
| 0 | 0 | 0 | 0 | 0.83 |
| 0 | 0 | 1 | 0 | 0.88 |
| 0 | 0 | 1 | 1 | 0.80 |
| 1 | 0 | 0 | 0 | 0.85 |
| 1 | 0 | 1 | 0 | 0.83 |
| 1 | 0 | 1 | 1 | 0.91 |
| 0 | 1 | 0 | 0 | 0.63 |
| 0 | 1 | 1 | 0 | 0.71 |
| 0 | 1 | 1 | 1 | 0.81 |
| 1 | 1 | 0 | 0 | 0.71 |
| 1 | 1 | 1 | 0 | 0.77 |
| 1 | 1 | 1 | 1 | 0.78 |
After implementing fairness training on the LR model using the TE constraint, the resulting TE values across different demographic attributes are presented in Table 6. We selected the LR model for this fairness constraint method due to its superior predictive performance, as shown in Table 3. The results demonstrate that the fairness constraint significantly enhances the fairness outcomes for the LR model across three sensitive attributes: FRL_Status, Race_Indicator, and His_Indicator. Varying values of \(\lambda \) provide more equitable solutions for different sensitive features, likely because the fairness loss concentrates on the overall TE metrics of the model across the four groups. Introducing a fairness loss improved the overall TE fairness of the LR model to a \(TE_m\) value of 0.6925 when \(\lambda \) is set at 0.1, an improvement of 4% compared to the original model. Additionally, after integrating the fairness constraint (\(\lambda = 0.1\)), the model’s AUC value remains at 0.758, indicating that the model with the fairness constraint also maintains its predictive performance.
| Gender | FRL_Status | Race_Indicator | His_Indicator | TE_m | |
|---|---|---|---|---|---|
| LR | 0.9469 | 0.5114 | 0.5001 | 0.6469 | 0.6513 |
| LR\(_{\lambda =0.1}\) | 0.5001 | 0.6152 | 0.6914 | 0.9632 | 0.6925 |
| LR\(_{\lambda =0.05}\) | 0.6961 | 0.6246 | 0.6148 | 0.7112 | 0.6617 |
| LR\(_{\lambda =0.01}\) | 0.6690 | 0.5941 | 0.8647 | 0.6886 | 0.7041 |
| LR\(_{\lambda =0.001}\) | 0.6678 | 0.3330 | 0.7778 | 0.6673 | 0.6115 |
4. DISCUSSION
Previous studies have shown that predictive analytics based on AI and ML algorithms are beneficial for online teaching and learning. For example, existing research on predicting academic performance in online learning environments primarily focuses on feature or model selection to enhance the predictive performance (e.g., accuracy and F1 score) of ML models [28, 25, 4]. However, these studies often overlook critical aspects of AI fairness and bias, leading to disparities in educational outcomes across different demographics [29, 34]. For instance, an algorithm might perform more effectively with certain types of data, or the structure of certain decision trees or neural networks may inherently favor specific outputs [20, 27]. Such bias can profoundly impact the fairness of online learning, leading to misaligned educational interventions, reduced confidence among affected student groups, and perpetuation of educational inequalities [37, 17]. This work aims to bridge this gap by developing a model that is both fair and accurate. As equity in education implies that all schools and education systems provide equal learning opportunities to all students [18], we conceptualize fairness as treatment equality, emphasizing equitable error rates for different groups [7]. The original TE measure based on Equation 2 only assesses two groups under one sensitive metric. We have optimized the original measure and proposed a method that assesses the model’s treatment equality (TE) across multiple sensitive attributes. This approach aligns more closely with the realities of educational needs. Results in Table 4 show that this optimized method for assessing TE can serve as a supplementary measure of fairness and may also be applied to other metrics, such as equalizing disincentives [16] and conditional equal opportunity [5].
Unlike previous studies that focused on evaluating fairness issues [30, 11], this work not only provides a method to better measure TE fairness but also incorporates it into real model training to ensure both the accuracy and fairness of models. While limited research has explored ways to mitigate unfairness issues in predictions [19, 36], these studies have shown that different methods yield varying effectiveness in promoting fairness across different models. [19] reported optimal results with LR, and [36] reported optimal results with KNN. We selected the best-performing predictive model, LR (shown in Table 3), and combined it with our TE loss function method. Unlike previous approaches that used data segmentation to enhance model fairness, our method, consistent with similar research outcomes, slightly reduces model accuracy while improving fairness. Overall, we were able to maintain a balance between accuracy and fairness. This finding extends and contributes to existing work on evaluating AI models’ fairness [26, 14, 35] to mitigate bias and enhance fairness in the predictive modeling process across different demographic groups. Furthermore, the proposed method can be generalized to other data concerning students’ backgrounds and individual differences. To this end, our study suggests that equity assessments be included in all model predictions, especially in areas such as education where the realization of equity is critical.
Future research will focus on three main aspects. First, we will deepen the integration of fairness constraints into various ML models to improve educational outcomes’ fairness. Additionally, we will apply and validate our approaches on diverse online learning datasets to broaden the applicability and robustness of our findings. Furthermore, we will combine our current in-processing methods with other fairness mitigation methods like pre-processing techniques.
5. REFERENCES
- H. A. Alhakbani and F. M. Alnassar. Open learning analytics: a systematic review of benchmark studies using open university learning analytics dataset (oulad). In Proceedings of the 2022 7th International Conference on Machine Learning Technologies, pages 81–86, 2022.
- R. S. Baker and A. Hawn. Algorithmic bias in education. International Journal of Artificial Intelligence in Education, 32:1052–1092, 2022.
- B. K. Baradwaj and S. Pal. Mining educational data to analyze students’ performance. arXiv preprint arXiv:1201.3417, 2012.
- S. Batool, J. Rashid, M. W. Nisar, et al. Educational data mining to predict students’ academic performance: A survey study. Educational Information Technology, 28:905–971, 2023.
- A. Beutel, J. Chen, T. Doshi, H. Qian, A. Woodruff, C. Luu, P. Kreitmann, J. Bischof, and E. H. Chi. Putting fairness principles into practice: Challenges, metrics, and improvements. In Proceedings of the 2019 AAAI/ACM Conference on AI, Ethics, and Society, pages 453–459, 2019.
- C. Brooks, C. Thompson, and S. Teasley. A time series interaction analysis method for building predictive models of learners using log data. In Proceedings of the Fifth International Conference on Learning Analytics And Knowledge, LAK ’15, page 126–135, New York, NY, USA, 2015. Association for Computing Machinery.
- S. Caton and C. Haas. Fairness in machine learning: A survey. ACM Computing Surveys, 2020.
- A. D. Dumford and A. L. Miller. Online learning in higher education: exploring advantages and disadvantages for engagement. Journal of computing in higher education, 30:452–465, 2018.
- F. Faal, K. Schmitt, and J. Y. Yu. Reward modeling for mitigating toxicity in transformer-based language models. Applied Intelligence, 53(7):8421–8435, jul 2022.
- M. Fei and D.-Y. Yeung. Temporal models for predicting student dropout in massive open online courses. In 2015 IEEE international conference on data mining workshop (ICDMW), pages 256–263. IEEE, 2015.
- J. Gardner, C. Brooks, and R. Baker. Evaluating the fairness of predictive student models through slicing analysis. In Proceedings of the 9th International Conference on Learning Analytics & Knowledge, pages 225–234, 2019.
- A. Hamoud, A. S. Hashim, and W. A. Awadh. Predicting student performance in higher education institutions using decision tree analysis. International Journal of Interactive Multimedia and Artificial Intelligence, 5:26–31, 2018.
- B. Hutchinson and M. Mitchell. 50 years of test (un) fairness: Lessons for machine learning. In Proceedings of the conference on fairness, accountability, and transparency, pages 49–58, 2019.
- S. Hutt, M. Gardner, A. L. Duckworth, and S. K. D’Mello. Evaluating fairness and generalizability in models predicting on-time graduation from college applications. International Educational Data Mining Society, 2019.
- G. James, D. Witten, T. Hastie, R. Tibshirani, et al. An introduction to statistical learning, volume 112. Springer, 2013.
- C. Jung, S. Kannan, C. Lee, M. Pai, A. Roth, and R. Vohra. Fair prediction with endogenous behavior. In Proceedings of the 21st ACM Conference on Economics and Computation, pages 677–678, 2020.
- R. F. Kizilcec and H. Lee. Algorithmic fairness in education. In W. Holmes and K. Porayska-Pomsta, editors, The ethics of artificial intelligence in education, pages 174–202. Routledge, New York, 2022.
- M. Levinson, T. Geron, and H. Brighouse. Conceptions of educational equity. AERA Open, 8:1–12, 2022.
- C. Li, W. Xing, and W. Leite. Yet another predictive model? fair predictions of students’ learning outcomes in an online math learning platform. In LAK21: 11th International Learning Analytics and Knowledge Conference, LAK21, page 572–578, New York, NY, USA, 2021. Association for Computing Machinery.
- N. Mehrabi, F. Morstatter, N. Saxena, K. Lerman, and A. Galstyan. A survey on bias and fairness in machine learning. ACM computing surveys (CSUR), 54(6):1–35, 2021.
- P. M. Moreno-Marcos, P. J. Muñoz-Merino, J. Maldonado-Mahauad, M. Pérez-Sanagustín, C. Alario-Hoyos, and C. Delgado Kloos. Temporal analysis for dropout prediction using self-regulated learning strategies in self-paced moocs. Computers & Education, 145:103728, 2020.
- A. Namoun and A. Alshanqiti. Predicting student performance using data mining and learning analytics techniques: A systematic literature review. Applied Sciences, 11(1):237, 2020.
- S. Narkhede. Understanding auc-roc curve. Towards data science, 26(1):220–227, 2018.
- C.-Y. J. Peng, M. Harwell, S.-M. Liou, L. H. Ehman, et al. Advances in missing data methods and implications for educational research. Real data analysis, 3178:102, 2006.
- A. Rabelo, M. W. Rodrigues, C. Nobre, S. Isotani, and L. Zárate. Educational data mining and learning analytics: A review of educational management in e-learning. Information Discovery and Delivery, 52(2):149–163, 2024.
- S. Riazy, K. Simbeck, and V. Schreck. Fairness in learning analytics: Student at-risk prediction in virtual learning environments. In S. Z. H. Chad Lane and J. Uhomoibhi, editors, Proceedings of the 12th International Conference on Computer Supported Education, volume 1, pages 15–25. SCITEPRESS, 2020.
- S. Ruggieri, D. Pedreschi, and F. Turini. Data mining for discrimination discovery. ACM Trans. Knowl. Discov. Data, 4:1–40, may 2010.
- N. Tomasevic, N. Gvozdenovic, and S. Vranes. An overview and comparison of supervised data mining techniques for student exam performance prediction. Computers & education, 143:103676, 2020.
- Y.-S. Tsai, C. Perrotta, and D. Gašević. Empowering learners with personalised learning approaches? agency, equity and transparency in the context of learning analytics. Assessment & Evaluation in Higher Education, 45(4):554–567, 2020.
- M. Verger, S. Lallé, F. Bouchet, and V. Luengo. Is your model" madd"? a novel metric to evaluate algorithmic fairness for predictive student models. arXiv preprint arXiv:2305.15342, 2023.
- W. Xing, X. Chen, J. Stein, and M. Marcinkowski. Temporal predication of dropouts in moocs: Reaching the low hanging fruit through stacking generalization. Computers in Human Behavior, 58:119–129, 2016.
- W. Xing and D. Du. Dropout prediction in moocs: Using deep learning for personalized intervention. Journal of Educational Computing Research, 57(3):547–570, 2019.
- W. Xing, R. Guo, E. Petakovic, and S. Goggins. Participation-based student final performance prediction model through interpretable genetic programming: Integrating learning analytics, educational data mining and theory. Computers in human behavior, 47:168–181, 2015.
- R. Yu, Q. Li, C. Fischer, S. Doroudi, and D. Xu. Towards accurate and fair prediction of college success: Evaluating different sources of student data. In A. Rafferty, J. Whitehill, V. Cavalli-Sforza, and C. Romero, editors, Proceedings of the 13th International Conference on Educational Data Mining (EDM 2020), pages 292–301. International Data Mining Society, 2020.
- R. Yu, Q. Li, C. Fischer, S. Doroudi, and D. Xu. Towards accurate and fair prediction of college success: Evaluating different sources of student data. International educational data mining society, 2020.
- F. Zhang, W. Xing, and C. Li. Predicting students’ algebra i performance using reinforcement learning with multi-group fairness. In LAK23: 13th International Learning Analytics and Knowledge Conference, pages 657–662, 2023.
- O. Zlatkin-Troitschanskaia, J. Schlax, J. Jitomirski, R. Happ, C. Kühling-Thees, S. Brückner, and H. A. Pant. Ethics and fairness in assessing learning outcomes in higher education. Higher Education Policy, 32:537–556, 2019.
1https://www.mathnation.com/
2Data can be requested at: https://uf-aice-lab.github.io/AICE/datasets.html
3The FSA are statewide tests that assess student achievement in reading, writing, math, and science based on Florida Standards.
4If a student’s EOC grade level is less than or equal to their FSA Math score level, the value of “risk" is 1; otherwise, it is 0.
5An example can be found at https://github.com/ZifengLiu98/logistic-regression-with-treatment-equality-constrain.git