ABSTRACT
Research into student affect detection has historically relied on ground truth measures of emotion that utilize one of three sources of data: (1) self-report data, (2) classroom observations, or (3) sensor data that is retrospectively labeled. Although a few studies have compared sensor- and observation-based approaches to student affective modeling, less work has explored the relationship between self-report and classroom observations. In this study, we use both recurring self-reports (SR) and classroom observation (BROMP) to measure student emotion during a study involving middle school students interacting with a game-based learning environment for microbiology education. We use supervised machine learning to develop two sets of affect detectors corresponding to SR and BROMP-based measures of student emotion, respectively. We compare the two sets of detectors in terms of their most relevant features, as well as correlations of their output with measures of student learning and interest. Results show that highly predictive features in the SR detectors are different from those selected for BROMP-based detectors. The associations with interest and motivation measures show that while SR detectors captured underlying motivations, the BROMP detectors seemed to capture more in-the-moment information about the student’s experience. Evidence suggests that there is benefit of using both sources of data to model different components of student affect.
Keywords
INTRODUCTION
Research on student affect detection is beginning to mature and includes a range of affective constructs that are relevant in academic contexts. A fundamental step in building affect detectors is selecting the “ground truth” measure of emotion that will be used to provide class labels for training the models [15]. The quality of an affect detector depends in part on the robustness and reliability of its training data in capturing the defined construct. The importance of labeling ground truth in affect detection has been recognized widely, with discussions on advantages and pitfalls of different methods [62]. Differences arising from these methods of obtaining ground truth may influence our understanding of these phenomena, making it essential to examine and compare these techniques with each other.
Emotion research has a long history that dates as far back as Darwin [20], and for many years it was heavily influenced by Ekman’s theory of basic emotions: happiness, surprise, fear, disgust, anger, and sadness [17]. Although the EDM community rarely engages with that particular set of emotions, EDM researchers frequently utilize approaches that share some of the same implicit assumptions as Ekman. For example, sensor-based affective research often uses Ekman & Friesen’s [28] Facial Action Coding System (FACS). Self-report and classroom observation measures are often designed as if students experience one (and only one) emotion at a time and as if these were binary experiences (e.g., confused or not). Only a few self-report studies have employed Likert scales to examine the strength of reported emotions [47], and it is relatively rare to find methods that capture multiple student emotions occurring simultaneously, such as a student being focused yet bored, or confused yet happy [10, 18, 46].
Certainly, some simplification is necessary to produce replicable analyses. The human face—often the primary vehicle for affective expression—is a dynamic source of complex information [40]. Moreover, there is evidence that emotion labels are constructed linguistically, making the emotion categories used in much of the affective modeling literature susceptible to subtle cultural differences [29, 41, 55, 56]. Yet, the shortcomings of current methods for obtaining ground truth measurements of student emotions are often overlooked in research on student affect detection.
One measurement approach that has been widely used in the field is the Baker Rodrigo Ocumpaugh Monitoring Protocol (BROMP; [55]). BROMP was initially developed for training interaction-based affect detectors (e.g., [4, 8]), but it has also been used to train detectors using sensor data [11]. BROMP has been successfully adapted to other cultures, in a process where one of its developers consults with two observers to develop a new coding scheme that is culturally appropriate, and then interrater reliability is achieved between the two observers rather than with someone who was certified in a US context [55].
This study seeks to build upon the research using BROMP to investigate Graesser et al.’s [35] questions about the relationship between how a student might describe their own affective experience and the observable differences that manifest when the student is being observed. It is possible, for example, that a student might not be intrinsically interested in material, but still be willing to engage with the material, resulting in an outside observer coding “engaged concentration” while the student internally feels “bored.” Likewise, a student might be unaware of how frustrated they have become while still manifesting a robust affective display (e.g., facial expression, body movement) that is easily observable to an outsider. This is to say that differences between self-reports and field observation measurements may not imply that one or the other is erroneous. There is research documenting that people do not always differentiate between two different emotions in the same way [30], and there is evidence that physical signals of emotion mean different things in different contexts [29]. As such, disagreement between self-report and field observations could mean that these methods are picking up on different parts of a signal.
In this paper, we investigate this issue within the context of Crystal Island [67], a game-based learning environment for middle school science education. Specifically, we compare affect detectors trained on typical BROMP-based observations of student emotion to those trained on data from a novel 2-stage affect self-reporting tool that was integrated within the game. The BROMP-based training and testing data was resampled to mitigate the impact of the difference in sample size and rate when comparing both types of detectors. We then examine the degree to which the input feature space overlaps for these different detectors, and the degree to which their output relates to measures of student interest and learning.
Related Work
Detection of students’ affective experiences is a crucial first step in designing affect-sensitive learning technologies, as these require a deeper understanding of the occurrence of affect, and its impact on learning [10, 25, 63], engagement, motivation [65], and self-efficacy [52]. As a latent state, affect can be very challenging to measure. Researchers have devoted considerable energy into developing stealth measurements of affect that can run in the background. To date, these have typically relied on supervised machine learning [4, 38, 70, 78], which requires a “ground truth” measurement. As automated measures are not yet reliable enough for this (indeed, this is the issue these detectors are trying to solve), we have to rely on human measurements. Human measures of affect can be made either by the subject (self-report) or by a third party (observer), and each approach comes with its own caveats.
The variations in ground truth measurements stem from differ-fences in how affective states are present internally and externally [15]. This variation has the potential to impact what subsequent machine-learned models are measuring. Work in EDM has typically focused on the effects and meaning of students’ affective states (e.g., [25, 59]), or the data with which a detector was trained (e.g., sensor vs sensor free) with less attention being paid to the theoretical implications implicit in the measurement techniques being used (see [66]). For example, assumptions about the consistency/universality, measurability, rate of occurrence, and salience of affective experiences are implicit in many machine-learned models, but these assumptions often go unstated and unexplored. The literature on these issues exists, but it often occurs outside of the EDM community (e.g., [19, 29]).
The complexities of measuring affect are further influenced by frameworks used to describe affective states. For example, Izard’s [39] work on discrete, basic emotions has been highly influential (i.e., interest, joy/happiness, sadness, anger, disgust, and fear [28]), but the community has given considerable focus to academic or achievement emotions ([25, 60, 61]). This distinction is important, as Izard ([39], p. 262) argues that “a basic emotion does not depend on or include complex appraisals or higher order cognition such as thought and judgment.” In Izard’s theoretical framework, complex emotions are actually “emotion schemas” and are less fleeting than basic emotions.
EDM research that takes a non-categorical approach to studying students’ affective states tends to be heavily influenced by Russel’s paradigm, which attempts to measure on the dimensions of valence and arousal [68]. This model adds dimensionality to emotion labels, though not as many dimensions as are found outside of the EDM community (see discussion in [75]). For example, Gunes & Pantic [36] employ five dimensions: arousal, expectation, intensity, power, and valence.
Interrogating the assumptions that underlie our measurement techniques might help the EDM community to better understand our data. For example, we know that academic emotions require appraisal, and that students differ in their metacognitive skills in this area [60]. This might mean that their appraisals should not be the only labeling system we employ for obtaining ground truth. However, it could also explain differences between observer-generated and self-reported data, since a trained observer might better understand the emotional processes a student has undergone, particularly for younger or less-educated learners. For example, a student who does not expect to overcome an obstacle in a particular domain might immediately shift from engaged concentration to frustration (bypassing confusion) when met with a task that they do not fully understand. We should also be sensitive to the fact that an observer often does not have access to the same channels of information available to the learner, particularly when it comes to factors like expectation and the experience of powerlessness (e.g., [36]). Therefore, having data from both types of measurements could provide us with a more complete picture of students’ affective experiences.
Observer-Based Measurement
Observation measurements rely on a third party who observes a student and labels their affective state, usually based on some predefined coding scheme and prior training. Such an approach relies upon an external presentation of affect and is unlikely to be influenced by biases of the student (e.g., social concerns). That said, observation measurements may be susceptible to self-presentation effects [72], in which students filter their external presentation and displays of emotion (typically as they get older). There also may be cultural differences in how emotion is displayed and interpreted that can influence the validity of observer-based measurements.
Observer-based measurements also have to contend with the fact that there are two humans in the loop—the student and the observer—meaning there are two points where bias can confound the measurement. Observer biases may come from varying cultural norms, but in most cases, it is possible to subvert these through training and protocols (e.g., interrater reliability).
In the EDM community, one of the most common observation measurements for affect research is BROMP [55]. BROMP is a momentary time sampling method in which students are coded individually in a predetermined order using an app that facilitates the coding scheme and automatically includes metadata like time stamps [54]. Specifically, trained, certified observers code the first affective state they observe, but may take up to 20 seconds to contextualize that observation, resulting in codes made every 3–20 seconds under typical classroom conditions.
Although the manual that formalized BROMP is now nearly a decade old [55], the methods were used in a large number of publications leading up to its publication [4, 6, 50, 53, 64, 65, 71]. Coding schemes have now been developed for 7 countries, and typically include boredom, confusion, engaged concentration, delight, and frustration [55]. The observation method is holistic, facilitating greater use of contextual classroom cues than can typically be gathered in sensor-based detection [8], and it has now been used to construct affect detectors in over 20 learning systems, including several for educational games [5, 6, 42, 65].
Observation methods have been used successfully to train several affect detectors, as well as subsequent validation studies of said detectors. Similarly, detectors trained on observation ground truth data have been used to create successful interventions and adaptive technologies that respond to student affect [22, 24].
Self Report-based Measurement
The self-reporting of educationally-relevant affective states has a long history that skews toward trait-level measurements, which have the benefit of allowing for students to be asked about their experiences using scales, as opposed to a single measure (see review in [59]). Verbal protocols, such as think-alouds [23] have also been used, and are notably able to provide a continuous stream of data, which can then be coded for further analysis. These have sometimes been done retrospectively, so as not to interrupt the learning process (e.g., [26]).
As computer-based learning systems become more advanced, experience sampling methods [34], during which students are either prompted to provide or volunteer emotions, are becoming more common. Examples of these in education include both the use of text-based reporting windows [18, 43, 74] and the use of emoticon-based reporting systems [69, 70]. These are often employed with forced choice (categorical answers), although researchers have also employed multiple Likert scales [3].
The argument of many who favor self-report methods is that only the individual can accurately communicate their internal state. Self-report allows us to collect data ‘direct from the source.’ Given the highly internal nature of affect, it is possible that self-report methods are necessary to access certain nuances of affective experiences. Likewise, it could potentially allow for students to express emotions in the report that they may be reluctant to display visually (e.g., on their face) in front of their peers—a concern that might be particularly important in older students (aged 12–18) or among students who experience social pressures.
That said, participants may be unwilling or unable to admit their feelings when they want to be perceived differently. For example, researchers have documented self-presentation effects even in anonymous survey work, where respondents reply in ways that present themselves more positively regardless of their actual behaviors [37]. Other researchers have documented satisficing practices, which involve disengagement from the task to give minimally correct answers [45]. Still others have noted that some respondents actively obscure their data [44] or lack the meta-cognition to accurately diagnose their current affective state and accurately communicate it [32]. Finally, we have seen some evidence that asking students to report their affect changes their subsequent affect [78], which has other consequences for interpreting data.
Despite this, affect detectors have been successfully built on learner self-report data [3, 13, 31, 32, 38, 78]. Self-report has also facilitated data collection in online environments where observation is not possible, and at larger scales than observation-based measurements [31], due to not requiring the presence of trained professionals. This has meant that affect detectors can be trained on a larger volume of data and can be used to implement adaptability at scale with lower concerns regarding observer’s biases.
Comparison across Techniques
Affective research has long realized that there are several trade-offs when it comes to choosing a ground truth labeling system. Researchers must balance considerations related to the validity and reliability of the signal in real-world environments with factors related to sampling rates, the signals’ timing, and intrusiveness [15].
All methods of affect detection suffer from questions related to sampling rates [57] and the associated data loss. Classroom observation techniques invariably result in times when one student is not being closely observed, despite BROMP-based efforts to at least ensure that one student is not being oversampled [55]. Experience sampling methods must balance the need for high rates of training data with the disruption these questions might cause to the student [17]. In fact, some research has suggested that self-reporting alters the physiological response [44], which raises generalization concerns in addition to those related to sampling.
Even sensor data can have sampling problems at key learning moments. Although sensors offer a more continuous data stream, data may be lost if students turn their heads or leave their seats to work with a peer (as in video or voice-related data). Moreover, decontextualized single streams of data may run counter to effective detection of affective states [48], particularly if we believe that students will experience non-educational emotions related to social interactions (as in skin conductance sensors).
Combining several types of sensors might improve some interpretations, but dealing with missing data in multimodal sensor systems is still challenging [51]. Regardless of any continuity benefits that sensor data might be able to provide, we must also be able to (a) get them into classrooms and (b) label their output. This latter problem, as discussed in Douglas-Cowie et al. [27], deserves greater attention than is currently found in the literature.
Classroom observations and self-report data may offer some advantages to sensor-based data in that their labels are often more holistic than can sometimes be generated from sensor data. For example, BROMP observers are trained to skip data from a student who is clearly upset because of a social interaction rather than from the experience in the software [55]. This approach is possible in most classroom-based data collection methods, but might be difficult to discern if a researcher is retrospectively labeling video data.
Others point out the trade-offs between self-reported data (e.g., experience sampling) and classroom observations. Self-reported data may prevent cultural biases from being imposed on student experiences, but it may also be susceptible to gaps in students’ metacognitive abilities [77] and to self-presentation effects [14]. Moreover, the benefits that come with students' own interpretation of their emotional experience (individualized interpretation) may also come with a cost from that same variability [76]. That is, students might use different labels to describe the same experience, whereas trained classroom observers work to ensure more consistency [55].
In some cases, self-report data represents additional challenges. Research has suggested that students are not always able to label their peer’s emotions [35], or even their own. Afzal and Robinson [1], for example, report that students were so uncomfortable with retrospective self-labeling of video data, that the researchers had to abandon the procedure altogether.
Novelty of the Current Study
Whereas previous research [62] has suggested that researchers should ensure that self-report and external observer data align in order to establish convergent validity, we take a different position. Specifically, we point to social constructivist research, which suggests that emotions are experienced as constellations of features that people learn to label as their experience with them grows [29]. This research paradigm would suggest that self-reporters have access to information that external observers do not have.
As such, we argue that the EDM community should more carefully consider the implications of theoretical underpinnings of our labeling processes. For example, students may process internal emotional signals in a way that is intrinsically entwined with their motivational levels or with their past experiences with the topic, and self-reporting may give us more direct access to that information. On the other hand, external observers who do not have access to that information can only label the affective displays being enacted in the moment. In some cases, they may be able to pick up more immediate, affective responses that the student has not yet reflected upon. In this way, observer-generated labels may provide us with a less-filtered set of labels about a students’ affective experience.
This study offers a unique opportunity to compare detectors trained on both types of data, since researchers rarely deploy both labeling methods in the same study. Specifically, we look at what kinds of features are selected by each suite of detectors, how detectors trained using self-reported data are correlated with those trained using BROMP observations, and which outcome measures these detectors are associated with. In this way, we are able to compare the performance of different ground truth measures, providing insights into the strengths and limitations of self-reported versus observed (BROMP) data in specific educational research contexts.
Methods
Context of Study
This study investigates student affective states within Crystal Island [67], an open-world, single-player science mystery game promoting inquiry-based learning in microbiology. Students are assigned the role of an investigative scientist with a mission to identify an illness that has spread across a research station. They must find the disease, the associated pathogen causing its outbreak, and the source of its transmission on a virtual remote island. In the learning environment, students can explore several virtual locations, while interacting with non-player characters (NPCs), reading educational materials and testing game objects for viruses and bacteria to make this determination. Students may carry objects with them for testing and keep track of their work with a concept matrix and an additional worksheet to help organize their hypotheses and results.
In this study, we examine the data from 124 middle school students who played Crystal Island in an urban school in the southeastern US. Data were well balanced for gender, and population statistics from the school show that 44% come from economically-disadvantaged backgrounds and more than 75% represent ethnic minority backgrounds (43% Black, 24% Latinx, 5% Asian, and 4% racial) The study took place during their regular science instruction (approximately 1 hour/day) over a 2-day period. All study procedures were approved by the respective IRBs of both partner institutions.
Data Collected
Survey Data Pre and Post Test
Identical pre and post-tests of domain knowledge (which scaled from 0 to 17) were used to calculate learning gains normalized characterized here as the maximum improvement or decline that the student would have in the post-test. Normalized learning gains were calculated using the equation below, proposed in previous work [73], where pre and post refer to the percentage of correct answers in the pre and post-tests, respectively:
Alongside these knowledge assessments, we also administered surveys for motivational constructs, including a self-efficacy scale [12], a situational interest [49], and subscales from the Intrinsic Motivation Inventory (IMI; [21]).
Trace Data
Traces of students’ interactions with Crystal Island were logged automatically as students played the game. Each row of the trace logs includes the action the student takes, the time stamp when the action occurs, the location in the game, and the duration of time the student spends on that action. There are other pertinent details about the action stored in the row; for example, when a student opens a book, the book title is logged. Additionally, students' interactions with the 2-stage emotion self-report survey are logged through this system because the self-report is embedded in the game. This allows us to understand what students are enacting in the game prior to the self-report.
Development of Affect Detectors
Two approaches were used to develop two different sets of affect detectors. These methods, described below, include both a novel self-report tool that was embedded into Crystal Island, as well as standard BROMP classroom observations [55], which are now well-established in the field. Typical BROMP affect categories were adapted to the self-report tool, as described in greater detail below.
BROMP
Standard BROMP-based observations [55] were collected by two coders, who applied labels independently over the duration of student gameplay. As part of the certification process, those being certified in BROMP must achieve a Kappa higher than 0.6 with their trainer. Both coders were certified prior to this study’s data collection. To maximize data collection, these coders did not observe the same student simultaneously (as advised in the BROMP manual [55]). In this study, a total of 1,716 individual affective observations were made using BROMP (Avg=14.07 per student, SD=8.02). These were made using a typical BROMP coding scheme of boredom, engaged concentration, con-fusion, delight, and frustration.
Self-report
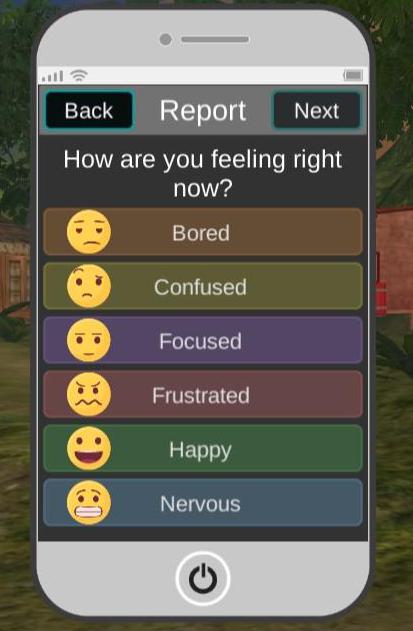
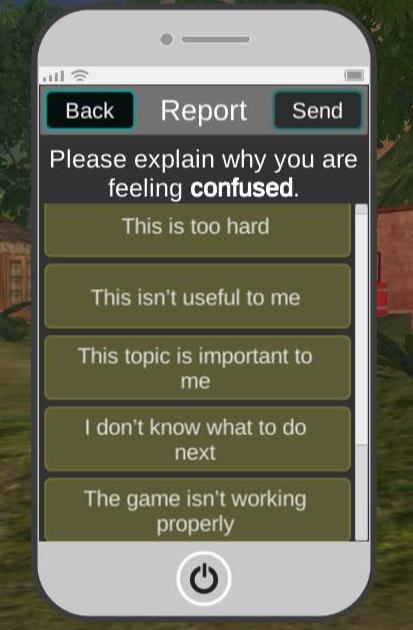
Self-reporting of affective states used categories similar to those in BROMP, but made nomenclature changes in order to be more age appropriate. These included focused (cf. engaged concentration) and happy (cf. delight), as well as bored, confused, and frustrated (which are all labeled the same in typical US-based BROMP observations). In addition to these standard affect labels, we also include the option of “nervous,” as recent EDM research has begun to explore categories related to anxiety [2], which are some-times more difficult to capture in direct classroom observations.
The self-reporting tool for this study was embedded within the storyline of the game (Figure 1). Students were told during the introduction to the mystery that an NPC in the game would text them periodically to ask them how they were feeling. They would then ask them for potential causes for those affective states. (The analysis of this second stage question is beyond the scope of the current analysis). Both questions (what are you feeling vs. why) were operationalized in a virtual cell phone with forced choice options. Students received requests to report their feelings when they hit certain milestones within the game, but they could also voluntarily self-report. A total of 547 self-reports were collected, 520 of which were triggered by in-game milestones, and 27 of which were voluntary. This resulted in a range of 1 to 9 self-reported affective states per student over the course of the study (avg=4.68, SD=1.56).
Feature Engineering
A total of 220 features were then engineered for developing the detectors. These included features from a 1-minute game time window, as well as features that occurred prior to the given time window, often operationalized as occurring within the last five actions. Ultimately, 98 features were derived for this study, falling into nine categories.
Feature Type | N | Example |
|---|---|---|
General | 11 | Duration. Duration of last action. |
Reading | 26 | RepeatedReadings. Number of articles that the student has read more than once. |
Conversations | 20 | ConversationTime. Cumulative duration of all the conversations with NPCs |
Hypotheses | 39 | HypothesisTimeLastMinute. Cumulative time that the student has been testing hypotheses during the last minute. |
Worksheet/ Concept Matrix | 22 | CorrectConceptMatrix. Average of correct responses in concept matrixes. |
Outside | 39 | MovementOutside. Number of times the student went outside any specific location. |
Bryce’s Quarters | 10 | BryceLast5. Cumulative time that the student has been in Bryce's Quarters within the last 5 actions. |
Location- specific | 45 | CurrentDining. Is the student in the dining hall? |
Video Game Preference | 8 | GamePreference. Does the student enjoy action, adventure, role playing, simulation, or sports-themed video games. |
Table 1 provides a breakdown of the number of features in each category and accompanying examples. General features represented features that were not specific actions taken in the game but described actions taken in the game, like Duration, or PlotPoints. Other features (i.e., CorrectConceptMatrix or WorksheetTimeRatio) were related to the students' use of in-game functions that help students to organize their ideas and track their progress. Others were related to the time students spent with reading material (i.e., PosterTime and RepeatedRead-ings), their conversations with NPCs more generally (ConversationTime), or their testing of Hypotheses (HypothesisTimeLastMinute). Location-related features included those that were specific to individual buildings in the virtual world (i.e., CurrentDining) or features that divided student actions to “inside” or “outside” behaviors (i.e., MovementOutsideTimeRatio or OutsideLast5). Finally, some features included information embedded from an in-game survey that students answered at the start of their gameplay, including students’ preferences for video game types (i.e., ActionGame, Adventure, Role-playing, Simulation, or Sports).
Sampling
As Table 2 shows, raw data from the two labeling techniques revealed major differences in the rates at which the various affective states were observed. Specifically, BROMP-based observations resulted in engaged concentration/focused rates of over 80%, with rates for boredom, confusion, and frustration much closer to 5%. These results mirror previous rates that have been observed with BROMP (e.g., [4, 6, 53]). In contrast, self-report-based (henceforth, SR-based) data for this label, was far less frequent and tied to much more specific points in the game (as per the study design). It showed only a 28.9% rate for engaged concentration/focus, and higher rates for boredom (31.7%). These results are also in line with previous rates that have been observed in self-reporting using experience sampling methods [69]. In order to ensure that the comparison was not confounded by the number of samples, base rate, and subsequent statistical power, the BROMP-based data was resampled for each detector to match the base rate with the SR-based data (prior to train/test split). In this case, resampling was conducted separately by specifically undersampling the majority class for each affective state. The resulting detectors of this process will be referred to as BROMPRS-based detectors. This allows for more of a “like to like” comparison where the differences in results can be more conclusively related to the data collection mechanism rather than being confounded by data distribution differences.
SR | BROMP | BROMPRS | ||||
|---|---|---|---|---|---|---|
N | % | N | % | N | % | |
Boredom | 147 | 31.7 | 81 | 4.7 | 81 | 32.0 |
Conc./Focus | 134 | 28.9 | 1411 | 82.2 | 125 | 29.1 |
Confusion | 62 | 13.4 | 113 | 6.6 | 113 | 13.0 |
Delight/Happ. | 78 | 16.8 | 23 | 1.3 | 23 | 17.0 |
Frustration | 35 | 7.6 | 88 | 5.1 | 88 | 8.0 |
Nervousness | 7 | 1.5 | NA | NA | NA | NA |
Detector Building Using Cross-Validation
For this work, we constructed two detectors: (1) BROMP-based and (2) Self-Report-based (SR-based). To ensure comparability, each were used to label 20 second clips and the same feature set was used as input for both detectors. However, the models were trained and tested independently.
We performed a nested 4-fold student-level cross-validation, with the inner fold used for feature selection. Features were selected through a forward feature selection process, using the Area Under the Receiver Operating Characteristic Curve (AUROC; AUC for short) and Kappa as the performance metrics. Because each set of detectors has multiple affective states, we trained these models as a one vs. rest classification for each detector. This is standard practice for affect detection in the EDM community [4, 8, 11]. To evaluate the performance of both detectors, we explored 4 machine learning algorithms from the SciKit Learn Library for Python [58]: Logistic Regression, Random Forests, Gradient Boosting, Support Vector Machines. We used default hyperparameters for all models.
Results
As Table 3 shows, 3 algorithms outperformed all the others. Logistic regression (LR) performed best for 9 detectors, including all 3 boredom detectors (SR-based, BROMP-based, and BROMPRS-based) all 3 delight/happiness detectors, 2 confusion detectors (SR-based and BROMPRS-based), and the BROMP-based concentration detector. Random Forests (RF) performed best for 5 detectors: the SR-based focus detector and its corresponding BROMPRS-based concentration detector, 2 of the frustration detectors (SR-based and BROMP-based), and the SR-based detector of nervousness. (As readers recall, BROMP does not code for nervousness, so BROMP-based nervousness detectors were not built.) Finally, Extreme Gradient Boosting (XGB) performed best for 2 detectors: BROMP-based confusion and BROMPRS-based frustration.
SR | BROMP | BROMPRS | ||||||||
|---|---|---|---|---|---|---|---|---|---|---|
| Algo | AUC | Algo | AUC | Algo | AUC | ||||
Bored | LR | 0.67 | 0.21 | LR | 0.8 | 0.2 | LR | 0.8 | 0.47 | |
Conc/Focus | RF | 0.67 | 0.21 | LR | 0.67 | 0.19 | RF | 0.6 | 0.19 | |
Confused | LR | 0.67 | 0.21 | XGB | 0.67 | 0.19 | LR | 0.66 | 0.21 | |
Del./Happ. | LR | 0.76 | 0.25 | LR | 0.75 | 0.11 | LR | 0.84 | 0.47 | |
Frustration | RF | 0.67 | 0.26 | RF | 0.7 | 0.12 | XGB | 0.78 | 0.27 | |
Nervousness | RF | 0.79 | 0.17 | NA | NA | NA | NA | NA | NA | |
Performances across the three types of detectors (SR-based, BROMP-based, and BROMPRS-based) were comparable. SR-based detectors ranged from AUC=.67–.79 and Kappa=.21–.26. BROMP-based detectors ranged from AUC=.67–80 and Kappa =.11–.20 before resampling. BROMPRS-based detectors performed similarly to the original BROMP-based detectors for AUC (.60–.84) and performed slightly better for Kappa (.19–.47).
These results show that BROMPRS-based detectors performed slightly better than SR-based detectors, particularly for boredom (AUC=0.8, Kappa=0.47 compared to AUC=0.67. Kappa=0.21). The performance of the BROMPRS-based delight and frustration detectors was also higher compared to SR-based detectors. In contrast, after controlling for the affect distributions, the performance of engaged concentration detectors was slightly higher for SR. Given that BROMP data was resampled to control for the affect distribution when comparing both types of ground truth, these results suggest a higher consistency in the affect categorization of human observers compared to students’ self-reports for boredom, confusion and frustration. On the other hand, these results also suggest that human observers may have categorized some instances of other affective states as engaged concentration.
Moreover, the increase in performance between original BROMP observations and the BROMPRS-based detectors is explained by the higher imbalance in the original distribution of BROMP observations. This also explains the reduction in performance for engaged concentration after reducing its rate during resampling. These results do not imply that the BROMP-based detectors are worse than the BROMPRS-based detectors. In fact, BROMP-based detectors could arguably perform better because they use more samples for the training process, and therefore, our analysis will be focused on these detectors using the original data BROMP observations.
Feature Comparisons
Table 4 shows how the 9 types of features described in Table 1 emerge in these detectors. Specifically, it compares the features selected by the SR-based detectors to those selected by the original BROMP-based detectors and the BROMPRS-based detectors. In general, this table shows there is little overlap between the features selected for SR-based detectors and those selected by the two BROMP-based detectors. Overall, 25 of 45 instances in this comparison (highlighted in grayscale) show no overlap in feature type between the SR-based detectors and either BROMP-based detector. Three groups of features included in this study describe students' most basic interactions with the game, and these show little overlap. For example, general features were selected 8 times by these detectors, and this category is most common in the boredom detectors. There is some overlap in the two BROMP-based boredom detectors, where both the original detector and the BROMPRS-based detector use the same feature (i.e., duration), but this is not the general feature selected by the SR-based boredom detector. No other overlap was shown between SR-based detectors and BROMP-based detectors for this feature.
For reading features, the results are very similar. Most reading features were selected by BROMP-based or BROMPRS-based detectors, and the two features that were selected by the SR-based delight detector were different from the reading feature selected by the BROMPRS-based delight detector.
Results for conversation features were slightly different, but overlap was still minimal. For three affective states, a conversation feature was selected both by the SR-based detector and by the BROMPRS-based detector (i.e., boredom, concentration and confusion). As with the reading features, these features were not identical to one another.
Two other sets of features (concept matrix/worksheet and hypotheses) encode information about students' scientific activities in the game. These also show minimal overlap between SR-based and BROMP-based detectors. For the first category, only the boredom and confusion detectors showed this feature type appearing in an SR-based detector and a BROMP-based detector, and these were not identical features. The second category contains an exception to this overlap. Although one feature (HypothesisTesting-to-Reading) appears in both the SR-based concentration detector and the BROMPRS-based concentration detector, the only other overlap is between the two BROMP-based detectors of boredom.
Three feature sets are related to locations in the game. These include outside, Bryce’s quarters, and other location specific features. The outside category shows overlap between SR-based and BROMP-based detectors for three affective states. For concentration and frustration, the features are not identical, but for confusion one feature (MovementOutsideLastMinute) was selected by both the SR-based and BROMPRS-based detector.
Feature Type | Boredom | Concentration / Focus | Confusion | Delight/ Happiness | Frustration | Grand Total | ||||||||||||
|---|---|---|---|---|---|---|---|---|---|---|---|---|---|---|---|---|---|---|
SR | BR | BRRS | SR | BR | BRRS | SR | BR | BRRS | SR | BR | BRRS | SR | BR | BRRS | SR | BR | BRRS | |
General | 1 | 1 | 2 | 0 | 2 | 0 | 0 | 0 | 0 | 0 | 0 | 0 | 0 | 0 | 2 | 1 | 3 | 4 |
Reading | 0 | 1 | 0 | 0 | 1 | 1 | 0 | 0 | 2 | 2 | 0 | 1 | 0 | 0 | 1 | 2 | 2 | 5 |
Conversations | 1 | 0 | 1 | 1 | 0 | 1 | 1 | 0 | 2 | 1 | 0 | 0 | 0 | 1 | 0 | 4 | 1 | 4 |
Hypotheses | 0 | 1 | 1 | 1 | 0 | 1 | 2 | 2 | 0 | 1 | 0 | 0 | 1 | 0 | 1 | 5 | 3 | 3 |
Conc.Mx/Wrksht | 1 | 0 | 1 | 1 | 0 | 0 | 1 | 1 | 0 | 0 | 0 | 0 | 0 | 0 | 1 | 3 | 1 | 2 |
Outside | 0 | 1 | 0 | 1 | 1 | 0 | 1 | 1 | 1 | 0 | 3 | 2 | 2 | 0 | 2 | 4 | 5 | 5 |
Bryce’s Quarters | 0 | 1 | 0 | 0 | 0 | 0 | 1 | 0 | 0 | 0 | 0 | 1 | 0 | 1 | 0 | 1 | 2 | 1 |
Other Locations | 2 | 1 | 0 | 1 | 1 | 3 | 2 | 2 | 2 | 0 | 2 | 2 | 3 | 3 | 2 | 8 | 10 | 9 |
Video Game Pref. | 1 | 0 | 0 | 0 | 0 | 0 | 1 | 0 | 0 | 3 | 2 | 1 | 1 | 1 | 0 | 6 | 3 | 1 |
subtotal | 6 | 6 | 5 | 5 | 5 | 6 | 9 | 6 | 7 | 7 | 7 | 7 | 7 | 6 | 9 | 34 | 30 | 34 |
Only four features related to Bryce’s quarters—the location in the game that contains the most academic content—were selected for any of the detectors. These four appeared in the BROMP-based detector of boredom, the SR-based detector of confusion, the BROMPRS-based detector of delight, and the BROMP-based detector of frustration. In other words, the SR-based and BROMP-based detectors of the same affective state showed no overlap.
Among the 27 other location-specific features, Table 4 shows the greatest potential of identical features appearing in SR-based and BROMP-based detectors of the same affective state. For example, 8 of these features are distributed among the three confusion detectors, but no identical features are found across SR and BROMP-based confusion detectors or for any other affective states.
Finally, we look at video game preference features. These were unique in that they were extracted from a survey that students took at the beginning of the game as opposed to their behaviors within the game. These features typically appeared in SR-based detectors (i.e., boredom, confusion, happiness, frustration, and nervousness), though they also appeared in BROMP-based detectors of delight and frustration. Only one answer appeared as a feature across detectors from different data sources. Specifically, SR-based, BROMP-based and BROMPRS-based detector of delight included a feature for students who preferred role-playing games.
Detector Comparisons
Next, we consider differences between predictions made by the two sets of detectors when labeling the same 20-second clips. For these comparisons, we use the original distributions for both detectors (i.e., not BROMP resampled). The original distributions allow us to further analyze the varying signals collected by these two mechanisms (including varying base rates in the data) and how that influences future detection. We correlated the detector predictions for aligned 20-second clips (across students, N=15,964) for the two types of detectors (SR and BROMP-based) for each construct pair.
The correlation matrix (shown in Table 5) shows a positive trend along the diagonal (e.g., the two boredom detectors were positively correlated), but low correlations overall (rho=-0.42 to rho=.24). Significance values are not reported due to the lack of independence between samples, however we report the magnitude of the correlations as this can still be informative.
|
| BROMP-based detectors | ||||
|---|---|---|---|---|---|---|
|
| Bor. | Conc. | Conf. | Frus. | Del. |
SR-based | Bored | 0.09 | -0.02 | 0.17 | -0.36 | -0.42 |
Focused | -0.19 | 0.2 | -0.13 | 0.06 | 0.13 | |
Confused | 0.01 | 0.2 | 0.01 | -0.09 | -0.21 | |
Frustrated | 0.09 | -0.11 | 0.02 | 0.16 | 0.07 | |
Happy | -0.05 | -0.14 | 0.04 | -0.07 | 0.24 | |
Nervous | 0.03 | 0 | -0.01 | -0.02 | 0.08 | |
It should be noted that the correlations indicate only a weak alignment between the two detectors. Of particular note, when detectors based on the students’ self-report say that the student is happy, observer-based detectors of delight most often concur (rho=0.24). Likewise, when SR-based detectors predict that a student is focused, BROMP-based detectors are most likely to agree (rho=0.2), but they may also predict that the student is frustrated (rho=0.06) or delighted (rho=0.13).
Other detector relationships are not as strong. When SR-based detectors predict that a student is bored, BROMP-based detectors sometimes agree (rho=0.09) but they more often predict that the student is confused (rho=0.17). Likewise, when SR-based detectors identify frustration, BROMP-based detectors often agree (rho=0.16), but sometimes predict that the student is bored (rho=0.09). When SR-based detectors predict that a student is nervous (an affective experience with no correlation in current BROMP-coding schemes), BROMP-based detectors are most likely to predict delight (rho=0.08).
Detector | Self Efficacy (N=122) | Situational Interest (N=122) | Pre-Test (N=122) | Norm. Learning Gains (N=46) | |
|---|---|---|---|---|---|
Boredom | SR | -0.29 (p=0.00)* | -0.31 (p<0.00)* | 0.02 (p=0.86) | -0.23 (p=0.12) |
BROMP | -0.143 (p=0.12) | -0.27 (p=0.00)* | -0.15 (p=0.10) | -0.39 (p=0.01)* | |
Concentration/Focus | SR | 0.17 (p=0.06) | 0.18 (p=0.05) | 0.13 (p=0.17) | 0.24 (p=0.09) |
BROMP | 0.11 (p=0.22) | 0.14 (p=0.14) | 0.09 (p=0.35) | 0.19 (p=0.20) | |
Confusion | SR | -0.19 (p=0.04) | -0.04 (p=0.65) | -0.21 (p=0.02) | -0.03 (p=0.86) |
BROMP | -0.05 (p=0.57) | -0.06 (p=0.53) | -0.11 (p=0.25) | -0.21 (p=0.14) | |
Delight/Happiness | SR | -0.08 (p=0.37) | 0.09 (p=0.34) | -0.18 (p=0.05) | 0.28 (p=0.05) |
BROMP | 0.16 (p=0.07) | 0.29 (p=0.00)* | 0.03 (p=0.77) | 0.22 (p=0.14) | |
Frustration | SR | 0.12 (p=0.18) | 0.13 (p=0.89) | -0.02 (p=0.82) | -0.12 (p=0.42) |
BROMP | 0.13 (p=0.15) | 0.14 (p=0.13) | 0.02 (p=0.80) | -0.03 (p=0.84) | |
Correlation with Learning and Interest
All SR-based & BROMP-based detectors
Our next analysis compares the relationship between these two suites of detectors (SR-based and BROMP-based) and learning and interest measures. Table 6 presents the Spearman correlations of each detector (aggregated at the student level) against measures of self-efficacy, interest, prior knowledge, and learning as collected with pre- and post-test surveys. Three subscales of surveys are not given here, as they were not significantly correlated with any detector (the IMI’s value-utility, pressure-tension, and emotion-attention). Significance levels in the table reflect a Benjamini-Hochberg post hoc correction (B&H; [9]) that was applied to each scale to correct for multiple comparisons.
Results in Table 6 show that boredom detectors show more statistically significant relationships with the four learning and interest measures than any of the other detectors. Specifically, the SR-based boredom detector was negatively associated with Britner & Pajares’ [12] self-efficacy measure (rho=-0.29; p=0.00) and Linnenbrink-Garcia et al.’s [49] situational interest scale (rho=-0.31, p=0.00). Meanwhile, the BROMP-based boredom detector was negatively associated with situational interest (rho=-0.27, p=0.00) and normalized learning gains (rho=-0.39, p=0.01). The last statistically significant relationship was between the BROMP-based delight detector and situational interest (rho=0.29, p=0.00).
Analysis of Detector Agreement/Disagreement
To further examine the impacts of how ground truth measurement influences future detection, we considered specifically the instances where the detectors disagreed (as described in Table 6). For example, the positive correlation between the SR-based boredom detector and the BROMP-based confusion detector implies a disagreement. We anchor this analysis with instances where the two detectors agreed (i.e., both detectors predict the student is bored), and we normalize instances of agreement and disagreement based on the number of clips per student (dividing instances of agreement or disagreement between detectors for each student in the total number of student’s clips). We then calculate the Spearman correlation between the number of instances per student where each of these disagreements (and agreements) appear and the students’ learning and interest measures.
Descriptive states for these correlated clips are given in Table 7, which presents how often these correlated clips occurred for each student. It also includes the number of students for whom the overlapping labels occurred. The relationship between the clip labels and the learning and outcome measures is given in Table 8.
SR Label | BROMP Label | Students | Min | Max | Avg | SD |
|---|---|---|---|---|---|---|
Bored | Bored | 7 | 9 | 121 | 35.0 | 36.4 |
Conf. | 58 | 1 | 65 | 9.2 | 13.9 | |
Conf. | Conf. | 20 | 1 | 25 | 6.7 | 6.3 |
Conc. | 104 | 1 | 78 | 15.4 | 15.8 | |
Frus. | Frus. | 11 | 1 | 24 | 5.6 | 6.8 |
Bored | 4 | 24 | 79 | 45.0 | 20.7 |
We first look at clips that were labeled as boredom by the SR-based detectors, where BROMP detectors sometimes agreed (rho=0.09, Table 5), but more often produced a confusion label (rho=0.17, Table 5). As the data in Table 8 show, both sets of clips are correlated with self-efficacy at the same rate (rho=-0.19). In other words, students with low self-efficacy are more likely to label themselves as boredom more generally (rho=-0.29, Table 6), but this may present as either boredom or confusion to external observers. Situational interest, which was significantly correlated with SR-based boredom detectors more generally (and at approximately the same level as for self-efficacy, i.e., rho=-0.31, Table 6) were still marginally statistically significant once this further division was applied.
Detector Prediction | Self Efficacy | Sit Interest | Pre-Test | Norm. LG | |
|---|---|---|---|---|---|
SR | BROMP | ||||
Bored | Bored | -0.19 | -0.15 | -0.13 | 0.05 |
(p=0.04) | (p=0.09) | (p=0.16) | (p=0.74) | ||
Conf. | -0.19 | -0.17 | -0.11 | -0.03 | |
(p=0.04) | (p=0.06) | (p=0.23) | (p=0.86) | ||
Conf. | Conf | 0.13 | 0.01 | -0.04 | -0.4 |
(p=0.14) | (p=0.97) | (p=0.70) | (p-0.00) | ||
Conc. | 0.02 | 0.18 | -0.06 | 0.11 | |
|
| (p=0.82) | (p=0.05) | (p=0.49) | (p=0.45) |
Frus. | Frus. | 0.05 | -0.03 | -0.01 | -0.03 |
(p=0.55) | (p=0.72) | (p=0.91) | (p=0.86) | ||
Bored | -0.18 | -0.1 | 0.06 | -0.11 | |
|
| (p=0.05) | (p=0.29) | (p=0.51) | (p=0.45) |
We next look at the clips that were labeled as confused by the SR-based detectors, where BROMP detectors rarely agreed (rho=0.01, Table 5), and instead were more likely to produce a concentration label (rho=0.2 Table 5). Despite the infrequency of agreement between these two detectors (rho=-0.40, Table 8) among a low number of students (N=20, Table 7), agreement between the two detectors produces one of the strongest correlations with outcome measures that we see in this entire study. Namely, clips that are labeled as confused by both SR-based and BROMP-based detectors are significantly correlated with normalized learning gains at rho=-0.40 (Table 8). However, when the SR-based detector labels a clip as confused and a BROMP-based detector labels the clip as concentrating, the correlation with learning gains disappears and instead we find a significant correlation with situational interest (rho=0.18). This suggests that students with different levels of interest may be presenting their confusion in different ways.
Finally, we look at clips that were labeled as frustration by the SR-based detectors. Our prior analysis (Table 5) showed that these clips were most often correlated with a matching frustration label from the BROMP-based detectors (rho=0.16), but that they were also frequently labeled with boredom (rho=0.09). Our analysis in Table 8 shows that the clips with matching labels are not significantly correlated with any of our learning and outcome measures, but clips where there is disagreement (i.e., the SR-based detector predicts frustration while the BROMP-based detector predicts boredom) are negatively correlated with self-efficacy (rho=-0.18) at about the same rate that is found for the SR-boredom clips that are also included in this table.
Discussion
Study Goals
This study seeks to better understand how our modeling methods impact our understanding of students’ affective experiences. Specifically, it compares the impact of using two different kinds of ground truth measurements (self-report vs. BROMP observation) commonly used supervised machine learning for developing affect detectors. In order to ensure fair comparisons, we first report on the construction and performance of these detectors, including controlling for different distributions between the datasets through resampling.
Comparison of raw measurements in this study (i.e., the training labels obtained through self-reports or BROMP observations) is challenging because the sampling rates of momentary time sampling methods (that used in BROMP) are susceptible to different biases than other kinds of sampling methods (e.g., the triggers used for our self-report data). These sampling differences are hard to adjust for [57]. That said, the results from these two measures are consistent with previous research, where self-report tends to report much higher rates of boredom than classroom observations [7]. These large differences in the rates of boredom and focus/engaged concentration in the raw training data support the conjecture that the two methods record different signals of the internal states. One hypothesis for this is that observations might be picking up on more of the in-the-moment affective expressions while self-report may be picking up on affect influenced by trait-like internal qualities (e.g., motivation, interest, game preference, and prior knowledge).
Instead, our study focuses on comparing the output of the two suites of detectors, which can be applied at the same sampling level. We then compare the constituent features of corresponding detectors and their co-correlations. Both of these analyses also suggest that corresponding SR-based and BROMP-based detectors are picking up on different signals, as do the results of our correlational study, which compares the detector output to motivational and learning constructs.
Main Findings
Feature analyses (section 4.1) support the hypothesis that SR and BROMP-based detectors are picking up on different signals, as do the correlations between the two suites of detectors in section 4.2.
Notably, we show minimal overlap in types of features selected, and even less in the specific features selected when comparing SR-based detectors to BROMP-based detectors of the same state. While feature interpretability is challenging with such complex models, the emergence of video game preferences as more common feature in SR-based detectors than in BROMP-based or BROMPRS-based detectors also suggests that the SR-based detectors are more likely to be picking up on trait-like qualities of students emotional experience, while the BROMP and BROMPRS-based detectors may be reflecting more transient experiences that the observers are focused on. For example, a student might appear to be confused to the outside observer, but unable or unwilling to apply that label because of low interest in the game (resulting in self-reported boredom).
Validity and generalizability concerns related to machine-learned detectors should also be closely considered in the interpretation of the correlations we present in 4.2, as any machine-learned model is likely to demonstrate statistical noise. However, our analyses in section 4.3 shows that these two suites of detectors—like those in previous research using the same well-established methods—are both associated with important learning and interest measures. Specifically, section 4.3.1 shows that both SR-based and BROMP-based detectors are associated with situational interest, but only the SR-based detector of boredom is associated with self-efficacy and only the BROMP-based detector of boredom is associated with learning. These findings offer evidence that both types of detectors are related to constructs that are important to student learning experiences, as opposed to suggesting that neither is useful.
Finally, we considered how the agreement and contradictions between the two suites of detectors might tell us about the students’ broader learning experience (section 4.3.2). These analyses seek to answer Graesser et al.’s [35] call to better understand what it means when self-reports and external observations do not agree by focusing on the strongest positive correlations found in 4.2. Namely, we focus on data where the SR-based detectors labeled clips as boredom, confusion, or frustration. In some cases, the output of these detectors was strongly correlated with the corresponding affective state from the BROMP-based detectors, but in other cases there were discrepancies that deserve consideration.
Interpretations
Research on the differences between self-report and observational measurements points to the availability of different signals. For instance, an observer might see a student who has reached an impasse as experiencing confusion or frustration, but self-reported confusion requires some metacognitive recognition on the part of the student. If the student does not believe they are wrong (e.g., if they decide the system is providing them with incorrect feedback), their motivation to continue may evaporate quickly, leading them to accurately report internal feelings of boredom. Similarly, a student who knows that they are wrong but has low motivation to continue (e.g., because they have low self-efficacy) may also process the experience as boredom. In contrast, a student with high motivation (e.g., high situational interest) might hit a minor impasse and recognize internal feelings of confusion without visibly demonstrating it to the observer.
The kinds of overlap that this study shows in its comparison of self-report and observational models requires a more complex approach than has been found in many previous EDM studies that have sought to model student affect. In many cases, more simple approaches may be desirable. However, we show that there are cases where differences between the two sets of detectors are related to distinct learning and interest measures. For example, SR-based confusion is correlated with learning gains when BROMP-based detectors agree, but with situational interest when BROMP-based detectors predict that the student is concentrating. From these results, we might infer that students’ experience of confusion is different depending on their situational interest levels, and that these differences were likely manifesting in observably different ways during the BROMP data collection process.
These results suggest that having affect detectors generated from both sets of ground-truth measures could be potentially revealing in terms of better understanding the complex relationships between epistemic emotions and learning. These results are also in line with longstanding research that suggests that other affective states may have more than one type. For example, Gee’s proposes the notion of pleasurable frustration as distinct from a more canonical experience of frustration [33], and more recently Cloude and colleagues have suggested that both confusion and frustration may manifest in multiple ways [16].
Limitations & Future Work
One potential limitation of this study is that our results do not reveal a single gold standard. Because both sets of detectors correlate with learning and interest measures, we cannot recommend one measurement strategy over another. However, as we have discussed, finding a single gold standard was not the goal of this project.
Another potential limitation is that these results stem from only one learning environment. It is possible that different types of learning experiences (e.g., those from a more traditional intelligent tutoring system) might be different than those that we are finding in Crystal Island. We hope that these results might inspire future research that compares similar kinds of data.
Future work should look at additional methods for exploring detector differences, such as data-driven classroom interviews [5] Specifically, we would like to compare instances where SR-based and BROMP-based detectors contradict one another within Crystal Island (e.g., when SR-based detectors predict confusion but BROMP-based detectors predict concentration) to the times in which they agree (e.g., when both sets of detectors predict confusion). In-the-moment interviews could help us to better characterize these affective experiences so that we can better understand how to support students. This approach could also help us better understand students’ affective experiences during learning (even when only one suite of detectors is being applied) as in [2, 5].
Conclusions
Latent states such as affect can be challenging to accurately measure, either by self-report (subject to internal biases) or observation (subject to observer bias and presentation effects). In this work, we investigate how the ground truth collection impacts the performance of affect detectors, including how it changes the selected features in our models. We do so in service of better understanding differences in the different signals being collected.
In contrast to previous research, which has suggested that we might achieve validity in affective research by demonstrating agreement between self-report and external observations [62], we argue the opposite. Namely, we suggest that students have access to different kinds of information about their learning experience than the person observing them. Drawing upon these rich and diverse personal experiences can provide us with meaningful data about how students learn. Likewise, the consistency of an established external observation method like BROMP, which requires training and certification before an observer can collect data, can provide stability that might not be found among students with various levels of motivation or metacognitive skills.
Rather than arguing that one measure is better than the other, we suggest that two sets of affect detectors may be better than one. Specifically, we point to the strong evidence about the social construction of emotions that has been more commonly discussed in other fields (e.g., [29]). This approach assumes that the experience of emotion includes a constellation of signals that are both internal and external to the students, and that the student and the observer would apply a linguistically appropriate label depending on their attention to how these signals manifested and where their attention was most closely focused. Under social constructivist assumptions [28], both self-report and observational labels could be simultaneously correct even if they sometimes showed disagreement.
Other theoretical frameworks also argue for a more complex and less deterministic formation and presentation of academic emotions than is suggested by the frameworks that have influenced common categorical labeling practices in the EDM community. For example, while Izard’s [39] theoretical framework takes a categorical stance for basic emotions, it argues that academic emotions are more constructed. This description also makes space for the possibility that a single categorical label might represent more than one type of affective experience.
Such possibilities have not been considered in much of the previous EDM research. Although the field has sometimes explored differences in valence and arousal, it has more commonly favored the simplicity of categorical labels applied one at a time. We see the present study as building off this approach, which has been very successful at improving our understanding of the relationships between in-the-moment affective experiences and student learning.
At the same time, we encourage the field to consider how the theoretical and methodological assumptions that we are making as we collect data might be influencing our results. Specifically, we point to evidence in this study that suggests that although self-report and external observations appear to be modeling slightly different information about the students' experience, both are tapping into important signals about learning and motivation. We hope that future work will continue to explore how these methodological differences could be seen as an opportunity rather than a drawback as we work to better understand these complex emotions.
Acknowledgements
This research was supported by National Science Foundation Grants IIS-2016943 and IIS-2016993. Any opinions, findings, and conclusions expressed in this material are those of the authors and do not necessarily reflect the views of the National Science Foundation. We would also like to thank members of our advisory board who consulted on the survey development for this project, including Roger Azevedo, Luc Paquette, K. Ann Renninger, and Rod Roscoe. Andres Felipe Zambrano thanks the Ministerio de Ciencia, Tecnología e Innovación and the Fulbright-Colombia commission for supporting his doctoral studies through the Fulbright-MinCiencias 2022 scholarship.
References
- Afzal, S. and Robinson, P. 2009. Natural affect data—Collection & annotation in a learning context. 2009 3rd International Conference on Affective Computing and Intelligent Interaction and Workshops (2009), 1–7.
- Andres, J.A.L., Hutt, S., Ocumpaugh, J., Baker, R.S., Nasiar, N. and Porter, C. 2022. How anxiety affects affect: a quantitative ethnographic investigation using affect detectors and data-targeted interviews. Advances in Quantitative Ethnography: Third International Conference, ICQE 2021, Virtual Event, November 6–11, 2021, Proceedings 3 (2022), 268–283.
- Arroyo, I., Cooper, D.G., Burleson, W., Woolf, B.P., Muldner, K. and Christopherson, R. 2009. Emotion sensors go to school. Artificial intelligence in education (2009), 17–24.
- Baker, R.S., Gowda, S.M., Wixon, M., Kalka, J., Wagner, A.Z., Salvi, A., Aleven, V., Kusbit, G.W., Ocumpaugh, J. and Rossi, L. 2012. Towards Sensor-Free Affect Detection in Cognitive Tutor Algebra. International Conference on Educational Data Mining (2012), 126–133.
- Baker, R.S., Nasiar, N., Ocumpaugh, J.L., Hutt, S., Andres, J.M., Slater, S., Schofield, M., Moore, A., Paquette, L., Munshi, A., and others 2021. Affect-targeted interviews for understanding student frustration. International Conference on Artificial Intelligence in Education (2021), 52–63.
- Baker, R.S., Ocumpaugh, J., Gowda, S.M., Kamarainen, A.M. and Metcalf, S.J. 2014. Extending log-based affect detection to a multi-user virtual environment for science. User Modeling, Adaptation, and Personalization: 22nd International Conference, UMAP 2014, Aalborg, Denmark, July 7-11, 2014. Proceedings 22 (2014), 290–300.
- Baker, R.S.J. d., D’Mello, S.K., Rodrigo, Ma.M.T. and Graesser, A.C. 2010. Better to be frustrated than bored: The incidence, persistence, and impact of learners’ cognitive–affective states during interactions with three different computer-based learning environments. International Journal of Human-Computer Studies. 68, 4 (Apr. 2010), 223–241. DOI:https://doi.org/10.1016/j.ijhcs.2009.12.003.
- Baker, R.Sj. and Ocumpaugh, J. 2014. Interaction-Based Affect Detection in Educational Software. The Oxford handbook of affective computing. (2014), 233.
- Benjamini, Y. and Hochberg, Y. 1995. Controlling the false discovery rate: a practical and powerful approach to multiple testing. Journal of the Royal statistical society: series B (Methodological). 57, 1 (1995), 289–300.
- Bosch, N. and D’Mello, S. 2014. Co-occurring affective states in automated computer programming education. Proceedings of the Workshop on AI-supported Education for Computer Science (AIEDCS) at the 12th International Conference on Intelligent Tutoring Systems (2014), 21–30.
- Bosch, N., D’Mello, S., Baker, R., Ocumpaugh, J., Shute, V., Ventura, M., Wang, L. and Zhao, W. 2015. Automatic detection of learning-centered affective states in the wild. Proceedings of the 20th international conference on intelligent user interfaces (2015), 379–388.
- Britner, S.L. and Pajares, F. 2006. Sources of science self-efficacy beliefs of middle school students. Journal of Research in Science Teaching. 43, 5 (2006), 485–499. DOI:https://doi.org/10.1002/tea.20131.
- Broekens, J. and Brinkman, W.-P. 2013. AffectButton: A method for reliable and valid affective self-report. International Journal of Human-Computer Studies. 71, 6 (2013), 641–667.
- Burusic, J. and Ribar, M. 2014. The moderating role of self-presentation tactics. Swiss Journal of Psychology. 73, 4 (2014).
- Calvo, R.A. and D’Mello, S. 2010. Affect detection: An interdisciplinary review of models, methods, and their applications. IEEE Transactions on affective computing. 1, 1 (2010), 18–37.
- Cloude, E.B., Munshi, A., Andres, J.M.A., Ocumpaugh, J., Baker, R.S. and Biswas, G. 2024. Exploring Confusion and Frustration as Non-linear Dynamical Systems. Proceedings of the 14th Learning Analytics and Knowledge Conference (New York, NY, USA, 2024), 241–252.
- Conati, C., Hoque, E., Toker, D. and Steichen, B. 2013. When to Adapt: Detecting User’s Confusion During Visualization Processing. UMAP Workshops (2013).
- Conati, C. and Maclaren, H. 2009. Empirically building and evaluating a probabilistic model of user affect. User Modeling and User-Adapted Interaction. 19, 3 (Aug. 2009), 267–303. DOI:https://doi.org/10.1007/s11257-009-9062-8.
- Cowie, R. and Cornelius, R.R. 2003. Describing the emotional states that are expressed in speech. Speech Communication. 40, 1 (2003), 5–32. DOI:https://doi.org/10.1016/S0167-6393(02)00071-7.
- Darwin, C. and Prodger, P. 1998. The expression of the emotions in man and animals. Oxford University Press, USA.
- Deci, E.L. and Ryan, R.M. 2007. SDT: Questionnaires: Intrinsic motivation inventory (IMI). Retrieved October. 27, (2007), 2009.
- DeFalco, J.A., Rowe, J.P., Paquette, L., Georgoulas-Sherry, V., Brawner, K., Mott, B.W., Baker, R.S. and Lester, J.C. 2018. Detecting and Addressing Frustration in a Serious Game for Military Training. International Journal of Artificial Intelligence in Education. 28, 2 (Jun. 2018), 152–193. DOI:https://doi.org/10.1007/s40593-017-0152-1.
- Di Leo, I., Muis, K.R., Singh, C.A. and Psaradellis, C. 2019. Curiosity… Confusion? Frustration! The role and sequencing of emotions during mathematics problem solving. Contemporary educational psychology. 58, (2019), 121–137.
- D’mello, S. and Graesser, A. 2013. AutoTutor and affective autotutor: Learning by talking with cognitively and emotionally intelligent computers that talk back. ACM Trans. Interact. Intell. Syst. 2, 4 (Jan. 2013). DOI:https://doi.org/10.1145/2395123.2395128.
- D’Mello, S. and Graesser, A. 2012. Dynamics of affective states during complex learning. Learning and Instruction. 22, 2 (2012), 145–157. DOI:https://doi.org/10.1016/j.learninstruc.2011.10.001.
- D’Mello, S.K., Craig, S.D., Witherspoon, A., McDaniel, B. and Graesser, A. 2008. Automatic detection of learner’s affect from conversational cues. User Modeling and User-Adapted Interaction. 18, 1 (Feb. 2008), 45–80. DOI:https://doi.org/10.1007/s11257-007-9037-6.
- Douglas-Cowie, E., Cowie, R., Sneddon, I., Cox, C., Lowry, O., Mcrorie, M., Martin, J.-C., Devillers, L., Abrilian, S., Batliner, A., and others 2007. The HUMAINE database: Addressing the collection and annotation of naturalistic and induced emotional data. Affective Computing and Intelligent Interaction: Second International Conference, ACII 2007 Lisbon, Portugal, September 12-14, 2007 Proceedings 2 (2007), 488–500.
- Ekman, P. and Friesen, W. 1976. Measuring facial movement: environmental psychology and nonverbal communication. San Francisco: Human Sciences. (1976).
- Feldman-Barrett, L. 2017. How emotions are made: The secret life of the brain. Pan Macmillan.
- Feldman-Barrett, L., Gross, J., Christensen, T.C. and Benvenuto, M. 2001. Knowing what you’re feeling and knowing what to do about it: Mapping the relation between emotion differentiation and emotion regulation. Cognition & Emotion. 15, 6 (2001), 713–724.
- Fu, E., Laporte, M., Guerrero Toro, C., Gjoreski, M. and Langheinrich, M. 2022. Affect and Learning in the LAUREATE Dataset. Adjunct Proceedings of the 2022 ACM International Joint Conference on Pervasive and Ubiquitous Computing and the 2022 ACM International Symposium on Wearable Computers (2022), 168–172.
- Fuentes, C., Herskovic, V., Rodríguez, I., Gerea, C., Marques, M. and Rossel, P.O. 2017. A systematic literature review about technologies for self-reporting emotional information. Journal of Ambient Intelligence and Humanized Computing. 8, (2017), 593–606.
- Gee, J.P. 2012. Situated language and learning: A critique of traditional schooling. New York: Routledge.
- Goetz, T., Bieg, M. and Hall, N.C. 2016. Assessing academic emotions via the experience sampling method. Methodological advances in research on emotion and education. (2016), 245–258.
- Graesser, A., McDaniel, B., Chipman, P., Witherspoon, A., D’Mello, S. and Gholson, B. 2006. Detection of emotions during learning with AutoTutor. Proceedings of the 28th annual meetings of the cognitive science society (2006), 285–290.
- Gunes, H. and Pantic, M. 2010. Dimensional emotion prediction from spontaneous head gestures for interaction with sensitive artificial listeners. Intelligent Virtual Agents: 10th International Conference, IVA 2010, Philadelphia, PA, USA, September 20-22, 2010. Proceedings 10 (2010), 371–377.
- He, J. and Van de Vijver, F.J. 2015. Self-presentation styles in self-reports: Linking the general factors of response styles, personality traits, and values in a longitudinal study. Personality and Individual Differences. 81, (2015), 129–134.
- Hutt, S., Grafsgaard, J.F. and D’Mello, S.K. 2019. Time to scale: Generalizable affect detection for tens of thousands of students across an entire school year. Proceedings of the 2019 CHI conference on human factors in computing systems (2019), 1–14.
- Izard, C.E. 2007. Basic emotions, natural kinds, emotion schemas, and a new paradigm. Perspectives on psychological science. 2, 3 (2007), 260–280.
- Jack, R.E. and Schyns, P.G. 2015. The human face as a dynamic tool for social communication. Current Biology. 25, 14 (2015), R621–R634.
- Jack, R.E., Sun, W., Delis, I., Garrod, O.G. and Schyns, P.G. 2016. Four not six: Revealing culturally common facial expressions of emotion. Journal of Experimental Psychology: General. 145, 6 (2016), 708.
- Kai, S., Paquette, L., Baker, R.S., Bosch, N., D’Mello, S., Ocumpaugh, J., Shute, V. and Ventura, M. 2015. A Comparison of Video-Based and Interaction-Based Affect Detectors in Physics Playground. International Educational Data Mining Society. (2015).
- Kapoor, A., Burleson, W. and Picard, R.W. 2007. Automatic prediction of frustration. International journal of human-computer studies. 65, 8 (2007), 724–736.
- Kassam, K.S. and Mendes, W.B. 2013. The effects of measuring emotion: Physiological reactions to emotional situations depend on whether someone is asking. PloS one. 8, 6 (2013), e64959.
- Krosnick, J.A. 1991. Response strategies for coping with the cognitive demands of attitude measures in surveys. Applied cognitive psychology. 5, 3 (1991), 213–236.
- Lallé, S., Murali, R., Conati, C. and Azevedo, R. 2021. Predicting co-occurring emotions from eye-tracking and interaction data in MetaTutor. International Conference on Artificial Intelligence in Education (2021), 241–254.
- Laurans, G., Desmet, P.M. and Hekkert, P. 2009. The emotion slider: A self-report device for the continuous measurement of emotion. 2009 3rd International Conference on Affective Computing and Intelligent Interaction and Workshops (2009), 1–6.
- Lepper, M.R., Woolverton, M., Mumme, D.L. and Gurtner, J. 1993. Motivational techniques of expert human tutors: Lessons for the design of computer-based tutors. Computers as cognitive tools. 1993, (1993), 75–105.
- Linnenbrink-Garcia, L., Durik, A.M., Conley, A.M., Barron, K.E., Tauer, J.M., Karabenick, S.A. and Harackiewicz, J.M. 2010. Measuring situational interest in academic domains. Educational and psychological measurement. 70, 4 (2010), 647–671.
- Liu, Z., Pataranutaporn, V., Ocumpaugh, J. and Baker, R. 2013. Sequences of frustration and confusion, and learning. International Conference on Educational Data Mining (2013), 114–120.
- Ma, M., Ren, J., Zhao, L., Testuggine, D. and Peng, X. 2022. Are multimodal transformers robust to missing modality? Proceedings of the IEEE/CVF Conference on Computer Vision and Pattern Recognition (2022), 18177–18186.
- McQuiggan, S.W. and Lester, J.C. 2009. Modelling affect expression and recognition in an interactive learning environment. International Journal of Learning Technology. 4, 3–4 (2009), 216–233.
- Ocumpaugh, J., Baker, R.S. d, Gaudino, S., Labrum, M.J. and Dezendorf, T. 2013. Field observations of engagement in Reasoning Mind. Artificial Intelligence in Education: 16th International Conference, AIED 2013, Memphis, TN, USA, July 9-13, 2013. Proceedings 16 (2013), 624–627.
- Ocumpaugh, J., Baker, R.S., Rodrigo, M.M., Salvi, A., Van Velsen, M., Aghababyan, A. and Martin, T. 2015. HART: The human affect recording tool. Proceedings of the 33rd annual international conference on the design of communication (2015), 1–6.
- Ocumpaugh, J., Baker, R.S. and Rodrigo, M.M.T. 2015. Baker Rodrigo Ocumpaugh Monitoring Protocol (BROMP) 2.0 Technical and Training Manual.
- Okur, E., Aslan, S., Alyuz, N., Arslan Esme, A. and Baker, R.S. 2018. Role of socio-cultural differences in labeling students’ affective states. Artificial Intelligence in Education: 19th International Conference, AIED 2018, London, UK, June 27–30, 2018, Proceedings, Part I 19 (2018), 367–380.
- Paquette, L., Ocumpaugh, J. and Baker, R.S. 2015. Simulating Multi-Subject Momentary Time Sampling. EDM (2015), 586–587.
- Pedregosa, F., Varoquaux, G., Gramfort, A., Michel, V., Thirion, B., Grisel, O., Blondel, M., Prettenhofer, P., Weiss, R., Dubourg, V., and others 2011. Scikit-learn: Machine learning in Python. the Journal of machine Learning research. 12, (2011), 2825–2830.
- Pekrun, R. and Bühner, M. 2014. Self-report measures of academic emotions. International handbook of emotions in education. Routledge. 561–579.
- Pekrun, R., Goetz, T., Titz, W. and Perry, R.P. 2002. Academic emotions in students’ self-regulated learning and achievement: A program of qualitative and quantitative research. Educational psychologist. 37, 2 (2002), 91–105.
- Pekrun, R., Lichtenfeld, S., Marsh, H.W., Murayama, K. and Goetz, T. 2017. Achievement emotions and academic performance: Longitudinal models of reciprocal effects. Child development. 88, 5 (2017), 1653–1670.
- Porayska-Pomsta, K., Mavrikis, M., D’Mello, S., Conati, C. and Baker, R.Sj. 2013. Knowledge elicitation methods for affect modelling in education. International Journal of Artificial Intelligence in Education. 22, 3 (2013), 107–140.
- Robison, J., McQuiggan, S. and Lester, J. 2010. Developing empirically based student personality profiles for affective feedback models. Intelligent Tutoring Systems: 10th International Conference, ITS 2010, Pittsburgh, PA, USA, June 14-18, 2010, Proceedings, Part I 10 (2010), 285–295.
- Rodrigo, Ma.M.T., Baker, R.S., Jadud, M.C., Amarra, A.C.M., Dy, T., Espejo-Lahoz, M.B.V., Lim, S.A.L., Pascua, S.A.M.S., Sugay, J.O. and Tabanao, E.S. 2009. Affective and behavioral predictors of novice programmer achievement. Proceedings of the 14th Annual ACM SIGCSE Conference on Innovation and Technology in Computer Science Education (New York, NY, USA, 2009), 156–160.
- Rodrigo, M.M.T., Anglo, E.A., Sugay, J. and Baker, Rsj. 2008. Use of unsupervised clustering to characterize learner behaviors and affective states while using an intelligent tutoring system. International Conference on Computers in Education (2008), 57–64.
- Rogers, T., Gašević, D. and Dawson, S. 2016. Learning analytics and the imperative for theory driven research. The SAGE Handbook of E-Learning Research,. (2016), 232–250.
- Rowe, J.P., Shores, L.R., Mott, B.W. and Lester, J.C. 2011. Integrating Learning, Problem Solving, and Engagement in Narrative-Centered Learning Environments. International Journal of Artificial Intelligence in Education. 21, 1–2 (2011), 115–133. DOI:https://doi.org/10.3233/JAI-2011-019.
- Russell, J.A. 1980. A circumplex model of affect. Journal of personality and social psychology. 39, 6 (1980), 1161.
- Sabourin, J., Mott, B. and Lester, J.C. 2011. Modeling learner affect with theoretically grounded dynamic Bayesian networks. Affective Computing and Intelligent Interaction: 4th International Conference, ACII 2011, Memphis, TN, USA, October 9–12, 2011, Proceedings, Part I 4 (2011), 286–295.
- Sabourin, J.L. and Lester, J.C. 2013. Affect and engagement in Game-BasedLearning environments. IEEE transactions on affective computing. 5, 1 (2013), 45–56.
- San Pedro, M.O., Baker, R., Bowers, A. and Heffernan, N. 2013. Predicting college enrollment from student interaction with an intelligent tutoring system in middle school. International Conference on Educational Data Mining (2013).
- Schlenker, B.R. 2003. Self-presentation. Handbook of self and identity. 2, (2003), 542–570.
- Vail, A.K., Grafsgaard, J.F., Boyer, K.E., Wiebe, E.N. and Lester, J.C. 2016. Predicting learning from student affective response to tutor questions. Intelligent Tutoring Systems: 13th International Conference, ITS 2016, Zagreb, Croatia, June 7-10, 2016. Proceedings 13 (2016), 154–164.
- de Vicente, A. and Pain, H. 1999. Motivation self-report in ITS. Proceedings of the Ninth World Conference on Artificial Intelligence in Education (1999), 648–650.
- Wang, Y., Song, W., Tao, W., Liotta, A., Yang, D., Li, X., Gao, S., Sun, Y., Ge, W., Zhang, W., and others 2022. A systematic review on affective computing: Emotion models, databases, and recent advances. Information Fusion. 83, (2022), 19–52.
- Warshaw, P.R. and Davis, F.D. 1984. Self-understanding and the accuracy of behavioral expectations. Personality and Social Psychology Bulletin. 10, 1 (1984), 111–118.
- Widen, S.C. and Russell, J.A. 2008. Children acquire emotion categories gradually. Cognitive development. 23, 2 (2008), 291–312.
- Wixon, M., Arroyo, I., Muldner, K., Burleson, W., Rai, D. and Woolf, B. 2014. The opportunities and limitations of scaling up sensor-free affect detection. International Conference on Educational Data Mining (2014), 145–152.