of Automatically Generated Questions: A Large-Scale Analysis Using Data from Natural Learning Contexts
ABSTRACT
Combining formative practice with the primary expository content in a learning by doing method is a proven approach to increase student learning. Artificial intelligence has led the way for automatic question generation (AQG) systems that can generate volumes of formative practice otherwise prohibitive with human effort. One such AQG system was developed that used textbooks as the corpus of generation for the sole purpose of generating formative practice to place alongside the textbook content for students to use as a study tool. In this work, a data set comprising over 5.2 million student-question interaction sessions was analyzed. More than 800,000 unique questions were answered across more than 9,000 textbooks, with over 400,000 students using them. As part of the user experience, students are able to rate questions after answering with a social media-style thumbs up or thumbs down. In this investigation, this student feedback data was used to gain new insights into the automatically generated questions. Are there features of questions that influence student ratings? An explanatory model was developed to analyze ten key features that may influence student ratings. Results and implications for automatic question generation are discussed.
Keywords
INTRODUCTION
A significant advantage of digital learning environments is the ability to evaluate the effectiveness of those environments. The generation of large quantities of high quality data enables learning analytics and educational data mining [1], which has also spurred a wider set of methods to distill meaning from this data [2][3]. Fischer et al. [4] identify levels of data, with the clickstream data collected by learning platforms (such as the one in this paper) categorized as microlevel big data. While it is true that “digital traces of student actions promise a more scalable and finer-grained understanding of learning processes” [4], the analysis of this data is also useful for analyzing the learning environment and tools themselves [5]. In this paper, the microlevel clickstream data is combined with syntactic and semantic data derived from natural language processing and student perception feedback gathered in the form of thumbs up/down ratings. McFarland et al. [6] note that new methods using novel data will be applied to solve educational challenges, allowing for old research questions to be answered in new ways and new research questions to arise from novel data and new techniques. The goal of this paper is to do just that—use a novel data set gathered from a digital platform to investigate the relationship of student rating data with features of automatically generated questions.
Formative practice has long been known to be a beneficial learning method, shown to increase learning gains for a wide range of age groups in diverse subjects and, while benefiting all students, it can benefit low-performing students more [7]. The integration of formative practice with content provides low- or no-stakes practice testing, a high utility learning approach [8]. The new data produced by inclusion of formative practice in digital learning environments in this learning by doing approach enables investigation of the benefits of learning by doing in novel ways. Koedinger et al. [9][10] used data from the Open Learning Initiative’s courseware environment to apply learning analytic techniques showing both correlational and causal relationships between doing practice while reading and increased learning outcomes. Called the doer effect, this learning science principle used novel data and analytics to prove the relationship between learning method and learning outcomes. Replicated in similar courseware used across many subjects at a different institution [11][12][13], the advancement of educational data mining and learning analytics has shown the doer effect benefits should be scaled to as many students as possible.
Automatic question generation (AQG) for the creation of formative practice became attainable with the advancements in natural language processing and machine learning tools in recent years. AQG systems have been developed for a wide variety of educational applications, yet notably, the systematic review of literature by Kurdi et al. [14] found only one AQG system using student data for analysis and no gold standard for performance benchmarks. The AQG system that is the subject of this paper has generated formative practice that has been used by students as part of their university courses, and this data provided initial performance metric benchmarks for engagement, difficulty, persistence, and discrimination [15][16]. This initial research found that students did not treat questions differently depending on whether they were automatically generated versus human authored, but rather according to the cognitive process dimension of the question type (recognition or recall). The large volume of student data collected by the platform was key to validating the automatically generated (AG) questions.
Next, to scale the availability of formative practice further, approximately 2.5 million AG questions were added to more than nine thousand online textbooks in the VitalSource Bookshelf e-reader platform as a free study feature called CoachMe, available to millions of students [17]. This practice feature contains several types of AG questions, including fill-in-the-blank (FITB), matching, multiple choice, and free response. The FITB questions, which comprise the majority of the AG questions, are the focus of the present study. As shown in Figure 1, the questions open in a panel next to the textbook content, allowing students to refer back to the content if needed while they answer. As formative practice, students are allowed as many attempts to answer as they like, receive immediate feedback, and can also reveal the answer if stuck.
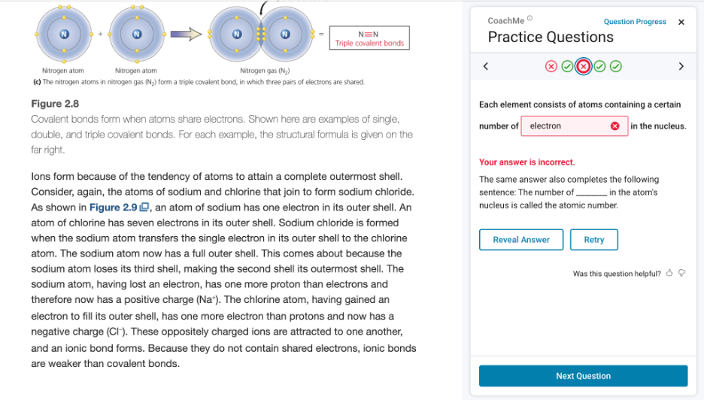
As was done in prior research [15], an analysis of difficulty and persistence performance metrics for these AG questions revealed similar results, confirming the earlier benchmarks [17]. The volume of clickstream data gathered by the platform was also useful for investigating student behavior in detail. As seen in Figure 1, when students answer a question incorrectly, they can reveal the answer or retry on their own. An analysis of student behavior patterns for each type of AG question found differences by question type, with even more differences in student behaviors when comparing the aggregated data set to a course where the practice was assigned [18].
Also shown in Figure 1 is an option for students to rate the question (“Was this question helpful?”) with a thumbs up or thumbs down. Once rated, students can offer additional written feedback. The student rating data is one stream of data used in the Content Improvement Service (CIS)—a platform-level adaptive system that monitors all AG questions in all textbooks in real time [19]. In an analysis of data used by the CIS to make decisions, about 2.2% of all questions were rated (up or down), and of that 2.2%, only 2.4% had more than one thumbs down and were slated for removal [20]. Investigating those questions removed by the CIS for multiple thumbs down ratings revealed trends across question types and features of FITB questions, such as the answer’s part of speech and position in the sentence.
However, beyond the CIS’s focus on the evaluation, removal, and replacement of questions, student rating data presents a novel way to more broadly evaluate features of questions. Combining this student rating data with clickstream data and features of questions (including syntactic and semantic data determined by natural language processing) creates a novel data set that can help identify relationships between student ratings and AG question features. In this investigation, an explanatory regression model is used to explore these relationships. Considering this data set, our overarching research question is: What relationships does the explanatory model suggest between student ratings and AG question features? This research question is investigated through a set of specific hypotheses that drive the creation of the explanatory model, as detailed in the Methods section.
Methods
Automatic Question Generation
Consistent with the evaluation study guidelines proposed by Kurdi et al. [14], we provide a concise overview of the essential features of the AQG methodology. The questions in this study are FITB cloze questions created from important sentences in the textbook content. The purpose of AQG is to create questions that are used as formative practice as students read the textbook. This AQG system uses expert-designed rules to generate questions based on the textbook content. Although the AQG approach is versatile, applicable to a broad range of subject domains, it is unsuitable for certain areas such as mathematics and language learning. The input corpus is the textbook utilized by students. Textual analysis is performed with the spaCy library version 3.3.3 [21] using the CPU-optimized large model (en_core_web_lg). Generation employs both syntactic and semantic levels of understanding. This information is used for two main tasks: identifying the sentences that will be transformed into FITB questions and choosing appropriate words within the sentences to serve as the answer blanks. Syntactic information, such as part-of-speech tagging and dependency parsing, is used in both sentence and answer selection. Semantic information is also used in detecting important content. A rule-based approach is used for the procedure of transformation.
Sentences are selected for question generation based on their importance. To identify important sentences, the textbook corpus is divided into sections of approximately 1,500 words each. This segmentation is determined by key textbook features like chapters and substantial headings, which are further subdivided when they exceed 1,500 words. Each section’s sentences are then ranked using the TextRank algorithm [22]; those with higher rankings are employed for AQG. TextRank uses vector embeddings to compute sentence similarities, with the results depending on the specifics of the embedding process. A word2vec-based model [23] is used in spaCy, which creates embeddings by averaging the vectors of the text’s constituent tokens. Before embedding, our AQG system discards stop words and tokens with no alphabetic characters (e.g., punctuation, numbers). In addition, sentences that are very short (under 5 words) or very long (over 40 words) are excluded, as these are less likely to be suitable for questions. The qualifying sentences in each textbook corpus section are then evaluated using TextRank, with the most important ones used to create questions. The other major step in generating cloze questions is choosing the word in each sentence for the answer blank. The system takes into account a variety of factors when selecting answer words, such as corpus frequency distribution, part-of-speech (POS), and presence in the textbook’s glossary.
Modeling of Student Ratings
The data set for this study is comprised of student-question interaction events for FITB questions from January 1, 2022 to January 16, 2024. The e-reader platform collects all student interactions and stores the raw clickstream data with an anonymous numeric identifier. No student characteristics are collected and the learner context is not known, though the majority of data comes from higher education institutions in the United States. Data was grouped into student-question sessions, consisting of all actions of an individual student on an individual question ordered chronologically. Sessions in which more than ten minutes had elapsed between the student’s first and last action were removed to account for the possibility of the student leaving the textbook and returning, potentially affecting rating behavior. This removed approximately 1.4% of the data.
This resulted in a data set of 5,214,211 sessions comprising 9,206,369 interaction events, involving 809,848 AG questions, 432,930 students, and 9,320 textbooks. Using the standard BISAC major subject heading classification [24] available for most of the textbooks, the top subject domains as a fraction of the sessions data set were Medical (16.0%), Business & Economics (15.3%), and Psychology (13.9%).
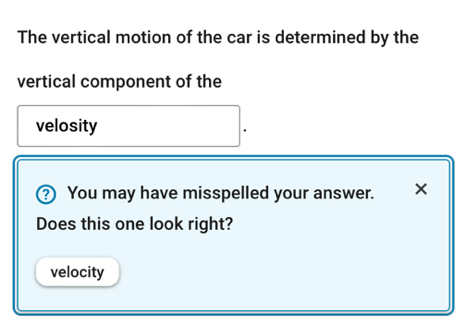
We seek to create an explanatory rather than predictive model for whether a student will rate a question. The difference is that explanatory modeling is concerned with identifying variables that are causally related to an outcome, while predictive modeling seeks variables that optimize the ability to predict whether a given outcome will occur, without specific concern for understanding why it occurs. Variable selection for an explanatory model is guided by hypotheses about how the variables affect the outcome [25]. For example, it can be hypothesized that as a question’s answer word becomes more important to the subject matter (e.g., “chromosome” vs. “cell” in a biology chapter on cell structure), the more thumbs up and fewer thumbs down the question will receive. Explanatory variables can also relate to other aspects of the student’s experience during the practice session that are not entirely intrinsic to the question itself. For example, when the student’s answer appears to be a misspelling of the correct answer, the system gives a Google-like “Did you mean ______?” suggestion (Figure 2). In sessions where a spelling suggestion was given, there were fewer thumbs down ratings. Such variables are included not only for explanatory purposes but also to control for them when assessing the effects of variables intrinsic to AQG.
H1 | Answering a question correctly on the first attempt will increase the chance of a thumbs up and decrease the chance of a thumbs down. |
H2 | As a student answers more questions, the chance of giving a rating (thumbs up or down) will decrease. |
H3 | Receiving a spelling correction suggestion for an answer will increase the chance of a thumbs up and decrease the chance of a thumbs down. |
H4 | Questions created from more important sentences in the textbook will receive more thumbs up and fewer thumbs down. |
H5 | Questions with answer words that are more important in the textbook will receive more thumbs up and fewer thumbs down. |
H6 | Questions with noun and adjective answer words will receive more thumbs up and fewer thumbs down than verb and adverb answer words. |
H7 | Questions with rarer words as the answer will receive more thumbs up and fewer thumbs down than questions with more common words as the answer. |
H8 | Questions where the answer blank occurs early in the sentence will receive fewer thumbs up and more thumbs down. |
H9 | Questions that give elaborative feedback after an incorrect answer will receive more thumbs up and fewer thumbs down than questions that give only outcome feedback. |
H10 | Questions that have been reviewed by a human reviewer before inclusion will receive more thumbs up and fewer thumbs down than questions that did not have human review. |
Table 1 gives ten hypotheses about causal relationships affecting student rating behavior investigated in this work. Each hypothesis motivates a model variable that is intended to measure that relationship in the observed session data.
Hypotheses H1-H5 are reasonably self-evident (e.g., H1 and H3 are motivated by increased student satisfaction), while H6-H10 warrant elaboration.
H6 is motivated by the fact that textbook glossaries and indexes as well as most keyword extraction techniques are noun-centric, i.e., consisting primarily of nouns and noun phrases, and so nouns and adjectives might generally be perceived as more pertinent or helpful as answer words than other parts of speech.
The rationale for H7 is that rarer words can often be technical terms or jargon specific to the textbook’s subject domain, and hence a question with such an answer word may be perceived as more helpful, whereas a question with a more common word as the answer may be perceived as less helpful.
For H8, it has previously been observed that thumbs down are more common when the answer blank occurs in the first few words of the sentence [20]. A possible explanation is that if answering a FITB question is viewed as a language modeling prediction task, then when the blank occurs early in the sentence the information preceding it may not be enough to make a confident prediction. Prediction then relies more heavily on the rest of the question text after the blank, potentially increasing cognitive load due to the missing word and leading to a perception that the question is less helpful. By contrast, when a blank occurs late in the sentence, most or all of the information needed for prediction has already been read before the blank is encountered.
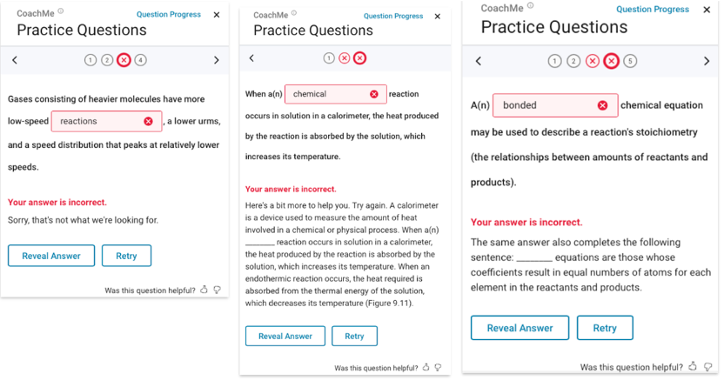
H9 concerns two types of elaborative feedback (called common answer feedback and context feedback, Figure 3), that are automatically generated with the question where possible to be given after an incorrect answer. When neither type of AG feedback can be generated, simple outcome (right/wrong) feedback is given. Both AG feedback types have been shown to be more effective than outcome feedback in increasing the number of student second attempts as well as correctness on the second attempt [26]; it is thus hypothesized that the AG feedback will contribute to increased student satisfaction. For details on the AG feedback types, see [26].
For H10, early in the CoachMe launch the AG questions included a human review pass by the AQG development team to check for common AQG quality issues that are not subject-matter related and do not require pedagogical expertise, such as errors with text extraction from the textbook and unresolved anaphoric references in the question stem. The manual review step was eliminated as scale increased due to the time and cost involved. It is expected that questions that have been manually reviewed should receive better ratings than those without a human review step.
Each hypothesis is operationalized using a variable from the session data in order to be included in the explanatory model. These variable definitions are given in Table 2.
Regression models applied to observational data are commonly used in explanatory modeling. As discussed by Shmueli [27], even though the regression model itself can only determine significant associations between the variables and outcome, the hypotheses motivating the selection of explanatory variables provide the rationale for causality. In this work, logistic regression is used to model the probability of whether a student will rate a question either thumbs up or thumbs down as a function of the explanatory variables.
Variable | Type | Definition |
H1_first_correct | categorical | 1 if student’s first answer is correct, 0 if not |
H2_cumulative_answered | integer | Total number of questions answered by the student as of the session |
H3_spelling_suggestion | categorical | 1 if student received a spelling suggestion during the session, 0 if not |
H4_sentence_textrank_rank | continuous | 0 (most important) to 1 (least important) rank of sentence in textbook chapter |
H5_answer_tf_idf_rank | continuous | 0 (most important) to 1 (least important) rank of answer word in textbook chapter |
H6_answer_pos | categorical | ADJ, ADV, NOUN, PROPN, VERB |
H7_answer_log_probability | continuous | Log probability estimate of answer word frequency |
H8_answer_location | integer | Location of answer blank in sentence, starting at 0 for first word |
H9_feedback | categorical | common_answer, context, outcome |
H10_reviewed | categorical | 1 if question was manually reviewed, 0 if not |
An important characteristic of the data set is that each student typically engaged with multiple practice questions, and similarly, each question was often answered by multiple students. The observations are not independent within these same-question and same-student clusters, which does not satisfy the assumptions of logistic regression. Such lack of independence is often addressed using a mixed effects regression model. For example, in work on regression modeling of question engagement, difficulty, and persistence [15][28], mixed effects logistic regression models were used with a random intercept per question and per student.
However, mixed effects models are generally much more computationally expensive to fit than ordinary fixed effects models. The data set in this work is much larger than those in our prior work, and in particular was too large to run mixed effects regression with random intercepts for both questions and students with the modeling software used. It was therefore necessary to assess whether a model with random intercepts for both question and student appeared critical to obtaining accurate results. Ignoring violations of the independence assumption can result in incorrect p values, though the regression coefficients can still be unbiased when dealing with clustered observations [29].
To this aim, mixed effects models were fit with random intercepts for questions only and for students only, respectively, together with an ordinary fixed effects model, and the results compared. All regressions were performed using R version 4.1.2 [30], with package glmmTMB version 1.1.8 [31] for mixed effects models. Across all three models, each explanatory variable’s coefficients were consistent in sign and magnitude (typically within less than a factor of 2, evidencing unbiased coefficient estimates). All variables were significant at p < .001 in all three models with the following exceptions: in the random intercept per question model, H6_answer_pos:NOUN p < .05 (relative to H6_answer_pos:ADJ baseline), H8_answer_location p < .01, H9_feedback:context p < .01 and H9_feedback:outcome p < .05, (H9_feedback:common_answer baseline); H10_reviewed p < .01 in the fixed effects model and not significant in either mixed effects model. Given this consistency, including random intercepts for both questions and students does not appear essential to obtain qualitatively correct modeling results. Therefore, to be conservative about effect significance, the mixed effects model with question random intercepts, which had the largest p values overall, was chosen as the explanatory model.
The R formula for the thumbs down explanatory model is:
glmmTMB(thumbs_down ~ H1_first_correct
+ H2_cumulative_answered
+ H3_spelling_suggestion
+ H4_sentence_textrank_rank
+ H5_answer_tf_idf_rank + H6_answer_pos
+ H7_answer_log_probability
+ H8_answer_location
+ H9_feedback + H10_reviewed
+ (1|question_id),
family=binomial(link=logit), data=df)
This shows that a mixed effects logistic regression model is fit using the glmmTMB function. The regression formula shows the outcome of whether a question was rated thumbs down modeled as a function of the ten explanatory variables (Table 2) with a random intercept per question to address lack of independence of question observations.
Results
Between the dates specified for data collection in the Methods section, there was a total of 5,214,211 student-question sessions included in the final data set. Each session creates a rating opportunity. Ratings were given in a total of 27,719 sessions, 17,285 with thumbs up and 10,434 with thumbs down, a rate of 3.31 thumbs up and 2.00 thumbs down per 1,000 sessions. Of the 432,930 students, 15,111 (3.49%) used the rating feature, and of the 809,848 questions, 22,844 (2.82%) were rated (either thumbs up or thumbs down).
As an exploratory data analysis preliminary to model building, Table 3 shows ratings per 1,000 sessions for the individual levels of the categorical explanatory variables. Differences across variable levels are evident, indicating that many of these variables are expected to be significant in the explanatory model given the numbers of observations involved.
Table 3 shows that the thumbs down rate is more sensitive to the explanatory variables than the thumbs up rate. The variation across categorical variable levels expressed as percentage difference (range divided by average) is 27%–118% for thumbs down versus 5%–22% for thumbs up. Furthermore, since ratings are optional for student users and thumbs down ratings indicate student dissatisfaction, as a practical concern we consider reducing thumbs down ratings more important than increasing thumbs up ratings. We therefore examine the thumbs down regression model first, which is shown in Table 4.
Variable | Level | Sessions | Thumbs Up | Thumbs Down |
H1_first_correct | 0 | 2,292,927 | 2.91 | 3.04 |
1 | 2,921,284 | 3.64 | 1.19 | |
H3_spelling_suggestion | 0 | 4,926,209 | 3.30 | 2.05 |
1 | 288,002 | 3.59 | 1.12 | |
H6_answer_pos | ADJ | 1,509,164 | 3.38 | 1.76 |
ADV | 52,541 | 2.70 | 5.23 | |
NOUN | 3,207,347 | 3.35 | 1.96 | |
PROPN | 247,666 | 3.01 | 2.23 | |
VERB | 197,493 | 2.86 | 3.43 | |
H9_feedback | common_answer | 3,299,873 | 3.28 | 1.68 |
context | 477,814 | 3.45 | 2.55 | |
outcome | 1,436,524 | 3.35 | 2.55 | |
H10_reviewed | 0 | 4,915,386 | 3.34 | 2.03 |
1 | 298,825 | 2.86 | 1.54 |
Feature | Estimate | p |
H1_first_correct | -0.822 | < 2e-16 *** |
H2_cumulative_answered | -0.00591 | < 2e-16 *** |
H3_spelling_suggestion | -0.466 | 1.32e-12 *** |
H4_sentence_textrank_rank | 0.866 | 2.03e-09 *** |
H5_answer_tf_idf_rank | 0.492 | 1.19e-04 *** |
H6_answer_pos:ADV | 0.890 | 8.57e-06 *** |
H6_answer_pos:NOUN | 0.150 | 2.11e-02 * |
H6_answer_pos:PROPN | 0.484 | 2.39e-04 *** |
H6_answer_pos:VERB | 0.637 | 8.72e-07 *** |
H7_answer_log_probability | 0.0667 | 6.75e-06 *** |
H8_answer_location | -0.0103 | 2.24e-03 ** |
H9_feedback:context | 0.268 | 3.48e-03 ** |
H9_feedback:outcome | 0.163 | 1.69e-02 * |
H10_reviewed | -0.159 | 2.44e-01 |
Though the hypotheses in Table 1 provide the justifications for the explanatory variables, model selection techniques can be used to estimate their relative importance. A common model selection approach is to use a probabilistic metric to assign a score that weighs a model’s goodness-of-fit against its complexity. For explanatory models, the Bayesian information criterion (BIC) is often used [27]. Variable importance was assessed using the initial step of a forward selection stepwise regression process, as follows: for each explanatory variable, a fixed effects model was fit including only that variable and an intercept, with its BIC value compared to that of an intercept-only model. Lower BIC scores are better, and in a forward selection process, the variable giving the greatest decrease in BIC would be selected for the model. Again, however, forward selection was not used to select the variables in the explanatory model; the technique is merely used here to obtain an estimated ranking of the variables by importance. The results are given in Table 5, with variables ordered by decrease in BIC relative to an intercept-only model.
Feature | BIC |
intercept-only | 150537.9 |
H1_first_correct | -2190.2 |
H2_cumulative_answered | -1187.6 |
H5_answer_tf_idf_rank | -512.2 |
H4_sentence_textrank_rank | -480.4 |
H9_feedback | -414.8 |
H6_answer_pos | -351.4 |
H3_spelling_suggestion | -125.1 |
H7_answer_log_probability | -100.1 |
H8_answer_location | -75.0 |
H10_reviewed | -20.6 |
The regression model results for thumbs up ratings are given in Table 6. In contrast with the thumbs down model in Table 4, very few variables were statistically significant. Thus, a variable importance analysis was not performed as for the thumbs down model.
Feature | Estimate | p |
H1_first_correct | 0.275 | < 2e-16 *** |
H2_cumulative_answered | -0.000412 | .00682 ** |
H3_spelling_suggestion | 0.0473 | .203 |
H4_sentence_textrank_rank | 0.0439 | .690 |
H5_answer_tf_idf_rank | -0.137 | .221 |
H6_answer_pos:ADV | -0.230 | .321 |
H6_answer_pos:NOUN | -0.0213 | .642 |
H6_answer_pos:PROPN | -0.152 | .137 |
H6_answer_pos:VERB | -0.159 | .180 |
H7_answer_log_probability | -0.0328 | .00108 ** |
H8_answer_location | -0.00265 | .267 |
H9_feedback:context | 0.118 | .0951 |
H9_feedback:outcome | 0.0130 | .803 |
H10_reviewed | -0.150 | .116 |
Discussion
The main question is which of the hypotheses in Table 1 are supported by the explanatory models created from the data. For the thumbs down model, all explanatory variables except H10_reviewed were statistically significant. For each significant variable, the sign of the coefficient estimate, or relative magnitudes of the estimates for categorical variables with more than two levels, determine whether the corresponding hypothesis was supported. Examples: H1_first_correct has a negative coefficient, meaning that a thumbs down is less likely when the student’s first attempt is correct, so H1 is supported. H6_answer_pos has the largest coefficients for the ADV and VERB levels, so ADV and VERB answer words are the most likely to receive thumbs down, so H6 is supported. Overall, H1-H8 are supported by the model. Given the explanatory modeling framework followed, this is evidence that the relationships in these hypotheses are causal [27].
H9 is only partially supported, because outcome feedback is statistically more likely to receive a thumbs down than common answer feedback, but not more likely than context feedback. This could be because even though context feedback has been shown to be more effective than outcome feedback, it also takes significantly longer to read [24], which might reduce student satisfaction. Finally, H10, that manually reviewed questions will receive fewer thumbs down, was not supported because H10_reviewed was not statistically significant.
For thumbs up ratings, only three variables, H1_first_correct, H2_cumulative_answered, and H7_answer_log_probability were significant. For all three, the direction of the effect was as predicted by the corresponding hypothesis, and thus hypotheses H1, H2, and H7 were supported. The other hypotheses were not supported for thumbs up because their corresponding variables were not significant.
An interesting finding was that human manual review of the AG questions mattered less to student ratings than anticipated. H10_reviewed was not significant in either the thumbs down or thumbs up model, and was the only explanatory variable not significant in the thumbs down model. However, this finding lends support to the decision of discontinuing the manual review step done initially in the CoachMe release, as manual review did not have a significant impact on reducing thumbs down ratings.
For the three variables that are significant in both models, the relative effect sizes can be seen by comparing the magnitudes of their model coefficients. In all three cases, the thumbs down coefficient is larger, by a factor of 2.0 to 14.3. The thumbs down model coefficients also have smaller p values.
An interesting overall finding is therefore that thumbs down ratings are more clearly related to the explanatory variables, and thus the hypotheses, than thumbs up ratings. This is useful for improving the AQG method to reduce the number of questions generated that are likely to receive thumbs down from students.
It is interesting to note that the variable importance assessment for the thumbs down model (Table 5) reveals that the two most important explanatory variables, H1_first_correct and H2_cumulative_answered, relate to aspects of student experience in addition to the characteristics of the question itself. Of the variables intrinsic to the AQG process, the three most important were H5_answer_tf_idf_rank (answer importance), H4_sentence_textrank_rank (sentence importance), and H9_feedback. Note in particular that these variables are important after controlling for the effects of the “experience-related” variables. It is qualitatively reasonable that the importance of the question’s answer and sentence should matter, as well as the type of feedback given upon an incorrect answer. The least important explanatory variable was H10_reviewed. Again, an importance analysis was not performed for the thumbs up explanatory model because few variables were statistically significant in that model.
It is informative to look at some illustrative examples of questions that are more/less likely to receive thumbs down ratings according to certain explanatory variables and the hypotheses underlying them. H6, the hypothesis that questions with verb and adverb answer words will receive more thumbs down, was supported. An example of a verb and an adverb question in the data set receiving multiple thumbs down are (answer word underlined):
Verb answer word:
A program that calculates the distance between two cities might use the variable name “distance” to represent that value in memory.
Adverb answer word:
Rewarding rats for successfully navigating to the end of a maze provides researchers with an opportunity to objectively measure learning.
In these questions, the answer words “calculates” and “successfully” do not appear to convey significant useful information in the sentence, and several of the nouns or adjectives would appear to be a better answer choice.
The following are questions made from less important and more important sentences, which was confirmed to make a difference to thumbs down rating probability through H4:
Less important question sentence:
The fish flavor will get into the frying oil and affect the flavor of chicken, mozzarella sticks, vegetables, and French fries.
More important question sentence:
Experts have defined patient-centered interviewing as “following the patient's lead to understand their thoughts, ideas, concerns and requests, without adding additional information from the clinician’s perspective.”
To contrast the two, the less important sentence seems more like an example than a domain fact that needs to be learned, whereas the more important sentence gives a definition of what is likely a content key term.
The following two questions illustrate H7, that rarer answer words are less likely to receive thumbs down:
More common answer word:
Many health conditions increase the risk of mental disorders.
More rare answer word:
Intuitional Epistemology or Intuitionalism: Humans know by simply intuiting, or penetrating the depths of their inner sense of self and being able to discern what is true.
Here, the rarer answer word “epistemology” appears to be more subject domain-specific than the more common answer word “risk”, and thus may be perceived as more helpful.
Some limitations of the present work should be noted. A modeling limitation is that random intercepts were not able to be included for both questions and students in the mixed effects models to account for repeated observations; only random intercepts for questions were able to be included. However, this was mitigated by the analysis described in the Methods section that suggests the results would not be materially affected if both types of random effects were included. Another potential limitation is that the majority of students in the data set self-selected to engage with the questions (a small percentage of the data is from courses where questions were assigned, changing engagement patterns [17]). Within this largely voluntary population of students answering questions, all student ratings were also voluntary. While the explanatory model has shown significant relationships between the analyzed variables and ratings, we also acknowledge there could be additional motivational hypotheses around why students rated that remain unknown, i.e., did they like/dislike the content, perceived helpfulness, or the overall experience? Students who did choose to rate questions only rated an average of 1.83 questions each, rather than consistently rating all questions answered. An interesting future investigation would be to compare the results herein with a class of students who are asked to rate every question.
Conclusion
The novel data set used in this investigation included microlevel clickstream interactions gathered by an e-reader platform, syntactic and semantic data derived from natural language processing, and student perception data gathered from thumbs up/down ratings—all used to learn more about the automatically generated questions provided as practice in online textbooks. Prior research on AG questions used similar microlevel data to analyze performance metrics, but the student rating data provided an interesting and new opportunity to learn about question features from a new source—the learners themselves.
The explanatory modeling approach taken in this work enabled discovery of causal relationships between question features and student rating behavior. This has practical implications for improving the AQG method in future work. By incorporating knowledge about the causes of thumbs down ratings during AQG, the number of questions generated that are likely to be given thumbs down can be reduced. The modeling results indicate that focusing on the importance of the answer word, the importance of the sentence, and the answer word POS will yield the greatest improvements in reducing the thumbs down rate.
The data set from this work is available at our open data repository [32].
Acknowledgment
We are grateful to Michelle Clark for assistance in preparing this manuscript.
References
- Goldstein, P. J., & Katz, R. N. (2005). Academic analytics: The uses of management information and technology in higher education. Educause. https://library.educause.edu/-/media/files/library/2005/12/ers0508w-pdf.pdf
- Baker, R. S., & Inventado, P. S. (2016). Educational data mining and learning analytics. Emergence and Innovation. In Digital Learning: Foundations and Applications, 1–15. https://doi.org/10.15215/aupress/9781771991490.01
- Reardon, S. F., & Stuart, E. A. (2019). Education research in a new data environment: Special issue introduction. In Journal of Research on Educational Effectiveness. Routledge. https://doi.org/10.1080/19345747.2019.1685339
- Fischer, C., Pardos, Z. A., Baker, R. S., Williams, J. J., Smyth, P., Yu, R., Slater, S., Baker, R., & Warschauer, M. (2020). Mining big data in education: Affordances and challenges. In Review of Research in Education, 44(1), 130–160. https://doi.org/10.3102/0091732X20903304
- Van Campenhout, R., Jerome, B., & Johnson, B. G. (2023). Engaging in student-centered educational data science through learning engineering. In A. Peña-Ayala (Ed.), Educational Data Science: Essentials, Approaches, and Tendencies, 1-40. Big Data Management. Springer, Singapore. https://doi.org/10.1007/978-981-99-0026-8_1
- McFarland, D. A., Khanna, S., Domingue, B. W., & Pardos, Z. A. (2021). Education data science: Past, present, future. In AERA Open, 7(1), 1–12. https://doi.org/10.1177/23328584211052055
- Black, P., & William, D. (2010). Inside the black box: raising standards through classroom assessment. In Phi Delta Kappan, 92(1), 81–90. https://doi.org/10.1177/003172171009200119
- Dunlosky, J., Rawson, K., Marsh, E., Nathan, M., & Willingham, D. (2013). Improving students’ learning with effective learning techniques: promising directions from cognitive and educational psychology. In Psychological Science in the Public Interest, 14(1), 4-58. https://doi.org/10.1177/1529100612453266
- Koedinger, K., Kim, J., Jia, J., McLaughlin, E., & Bier, N. (2015). Learning is not a spectator sport: Doing is better than watching for learning from a MOOC. In Proceedings of the Second ACM Conference on Learning@Scale, 111–120. https://doi.org/10.1145/2724660.2724681
- Koedinger, K. R., McLaughlin, E. A., Jia, J. Z., & Bier, N. L. (2016). Is the doer effect a causal relationship? How can we tell and why it's important. In Proceedings of the Sixth International Conference on Learning Analytics & Knowledge, 388–397. http://dx.doi.org/10.1145/2883851.2883957
- Van Campenhout, R., Johnson, B. G., & Olsen, J. A. (2021). The doer effect: Replicating findings that doing causes learning. Presented at eLmL 2021: The Thirteenth International Conference on Mobile, Hybrid, and On-line Learning, 1–6. https://www.thinkmind.org/index.php?view=article&articleid=elml_2021_1_10_58001
- Van Campenhout, R., Johnson, B. G., & Olsen, J. A. (2022). The doer effect: Replication and comparison of correlational and causal analyses of learning. In International Journal on Advances in Systems and Measurements, 48-59. https://www.iariajournals.org/systems_and_measurements/sysmea_v15_n12_2022_paged.pdf
- Van Campenhout, R., Jerome, B., & Johnson, B. G. (2023). The doer effect at scale: Investigating correlation and causation across seven courses. In LAK23: 13th International Learning Analytics and Knowledge Conference (LAK 2023), 357-365. https://doi.org/10.1145/3576050.3576103
- Kurdi, G., Leo, J., Parsia, B., Sattler, U., & Al-Emari, S. (2020). A systematic review of automatic question generation for educational purposes. In International Journal of Artificial Intelligence in Education, 30(1), 121–204. https://doi.org/10.1007/s40593-019-00186-y
- Van Campenhout, R., Dittel, J. S., Jerome, B., & Johnson, B. G. (2021). Transforming textbooks into learning by doing environments: An evaluation of textbook-based automatic question generation. In Third Workshop on Intelligent Textbooks at the 22nd International Conference on Artificial Intelligence in Education CEUR Workshop Proceedings, 1–12. https://ceur-ws.org/Vol-2895/paper06.pdf
- Johnson, B. G., Dittel, J. S., Van Campenhout, R., & Jerome, B. (2022). Discrimination of automatically generated questions used as formative practice. In Proceedings of the Ninth ACM Conference on Learning@Scale, 325-329. https://doi.org/10.1145/3491140.3528323
- Van Campenhout, R., Clark, M., Jerome, B., Dittel, J. S., & Johnson, B. G. (2023). Advancing intelligent textbooks with automatically generated practice: A large-scale analysis of student data. In 5th Workshop on Intelligent Textbooks. The 24th International Conference on Artificial Intelligence in Education, 15-28. https://intextbooks.science.uu.nl/workshop2023/files/itb23_s1p2.pdf
- Van Campenhout, R., Clark, M., Dittel, J. S., Brown, N., Benton, R., & Johnson, B. G. (2023). Exploring student persistence with automatically generated practice using interaction patterns. In 2023 International Conference on Software, Telecommunications and Computer Networks (SoftCOM), 1–6. https://doi.org/10.23919/SoftCOM58365.2023.10271578
- Jerome, B., Van Campenhout, R., Dittel, J. S., Benton, R., Greenberg, S., & Johnson, B. G. (2022). The Content Improvement Service: An adaptive system for continuous improvement at scale. In Meiselwitz, et al., Interaction in New Media, Learning and Games. HCII 2022. Lecture Notes in Computer Science, vol 13517, 286–296. Springer, Cham. https://doi.org/10.1007/978-3-031-22131-6_22
- Jerome, B., Van Campenhout, R., Dittel, J. S., Benton, R., & Johnson, B. G. (2023). Iterative improvement of automatically generated practice with the Content Improvement Service. In R. Sottilare & J. Schwarz (Eds.), Adaptive Instructional Systems. HCII 2023. Lecture Notes in Computer Science, 312-324. Springer, Cham. https://doi.org/10.1007/978-3-031-34735-1_22
- Honnibal, M., Montani, I., Van Landeghem, S., & Boyd, A. (2020). spaCy: Industrial-strength natural language processing in Python. https://doi.org/10.5281/zenodo.1212303
- Mihalcea, R., & Tarau, P. (2004). TextRank: Bringing order into text. In Proceedings of the 2004 Conference on Empirical Methods in Natural Language Processing, 404-411. https://aclanthology.org/W04-3252
- Mikolov, T., Chen, K., Corrado, G., & Dean, J. (2013). Efficient estimation of word representations in vector space. In International Conference on Learning Representations (ICLR) 2013. Workshop proceedings. https://doi.org/10.48550/arXiv.1301.3781
- Book Industry Study Group (2022). Complete BISAC subject headings list. https://www.bisg.org/complete-bisac-subject-headings-list
- Sainani, K. L. (2014). Explanatory versus predictive modeling. In PM&R, 6(9), 841–844. https://doi.org/10.1016/j.pmrj.2014.08.941
- Van Campenhout, R., Kimball, M., Clark, M., Dittel, J. S., Jerome, B., & Johnson, B. G. (2024). An investigation of automatically generated feedback on student behavior and learning. Proceedings of LAK24: 14th International Learning Analytics and Knowledge Conference. https://doi.org/10.1145/3636555.3636901
- Shmueli, G. (2010). To explain or to predict? In Statistical Science, 25(3), 289–310. https://doi.org/10.1214/10-STS330
- Van Campenhout, R., Brown, N., Jerome, B., Dittel, J. S., & Johnson, B. G. (2021). Toward effective courseware at scale: Investigating automatically generated questions as formative practice. In L@S '21: Proceedings of the Eighth ACM Conference on Learning @ Scale, 295–298. https://doi.org/10.1145/3430895.3460162
- Liang, K.-Y., & Zeger, S. L. (1993). Regression analysis for correlated data. In Annual Review of Public Health, 14(1): 43–68. https://doi.org/10.1146/annurev.pu.14.050193.000355
- R Core Team (2021). R: A language and environment for statistical computing (Version 4.1.2) [Computer software]. R Foundation for Statistical Computing, Vienna, Austria. https://www.R-project.org/
- Brooks, M. E., Kristensen, K., Benthem, K. J., Magnusson, A., Berg, C. W., Nielsen, A., Skaug, H. J., Maechler, M., & Bolker, B. M. (2017). glmmTMB balances speed and flexibility among packages for zero-inflated generalized linear mixed modeling. In The R Journal, 9(2), 378–400. https://doi.org/10.32614/RJ-2017-066
- VitalSource Supplemental Data Repository. https://github.com/vitalsource/data