ABSTRACT
In a number of settings risk prediction models are being used to predict distal future outcomes for individuals, including high school risk prediction. We propose a new method, non-overlapping-leave-future-out (NOLFO) validation, to be used in settings with long delays between feature and outcome observation and where there are overlapping cohorts. Using NOLFO validation prevents temporal information leakage between the training and test sets. We apply this method to high school risk prediction, using data from a large-scale platform, and find that models are able to maintain their accuracy over long periods of time when tested on fully unseen data in most cases. These findings imply that organizations may be able to reduce the frequency of model re-training without sacrificing accuracy. In contexts such as long-term at-risk prediction with overlapping cohorts and long delays between feature and outcome observation, NOLFO is an important tool for ensuring that estimated model accuracy is representative of what can be expected in implementation.
Keywords
INTRODUCTION
Risk prediction models are used across a number of settings to predict the future outcomes of individuals, such as student graduation and secondary enrollment [4, 33], prison recidivism [13], and health outcomes [32]. This paper examines the practice of model validation on time-series data where there is a long delay between predictive features and observed outcome and where cohorts overlap - meaning that training features for cohort i+1 are observed before outcomes are observed for cohort i. The delay between predictions and outcomes - often on the scale of years - for these models entails that validation is necessarily performed on old data, and the overlapping nature of the cohorts cause standard leave-future-out validation practices to result in potential temporal information leakage. Furthermore, in production settings, regular validation and refinement of a functioning model may be seen as risky to privacy and costly, and therefore is not prioritized. As a result, some of these models have now been in use for multiple years without ongoing validation of their accuracy (see discussion in [17]), although other models are annually re-fit and tested [27]. Within this paper, we investigate these issues in the context of high school graduation prediction. We present a Non-Overlapping Leave-Future-Out (NOLFO) validation method that we propose should be used when developing prediction models in contexts with long delays between predictions and outcomes and overlapping cohorts.
In this context, a number of questions arise for high school graduation prediction models. How stable are machine-learned graduation prediction models over time? Do prediction models need to be re-trained annually (or periodically), or can the same model be used for many years without updates? For education-related models, do risk predictions remain stable even if the underlying context shifts gradually (e.g., from policy changes addressing attendance, which occur over a period of many years in different districts) or abruptly (e.g., from Covid-19 shutdowns)? Risk prediction models are being used at large scale in American education settings, with national vendors [8, 14] and US states 17, 28] providing models to school districts. Increasingly, this type of model is used in other countries as well [24, 31]. As the field of machine-learned education graduation prediction models matures and their use becomes increasingly widespread, these questions have important implications for production use. Annual refitting of models is expensive and model training is more privacy invasive than model scoring, since it requires the long-term retention of personally identifying information. If models do not need to be retrained annually, less data intensive practices can be adopted to better protect student privacy and reduce operational expenses.
In other contexts, model degradation over time (aka “detector rot” -- [23]) has been found to be a potentially serious problem. For example, in inferring gaming the system behavior in an online tutoring system, researchers found that simpler decision tree models maintained their performance better over time than more advanced models like XGBoost, even though the more advanced models performed better within the time period they were trained in [23]. Other research investigating detector rot in Bayesian Knowledge Tracing models found that they are generally stable across years, but their performance is subject to degradation in the face of systemic shifts in learner behavior [21]. However, no research to date has examined the scope of detector rot for K-12 student dropout prediction models. Prior research has investigated concerns about model generalizability across contexts [9, 4], finding that some models can safely generalize between school districts; this work extends that type of analysis to generalizability across time periods.
As in other domains, the models used in practice for graduation prediction vary considerably in complexity. Perhaps the most widely-used model, the ‘Chicago’ model [1] for student dropout prediction, uses research based thresholds to assess risk according to static and relatively transparent algorithms. By contrast, machine-learned models used by several vendors like Random Forests, in contrast, typically rely upon highly complex and opaque rules that have been found to boost predictive accuracy [4], at least at the time of training. As noted above, [23] found that more sophisticated models appear to degrade more over time, due to overfitting of the data. In high school graduation prediction, do these more complex algorithms maintain their accuracy over time, or are they capturing temporally sensitive relationships between variables that degrade?
This model lag is potentially consequential if there are changes in the relationships between predictor variables and outcomes over time. There are both general drifts in features over time, for example the long term upwards trend in GPAs [26] and sudden changes such as the shutdowns and shifts (in graduation policy, among other changes) provoked by the COVID-19 pandemic. Absenteeism has increased substantially since the pandemic [12], standardized test scores have decreased in many districts [18], and there are reports of increased student behavioral issues [11, 30]. Models can be resilient to shifts in feature distributions if the relationship between the feature and potential outcomes persists. But are they resilient to these types of changes? It is unclear.
Time Delays in Model Validation
The most common intervention point in U.S. schools for graduation is 9th grade [15]. The inherent time delay between observing a 9th grade student and observing their graduation outcome makes these models require many years of data. Figure 1 presents how data availability occurs over time. We have to go back four years before the present to find the first cohort of ninth graders that we can observe graduation outcomes for (excluding the small number of students who graduate early). In other words, to make graduation predictions about 9th grade students in the 2023 school year, we must use 9th grade training data from no later than the 2019 school year. We can include more recent ninth grade student cohorts (e.g. from the 2020 through 2022 school years), but for those cohorts we would primarily observe only early dropout outcomes and not graduation outcomes. This figure also demonstrates the overlapping nature of the cohorts. We observe four cohorts of 9th grade features (in 2015, 2016, 2017 and 2018) before observing the 2015 cohort’s graduation outcome in 2018.
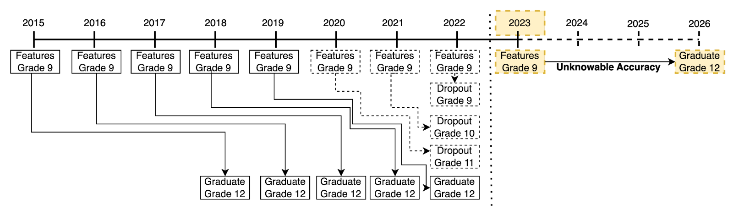
As figure 1 shows, by the nature of predicting K-12 graduation, there will always be a delay between a model’s training data and the time period when it is put in use. We now consider implications for model validation. We care most about knowing the accuracy of predictions that are made for current ninth grade students, who have yet to graduate from high school. Without the ability to see the future, this data is inaccessible. Standard validation methods rely on either cross-validation or out-of-sample validation [7]. Cross validation based on a test-train split strategy that randomly holds out a subset of students assumes that data is i.i.d. (after accounting for within-student variance by splitting at that level) and does not account for the possibility of feature drift or detector rot. It is likely to overstate model accuracy in the 9th grade graduation prediction context. Out-of-sample validation, by contrast, uses data from one year to train and data from a separate, future, year to test model performance.
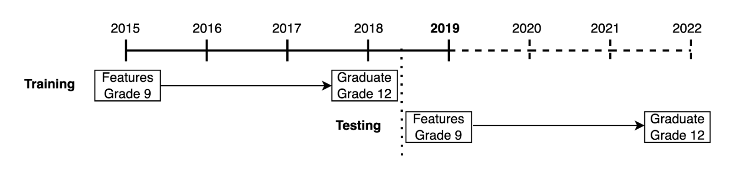
A Non-Overlapping-Leave-Future-Out (NOLFO) validation requires that the feature data used to test the model occurs after the outcome data used to train the model. Because of the four year delay between observing 9th grade features and 12th grade outcomes, the testing cohort’s features must be observed at least four years after the training cohort. In figure 2, we illustrate a simplified model for an out-of-sample testing strategy that shows training a model for the 2015 cohort of 9th grade students and testing on the NOLFO 2019 cohort of 9th grade students. In order to have a truly unseen test set with no overlap in years and no possibility of information leakage, we must dramatically reduce the amount of data available for model training. To predict outcomes for the 2019 cohort of 9th graders, we cannot use graduation outcomes from after 2018 and are thus limited to training on only the 2015 – and earlier – cohorts of ninth grade students.
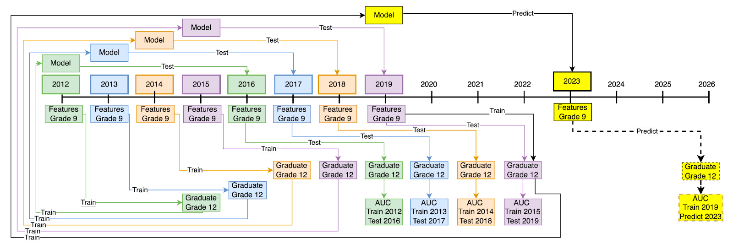
By taking models trained earlier and applying them to subsequent cohorts – in a ‘rolling-origin evaluation’ [36] – we can assess how well models can be expected to perform in later years. In figure 3, we show a model for a rolling origin evaluation with four training cohorts and four NOLFO validation cohorts. Note that in this form of validation, the four estimated AUC values (trained on 2012, 2013, 2014, 2015 9th grade data and tested respectively on 2016, 2017, 2018, 2019 graduation data) are in practice an estimate of the forecasted AUC of predictions made for 2023 9th graders based on a model trained with 2019 9th grade feature data.
In practice, instead of training successive single year models, providers of risk prediction models aggregate together data from many training years. Such a model can still be tested with a full-future-leave-out strategy so long as the testing data occurs after the last collected training outcome.
In evaluating high school risk prediction models, the published literature either does not reference an explicit time based leave-future-out validation strategy (see e.g. [8, 22,34]) or uses leave-future-out data from consecutive years but does not enforce a non-overlapping requirement with testing data occurring strictly after training outcomes (see e.g. [35, 17]). To be fair, this is a harder challenge in high school graduation prediction than in other modeling tasks where a single year is sufficient time to observe the outcome of interest (e.g. [6]). To predict completely non-overlapping graduation outcomes for 9th grade students, it requires 8 years of data to confidently draw conclusions about a 4 year outcome of interest. These data requirements change depending on the grade level of the students we want to make predictions for; when predicting outcomes for 12th grade students there is only a single year of lag, while prediction models for 1st grade students have 12 years of lag thus requiring 24 years of data to do a full out of sample validation!
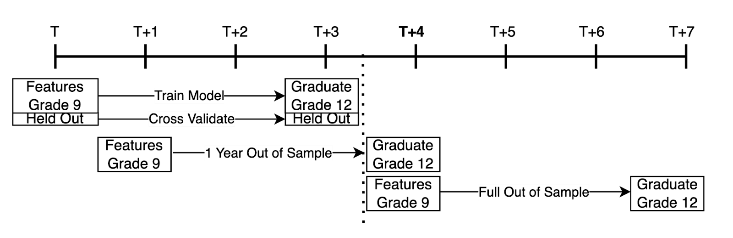
In summary, there are three potential validation mechanisms for graduation prediction models, cross-validation, one-year-leave-future-out validation, and non-overlapping-leave-future-out validation (see figure 4). In this paper we use NOLFO validation to determine the extent to which graduation prediction models suffer from detector rot, and whether annual retraining of models is strictly necessary. We present first a rolling NOLFO analysis of successive single-year-trained 9th grade models. We then present a series of analyses where we train a model in the initial time period and evaluate its performance over a long series of years. This analysis allows us to compare validity measures in the training year with cross validation, in the immediate years following training with proximal future hold out, and in increasingly distal non-overlapping time periods. We run the NOLFO validation tests for 9th grade models trained on a large corpus of data, 9th grade models trained on data from four representative school districts, and for grades 6 through 12.
data
Context
The REDACTED platform is a widely used commercial platform for predicting student graduation and post-secondary enrollment risk. The system uses historical student education data to predict outcomes [9] and presents that information in an insights driven interface that connects with an intervention management platform [14]. Predictor variables were selected using a theory-driven approach and cover general coursework, assessment scores, attendance, and behavior incidents [9]. Model accuracy was validated using a contemporaneous test-train split method at the student level [9, 10].
Data Sample
In this analysis there are over 3.4 million student-year records from approximately 740,000 unique students in grades 6 through 12. This data was obtained from the 2005-06 to 2022-23 school years. The data comes from 76 school districts from all major regions of the United States, though not all districts are represented in all years. There is a maximum of 62 and a minimum of 16 districts represented in any given year. The average graduation rate over the study period in these school districts is 90.4% compared to the national average graduation rate of 87% in 2019-20 [25].
Algorithms Assessed
In this paper we test a sample of different machine learning models for high school graduation prediction that have been proposed by researchers in recent work including: logistic regression [2, 35, 20], random forest model [9, 20], the “XGBoost” extreme gradient boosting algorithm [8], a Support Vector Machine [20, 34, 35] and a decision tree [20, 24]. We use the feature set developed for the model in [9]. In all cases, models were implemented using default hyper-parameter options.
Analysis of Detector Rot
As discussed above, we first present a rolling NOLFO analysis of successive single-year-trained 9th grade models. We then present a series of analyses where we train a model in the initial time period and evaluate its performance over a long series of years. The rolling analysis allows us to assess whether models trained on consecutive cohorts have consistent NOLFO performance. While the later analyses are more consistent with real-world production use of machine learning models.
We run the NOLFO validation tests for 9th grade models trained on a large corpus of data (a nationwide sample of 76 school districts using the early warning system), 9th grade models trained on data from four representative school districts, and for grades 6 through 12. Within these analyses, we select 9th grade as a grade of particular emphasis based on the much higher frequency of interventions given at this grade level than other grade levels [15]. For in-depth district-level analyses, we select four of the largest districts that had at least 9 years of data available to train and test models, and which were generally representative of the demographic and regional variance present within the full data set.
We assess model accuracy using AUC ROC [5]. Although no one metric captures all aspects of a model’s quality [29] and in particular AUC ROC is not informative about uses of models involving single decision cut-points [19], AUC ROC is a highly appropriate metric for the use this model is put to in the real world, where teachers and school leaders are presented with students’ risk levels rather than a single binary recommendation [20]. Furthermore, AUC ROC is comparable between different data sets [5] and is more robust to class imbalance than other metrics [16].
REsults
9th Grade Rolling-Origin Analysis
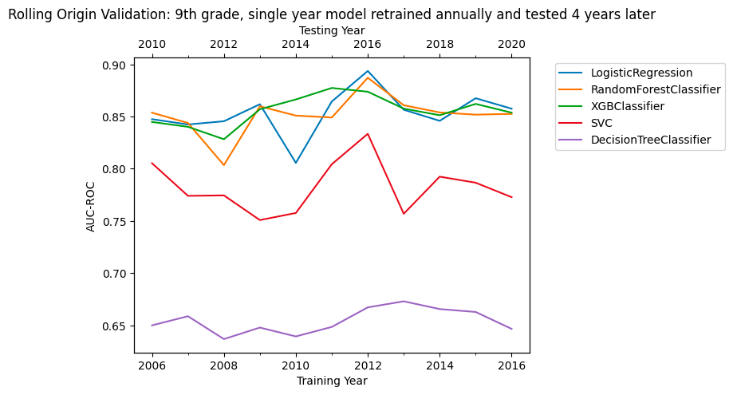
We initially examine predictions for 9th grade students. We begin with a ‘rolling-origin validation' [36] that trains a model on a single cohort of 9th grade students and examines its accuracy for the four year later NOLFO 9th grade cohort (i.e. the first cohort that could have used that model). The purpose of this analysis is to ascertain whether single-year trained graduation prediction models have both high and consistent predictive accuracy across cohorts when tested with the required amount of lag between training and prediction. Results are presented in figure 5. We see that the XGBoost, Logistic Regression and Random Forest perform very similarly to each other, and have AUC values that vary between 0.8 and 0.9 over time. The SVM and single decision tree are substantially less accurate.
While informative regarding the general issue of time delay between training and prediction, this rolling-origin test does not closely mirror how high school graduation models are implemented in practice.
9th Grade Model Degradation
We now turn to an analysis that is closer to real-world use conditions. First, we train and validate another single year 9th grade model, this time using data from 2006 and a 70/30 test-train split. We then re-train that same model (e.g. same features and same hyperparameters) using all available data from 2006 and predict outcomes for 9th graders in the 2007 through 2020 cohorts and measure the AUC for each cohort. By doing this, we are now testing whether the 2006 model decays over a longer time period. The results are presented in figure 6.
In figure 6, AUC is measured in three ways. First, the leftmost and hollow point represents the same year AUC from the 70% trained model and 30% holdout set. The next three solid points to the left of the dashed line represent AUC values from the full 2006 model in the overlapping years that come after the training year but before the training outcomes were observed. The solid points to the right of the dashed line indicate AUC values for NOLFO years: years that are unseen in training, and occur after the outcome data collection delay. These are the points of most relevance for analyzing detector rot.
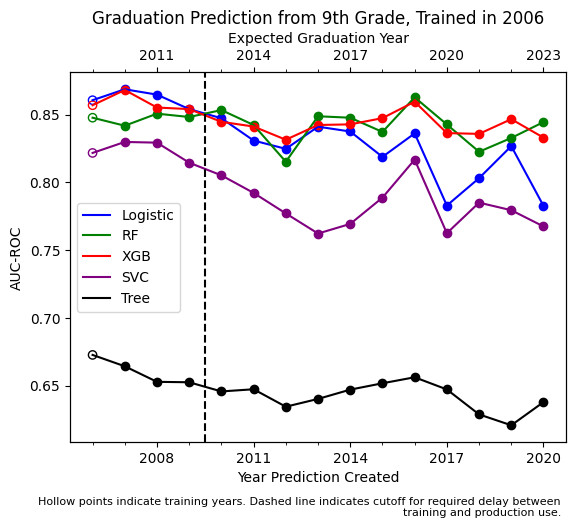
We see that three models have similar initial AUC ROC values (0.85 for the Random Forest, and 0.86 for the Logistic and XGB models). Performance for these three models is somewhat noisy over time, trending between 0.87 and 0.80. In the final time period, 14 years and a global pandemic after the models were initially trained, the Random Forest and XGB models still have an AUC values of 0.84 and 0.83, while the Logistic has degraded only mildly, to 0.78. This constancy of performance for the Random Forest and XGB model is in contrast to findings of substantial model rot for these algorithms in other contexts [23]. The SVM model performs less well and shows a similar amount of degradation. The single decision tree performs much more poorly with an AUC around 0.65, it too degrades somewhat.
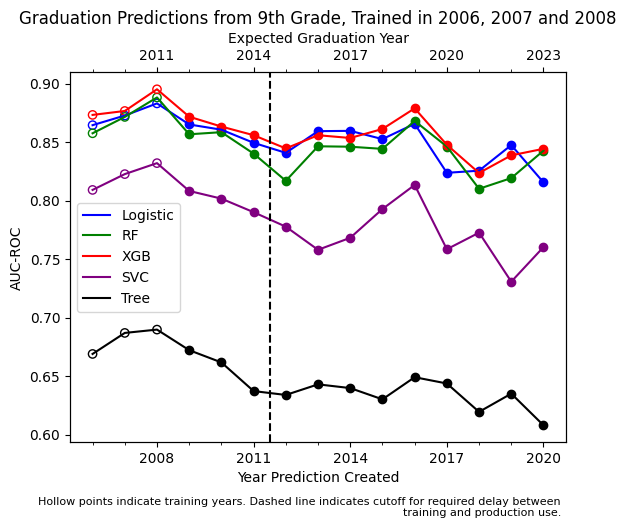
Next we test pooling data from three consecutive cohorts of 9th graders to train the models. In production settings, multiple years of data are used to train models instead of data from a single cohort. This analysis restricts the amount of non-overlapping years available for validation, but gives a more realistically trained model and reduces the risk of single-year overfitting in model training. Note that now the dashed line has now been pushed two more years further right, with 2012 being the first non-overlapping prediction year. We see in figure 7 that performance is somewhat more stable than with a single year of training data, and is within a similar range of 0.88 at training time degrading to a minimum near 0.80 for the Random Forest and XGB models. Logistic regression bottoms out slightly higher, at 0.82. The SVM and Decision Tree models follow similar patterns of lower (and much lower) performance as before.
Analysis of Four Districts
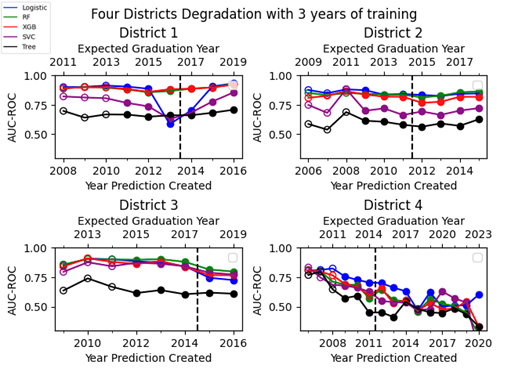
In the prior analysis we pooled together data from 76 disparate US school districts. We now assess NOLFO validation for a selection of four school districts, discussed above. We run this analysis to test whether the stability found in a large, multi-district sample also applies in smaller contexts. Related work has found that classifier performance can vary substantially across school districts [20]. Three of the districts’ models have initial AUC values for the Random Forest, XGB and Logistic models between 0.8 and 0.9, while district four shows rapidly degrading AUC, even during the three training years. Results are presented in figure 8.
Degradation by Grade Level
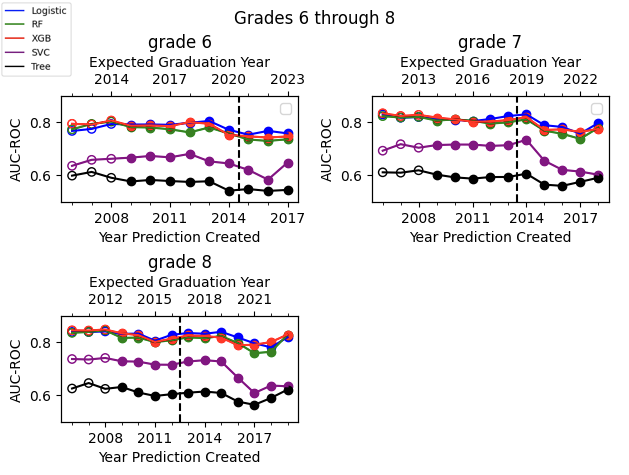
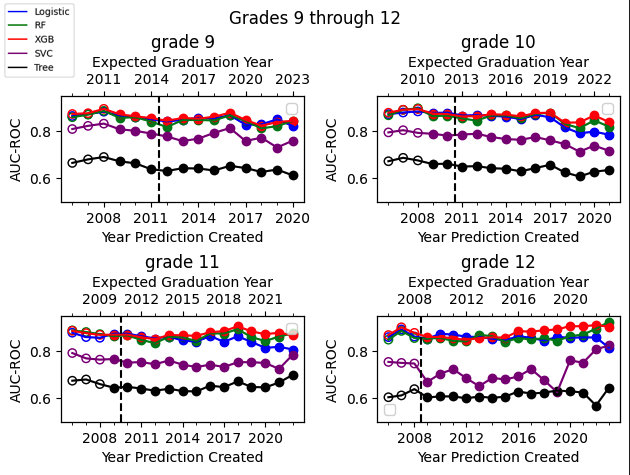
Finally we expand our analysis beyond 9th grade graduation predictions to predictions made in 6th-12th grade. For 6th graders, there is a 7 year delay between the training data and non-overlapping prediction data, while for 12th graders there is only a one year delay. Results are presented in figures 9 and 10. For the Random Forest, XGBoost and Logistic models we see relatively strong and consistent performance over time. The SVM and single decision tree perform much worse, and in middle school especially the SVM shows significant accuracy rot.
Discussion
Taken together, these results show that in many circumstances high school graduation prediction models maintain their predictive accuracy over time and do not rot. This suggests that it can be feasible to continue using trained models for several years without updating. Our findings also suggest that although researchers generally have not performed NOLFO validation of model accuracy, single-year-leave-future-out or within-year cross validation can provide accuracy estimates that are reasonably close to those obtained by NOLFO validation.
However, particularly when dealing with smaller data sets, like those representing a single school district, we do see cases where models rot rapidly and predictive accuracy declines. It is unfortunately the case that contexts that do not have sufficient data to perform NOLFO validation are those contexts where it is most likely to be needed. In these cases, more stringent validation which is fully non-overlapping may be warranted.
We should also note that the feature set used was developed and tested to optimize performance of a Random Forest model and may have been less optimal for other algorithms. Models were also tested with default hyper-parameters. We therefore should not over-interpret the poor performance of the SVM model; it is possible that with adjustments to features and hyper-parameter tuning the SVM model performance could be substantially increased and potentially stabilized over time. Nonetheless, in grades 6 and 7 we saw substantial rot in the SVM model AUC, and in 12th grade we saw an unusual increase in AUC for the SVM. We would therefore recommend further careful testing of how SVM models perform over time, if they are selected for use in the high school graduation prediction context.
The testing period coincided with the COVID-19 pandemic, which substantially disrupted K-12 education. It is surprising that we do not see a clear decrease in model accuracy during the pandemic. We offer two potential explanations. First, we measure model accuracy here using the AUC ROC criteria. This is a measure of the relative order of students and is not a measure of model calibration. If the real probability of graduating decreased uniformly for all students in the 2020-21 school year because of the pandemic but relative risk was unchanged, the AUC ROC metric would report the same value. Second, many features used in the prediction models are normalized by year. It is possible that the normalized variables allow the models to continue to perform well at relatively ranking students over time despite shifts in the absolute value of the variables. Further research should examine whether normed vs nominal scaled values are more robust to detector rot.
One key limitation to this paper is that we do not test for model fairness and do not measure model performance for different subgroups of students. Although NOLFO performance was good in general, this result may be masking changes in quality for specific groups of learners. Therefore, future research should apply NOLFO validation to fairness analyses and investigate accuracy over time for student subgroups. There may be particular concern if, unlike this paper’s approach, a model includes demographic identifiers in the training data (a practice that has received recent debate in our community -- see discussion in [3]). In that case, the predictive role of demographic identifiers may be susceptible to semantic shift over time in a way that particularly impacts model performance for a specific group but not others. For example, if a school district implements group-wide support for members of a historically underrepresented group or fixes previously racist disciplinary practices, that may change the predictiveness of a demographic variable over time.
Aside from that possible limitation and area of future investigation, these findings of model stability suggest that organizations providing risk prediction models may be able to use a trained model for several years without updating and see consistent accuracy in future years. Such an approach would allow organizations not to store sensitive, identifiable student data.
We suggest that, wherever possible, organizations creating applied risk prediction models be attentive to the temporal structure of their data and consider whether their held-out test sets are truly unseen. In contexts with long delays between feature and outcome observations and where there is overlap between consecutive cohorts, NOLFO is an important tool for ensuring that estimated model accuracy is representative of what can be expected in implementation.
acknowledgements
[left blank for review]
References
- Allensworth, E. (2013). The use of ninth-grade early warning indicators to improve Chicago schools. Journal of Education for Students Placed at Risk (JESPAR), 18(1), 68-83. https://doi.org/10.1080/10824669.2013.745181
- Baker, R. S., Berning, A. W., Gowda, S. M., Zhang, S., & Hawn, A. (2020). Predicting K-12 dropout. Journal of Education for Students Placed at Risk (JESPAR), 25(1), 28-54. https://doi.org/10.1080/10824669.2019.1670065
- Baker, R.S., Esbenshade, L., Vitale, J.M., Karumbaiah, S. (2023) Using Demographic Data as Predictor Variables: a Questionable Choice. To appear in Journal of Educational Data Mining, 15 (2), 22-52. https://doi.org/10.5281/zenodo.7702628
- Bowers, A. J., Sprott, R., & Taff, S. A. (2012). Do we know who will drop out? A review of the predictors of dropping out of high school: Precision, sensitivity, and specificity. The High School Journal, 96(2), 77-100. https://doi.org/10.1353/hsj.2013.0000
- Bowers, A. J., & Zhou, X. (2019). Receiver operating characteristic (ROC) area under the curve (AUC): A diagnostic measure for evaluating the accuracy of predictors of education outcomes. Journal of Education for Students Placed at Risk (JESPAR), 24(1), 20-46. https://doi.org/10.1080/10824669.2018.1523734
- Brooks, C., Thompson, C., & Teasley, S. (2015). A time series interaction analysis method for building predictive models of learners using log data. In Proceedings of the Fifth International Conference on Learning Analytics and Knowledge, 126-135. https://doi.org/10.1145/2723576.2723581
- Cerqueira, V., Torgo, L., & Mozetič, I. (2020). Evaluating time series forecasting models: An empirical study on performance estimation methods. Machine Learning, 109, 1997-2028. https://doi.org/10.1007/s10994-020-05910-7
- Christie, S. T., Jarratt, D. C., Olson, L. A., & Taijala, T. T. (2019). Machine-Learned School Dropout Early Warning at Scale. Paper presented at the International Conference on Educational Data Mining (EDM) (12th, Montreal, Canada, Jul 2-5, 2019). International Educational Data Mining Society, 726-731.
- Coleman, C., Baker, R. S., & Stephenson, S. (2019). A Better Cold-Start for Early Prediction of Student At-Risk Status in New School Districts. Paper presented at the International Conference on Educational Data Mining (EDM) (12th, Montreal, Canada, Jul 2-5, 2019). International Educational Data Mining Society.
- Coleman, C. J. (2021). Exploring a Generalizable Machine Learned Solution for Early Prediction of Student At-Risk Status. Doctoral Thesis. Columbia University. https://doi.org/10.7916/d8-5scb-n214
- Curella, S. A., Ingraham, A. J., & Janese, J. R. (2023). Addressing the Increase of Ninth Grade Behavior Referrals Post-Pandemic in Three Western New York High Schools. Doctoral Dissertation. State University of New York at Buffalo, ProQuest Dissertations Publishing, 30423592.
- Dee, T. S. (2023). Higher Chronic Absenteeism Threatens Academic Recovery from the COVID-19 Pandemic. Preprint. https://doi.org/10.31219/osf.io/bfg3p
- Duwe, G., & Kim, K. (2017). Out with the old and in with the new? An empirical comparison of supervised learning algorithms to predict recidivism. Criminal Justice Policy Review, 28(6), 570-600. https://doi.org/10.1177/0887403415604899
- Esbenshade, L., Baker, R. S., & Vitale, J. (2023). From a Prediction Model to Meaningful Reports in School. Paper presented at Education Leadership Data Analytics (ELDA) 2023 Conference (New York, NY, June 22-23, 2023).
- Freeman, J., & Simonsen, B. (2015). Examining the impact of policy and practice interventions on high school dropout and school completion rates: A systematic review of the literature. Review of Educational Research, 85(2), 205-248. https://doi.org/10.3102/0034654314554431
- Jeni, L. A., Cohn, J. F., & De La Torre, F. (2013). Facing imbalanced data--recommendations for the use of performance metrics. In 2013 Humaine Association Conference on Affective Computing and Intelligent Interaction (Geneva, Switzerland, 2013). IEEE, 245-251. https://doi.org/10.1109/ACII.2013.47
- Knowles, J. E. (2015). Of Needles and Haystacks: Building an Accurate Statewide Dropout Early Warning System in Wisconsin. Journal of Educational Data Mining, 7(3), 18-67. https://doi.org/10.5281/zenodo.3554725
- Kuhfeld, M., Soland, J., & Lewis, K. (2022). Test score patterns across three COVID-19-impacted school years. Educational Researcher, 51(7), 500-506. https://doi.org/10.3102/0013189X221109178
- Kwegyir-Aggrey, K., Gerchick, M., Mohan, M., Horowitz, A., & Venkatasubramanian, S. (2023, June). The Misuse of AUC: What High Impact Risk Assessment Gets Wrong. In FAccT ‘23: Proceedings of the 2023 ACM Conference on Fairness, Accountability, and Transparency (pp. 1570-1583). https://doi.org/10.1145/3593013.3594100
- Lakkaraju, H., Aguiar, E., Shan, C., Miller, D., Bhanpuri, N., Ghani, R., & Addison, K. L. (2015, August). A machine learning framework to identify students at risk of adverse academic outcomes. In KDD ‘15: Proceedings of the 21st ACM SIGKDD International Conference on Knowledge Discovery and Data Mining (pp. 1909-1918). https://doi.org/10.1145/2783258.2788620
- Lee, M. P., Croteau, E., Gurung, A., Botelho, A., & Heffernan, N. (2023, July). Knowledge Tracing Over Time: A Longitudinal Analysis. Paper presented at the International Conference on Educational Data Mining (EDM) (16th, Bengaluru, India, Jul 11-14, 2023). International Educational Data Mining Society.
- Lee, S., & Chung, J. Y. (2019). The machine learning-based dropout early warning system for improving the performance of dropout prediction. Applied Sciences, 9(15), 3093. https://doi.org/10.3390/app9153093
- Levin, N., Baker, R., Nasiar, N., Stephen, F., & Hutt, S. (2022, January). Evaluating Gaming Detector Model Robustness Over Time. In Proceedings of the 15th International Conference on Educational Data Mining. International Educational Data Mining Society, 398-405. https://doi.org/10.5281/zenodo.6852961
- Márquez-Vera, C., Cano, A., Romero, C., Noaman, A. Y. M., Mousa Fardoun, H., & Ventura, S. (2016). Early dropout prediction using data mining: a case study with high school students. Expert Systems, 33(1), 107-124. https://doi.org/10.1111/exsy.12135
- National Center for Education Statistics. (2023). Public High School Graduation Rates. Condition of Education. U.S. Department of Education, Institute of Education Sciences. Retrieved 12/18/2023, from https://nces.ed.gov/programs/coe/indicator/coi
- Pattison, E., Grodsky, E., & Muller, C. (2013). Is the sky falling? Grade inflation and the signaling power of grades. Educational Researcher, 42(5), 259-265. https://doi.org/10.3102/0013189X13481382
- Perdomo, J. C., Britton, T., Hardt, M., & Abebe, R. (2023). Difficult Lessons on Social Prediction from Wisconsin Public Schools. arXiv preprint arXiv:2304.06205. https://doi.org/10.48550/arXiv.2304.06205
- The Policy Lab. (2021, May 17). How can we leverage machine learning to reduce the high school dropout rate?. The Policy Lab. Retrieved 12/18/2023, from https://thepolicylab.brown.edu/projects/how-can-we-leverage-machine-learning-to-reduce-the-high-school-dropout-rate
- Powers, D. M. (2012, March). The problem of area under the curve. In 2012 IEEE International Conference on Information Science and Technology (Wuhan, China, 2012). IEEE, 567-573. https://doi.org/10.1109/ICIST.2012.6221710
- Prothero, A. (April 2023). Student behavior isn’t getting any better, survey shows. Education Week. Retrieved 12/18/2023, from https://www.edweek.org/leadership/student-behavior-isnt-getting-any-better-survey-shows/2023/04
- Queiroga, E. M., Batista Machado, M. F., Paragarino, V. R., Primo, T. T., & Cechinel, C. (2022). Early prediction of at-risk students in secondary education: A countrywide k-12 learning analytics initiative in Uruguay. Information, 13(9), 401. https://doi.org/10.3390/info13090401
- Richter, A. N., & Khoshgoftaar, T. M. (2018). A review of statistical and machine learning methods for modeling cancer risk using structured clinical data. Artificial Intelligence in Medicine, 90, 1-14. https://doi.org/10.1016/j.artmed.2018.06.002
- San Pedro, M.O.Z., Baker, R.S.J.d., Bowers, A.J., Heffernan, N.T. (2013) Predicting College Enrollment from Student Interaction with an Intelligent Tutoring System in Middle School. In Proceedings of the 6th International Conference on Educational Data Mining (Memphis, TN, July 6-9). International Educational Data Mining Society, 177-184.
- Sansone, D. (2019). Beyond early warning indicators: high school dropout and machine learning. Oxford Bulletin of Economics and Statistics, 81(2), 456-485. https://doi.org/10.1111/obes.12277
- Sorensen, L. C. (2019). “Big data” in educational administration: An application for predicting school dropout risk. Educational Administration Quarterly, 55(3), 404-446. https://doi.org/10.1177/0013161X18799439
- Tashman, L. J. (2000). Out-of-sample tests of forecasting accuracy: an analysis and review. International Journal of Forecasting, 16(4), 437-450. https://doi.org/10.1016/S0169-2070(00)00065-0