ABSTRACT
Randomized A/B tests within online learning platforms enable us to draw unbiased causal estimators. However, precise estimates of treatment effects can be challenging due to minimal participation, resulting in underpowered A/B tests. Recent advancements indicate that leveraging auxiliary information from detailed logs and employing design-based estimators can yield unbiased and precise statistical inferences with minimal assumptions, even in small sample sizes. Our ongoing research aims to incorporate the Remnant Leave-One-Out Potential outcomes (ReLOOP) estimator and its variants into ASSISTments, an online tutoring platform. In this work, we define remnant (auxiliary information for experiments) data and identify the common outcomes of interest for educational trials. We also formulate and train various predictive models using both prior student statistics and prior assignment statistics, evaluating which model performs better in terms of Mean Squared Error (MSE) and Coefficient of Determination (\(R^{2}\)). In addition, we establish an infrastructure to facilitate combining remnant-based predicted outcomes and ReLOOP estimators in tutoring experiments, used to boost power in educational A/B tests. Our preliminary findings suggest that incorporating auxiliary information into the ReLOOP estimator is roughly equivalent to increase sample size by 44% compared to conventional t-tests (difference-in-means estimator, DM) and by 12% compared to Leave-One-Out Potential outcomes (LOOP) estimator, which relies solely on experimental data. When applied to A/B tests in online tutoring platforms, improved precision via ReLOOP estimators allows for inferences to be made earlier in the development process and thus will lead to more rapid development of optimized learning systems.
Keywords
1. INTRODUCTION
Randomized A/B tests, conducted on online Computer-Based Learning Platforms (CBLPs) such as ASSISTments [3], are employed to compare various conditions and identify the most effective student support mechanisms. The foundation of these tests is randomization, a crucial aspect of experimental design, which enables to draw well-founded inferences: it ensures there is no confounding bias when the probabilities of assigning students to different experimental conditions are known. Moreover, causal estimators and standard errors that depend on the structure of the experimental design are referred to as "design-based" [7].
Nevertheless, A/B tests might face challenges with statistical precision due to high standard errors of the relevant estimators, since imbalanced baseline covariates among experimental participants and/or small sample sizes exist. Recent advancements [6] demonstrate that using remnant data (with available covariates and potential outcomes same as experiments, without overlapping with experimental data) and experimental within-sample covariate adjustments in design-based estimators can provide unbiased estimators and enhance estimated precision. The LOOP [8] and remnant-based residualization (rebar) [5] estimators used covariate data from experimental participants and non-participants, respectively, to reduce standard errors. The ReLOOP [2, 6] estimator, combined those two estimators, boosting statistical precision even more. It outperformed both LOOP and rebar when applying them to over 250 randomized A/B comparisons conducted within ASSISTments. Our current study plans to integrate ReLOOP into new experiments within E-TRIALS (Educational Technology Research Infrastructure to Advance Learning Sciences) on the ASSISTments platform [1, 4], to facilitate exact causal inferences and boost optimal educational strategy developments.
2. RESEARCH FOCUSES
Now we focus on applying ReLOOP to one specific experiment with students randomized to receive different tutoring strategies (e.g. hints), and aim to expand ReLOOP to other experiments running on E-TRIALS. In the experiment, students see hints as usual under condition \(0\), and students are prompted to reflect on what they are confused about before seeing the first hint under condition \(1\). The outcomes of interest are taken to be average correctness after first hint and average correctness across all problems in one assignment. We determine some prior student statistics and prior assignment statistics as remnant of other students using ASSISTments, nonoverlapping with experimental data. Next, we utilize unmatched control subjects (remnant) to fit various neural networks, predicting control potential outcomes without sacrificing the integrity of the experimental design. Also, such resulting predictions in the experimental set are used to adjust the causal estimators, along with within-sample covariates, to reduce estimated standard errors. Furthermore, we want to explore how to determine a more representative remnant, and how to obtain better predictive models.
Our research also aims to address several related statistical questions. We examine whether using imputations from remnant-based models can improve estimated standard errors, and determine the most effective one among various trained neural networks. Next, we plan to investigate the potential of utilizing ReLOOP [6] based on representative and unrepresentative remnants for estimating subgroup and overall population effects. Moreover, our goal is to establish a common historical data repository for all E-TRIALS experiments, select crucial features for both predictive model training and covariate adjustments, and formulate better universal predictive models using a common remnant.
3. STATISTICAL METHODS
3.1 Experiments in ASSISTments
Experiments running on ASSISTments using A/B tests follow the randomization mechanism, which benefits causal inferences by ruling out confounding factors. However, unlike observational studies using data from online tutors, the sample size in A/B tests is limited to students who worked on the relevant modules while the study took place, leading to small sample sizes. Fortunately, we can access rich prior student and assignment logs within ASSISTments, and use such auxiliary data to decrease experimental standard errors without sacrificing the unbiased estimators and design-based inferences that recommend A/B tests [5].
3.2 ReLOOP for Causal Inferences
In a study with \(N\) subjects indexed by \(i=1,2,...N\), each is randomized into treatment (\(T_i = 1\)) or control (\(T_i = 0\)) groups. Outcomes \(Y_i\) and baseline covariates \(X_i\) are recorded. Assuming \(T_i\) are independently Bernoulli distributed, and \(p_i = P(T_i = 1)\) with \(0 < p_i < 1\), we want to explore the average treatment effect \(\bar {\tau }_{RCT}=\overline {y(1)}-\overline {y(0)}\) where \(\overline {y(1)}\) and \(\overline {y(0)}\) represent the sample means of potential outcomes under treatment and control respectively. Although \(\bar {\tau }_{RCT}\) is a theoretical value and is never directly observed, it can be estimated using the difference-in-means (DM) estimator: \begin {equation} \hat {\tau }^{DM}=\frac {1}{n}\sum _{i\in \mathcal {T}}Y_i-\frac {1}{N-n}\sum _{i \in \mathcal {C}}Y_i \end {equation} \(\mathcal {T}\) and \(\mathcal {C}\) represent treated and control groups. \(\hat {\tau }^{DM}\) is an unbiased estimator in Randomized Controlled Trials (RCTs), while depends on unobserved potential outcomes and overlooks baseline covariates.
To estimate the average effect more precisely, we first fit a deep neural network to data from students who had worked on the same problem set before the onset of the experiment or had worked on other problem sets in the same unit, predicting the outcome of interest as a function of covariates. Then, we used that trained algorithm to generate predicted outcomes \(\hat {y}^r\) for all of the students in the experiment.
In Bernoulli-randomized A/B tests, we seek to impute potential outcomes, \(\widehat {y(z)}^{RCT}(\vec {x},\hat {y}^{r};\vec {\alpha })\), using covariates \(\vec {x}\) and predicted \(\hat {y}^{r}\) in experimental data. We have: \begin {equation} \widehat {y(z)}^{RCT}(\vec {x},\hat {y}^{r};\vec {\alpha })_{OLS}=\alpha _{0}^{z}+\alpha _{1}^{z}\vec {x}+\alpha _{2}^{z}\hat {y}^{r} \end {equation} where \(\vec {\alpha }=\begin {bmatrix}\alpha _{0},\alpha _{1},\alpha _{2}\end {bmatrix}\), estimated in both treatment and control groups. Furthermore, Leave-One-Out approach helps ensure unconfounded treatment assignment via excluding the treatment assignment \(Z\) from influencing imputations in \(\widehat {y(z)}^{RCT}(\vec {x},\hat {y}^{r};\vec {\alpha })\). For each participant \(i\), estimate \(\vec {\alpha }\) using data from the other \(n-1\) participants, computing \(\widehat {y_{i}(0)}^{RCT}(\vec {x},\hat {y}^{r})=\widehat {y(0)}^{RCT}(\vec {x}_i,\hat {y}_{i}^{r};\hat {\vec {\alpha }}_{(i)})\) and \(\widehat {y_{i}(1)}^{RCT}(\vec {x},\hat {y}^{r})=\widehat {y(1)}^{RCT}(\vec {x}_i,\hat {y}_{i}^{r};\hat {\vec {\alpha }}_{(i)})\) with parameters \(\hat {\vec {\alpha }}_{(i)}\) excluding the \(i^{th}\) participant’s data. Then Horvitz-Thompson estimator’s idea is applied here: \begin {equation} \hat {m}_{i}(\vec {x},\hat {y}^{r})=p\widehat {y_{i}(0)}^{RCT}(\vec {x},\hat {y}^{r})+(1-p)\widehat {y_{i}(1)}^{RCT}(\vec {x},\hat {y}^{r}) \end {equation} where \(p\) denotes the probability of an individual participant being assigned to the treatment condition.
Moreover, ReLOOP estimator is established as: \begin {equation} \hat {\tau }_{LOOP}(\vec {x},\hat {y}^{r})=\sum _{i:Z_i=1}\frac {Y_i-\hat {m}_{i}(\vec {x},\hat {y}^{r})}{np}-\sum _{i:Z_i=0}\frac {Y_i-\hat {m}_{i}(\vec {x},\hat {y}^{r})}{n(1-p)} \end {equation} The potential of adding \(\hat {y}^{r}\) to \(\hat {\tau }_{LOOP}(\vec {x})\) estimator to boost precision over \(\hat {\tau }^{DM}\) and \(\hat {\tau }_{LOOP}(\vec {x})\), depends on MSE and \(R^{2}\) of remnant-based predictive models [6].
4. PRELIMINARY RESULTS
4.1 Data Processing
We extracted both remnant and experimental data from the ASSISTments database, and variables are consistent in both remnant and experiment, with two outcomes of interest being the average correctness after first hint and total average correctness. We analyze data on two levels: prior student statistics and prior assignment statistics. The remnant data was augmented with additional relevant problem sets, which are located in the same section as the target problem sets in the curriculum, to enlarge the remnant sample size.
We evaluated effective sample sizes in both remnant and experimental data, filtered students and assignments having no missing values in significant features, performed feature engineering to obtain our interested outcomes, and transformed data to desired structures. Also, one hot encoder and standardization are applied to categorical and continuous features, preparing them for neural networks’ training. Our processed data include 899 student records and 17,466 assignment records for remnant data, and 465 student records and 10,297 assignment records for experimental data.
4.2 Predictive Models
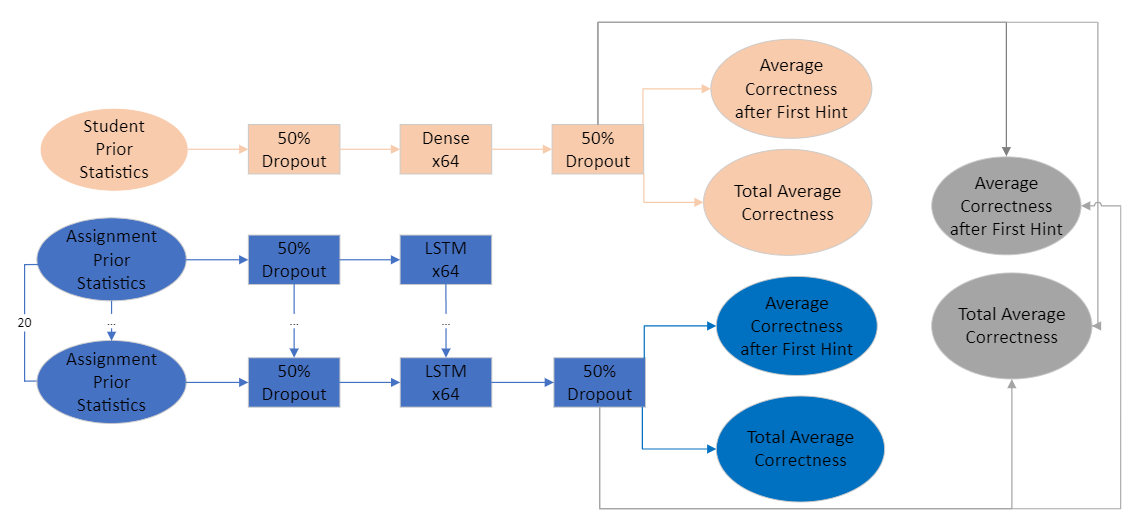
Given our data is structured at two distinct levels, student and assignment, we developed two separate models for each level, and then integrated them into a combined model to leverage information from both dimensions. The model for prior student statistics, illustrated in red in Figure \(1\), is a simple feed-forward neural network. It includes a single hidden layer equipped with sigmoid activation functions and incorporates dropout to mitigate overfitting. The model dedicated to prior assignment statistics, depicted in blue in Figure \(1\), employs a recurrent neural network (RNN) architecture. This model features a single layer of Long Short-Term Memory (LSTM) nodes, which benefits from both inter-layer and recurrent dropout mechanisms to enhance its robustness and generalization capacity.
During the training phase of these models, we optimized hyperparameters such as dropout rate, the number of layers, and the number of nodes per layer through a combination of grid search and cross-validation techniques. ADAM optimization algorithm guided the backpropagation process for all models. We utilized the MSE as the loss function for both outcomes: average correctness after first hint and total average correctness. Our preliminary results obtained from cross-validation and experimental data are presented in Table \(1\) and Table \(2\) respectively.
| Metric | Student | Assignment | Combined |
|---|---|---|---|
| Correctness MSE | 0.0793 | 0.0779 | \(\mathbf {0.0759}\) |
| Correctness \(R^{2}\) | 0.1756 | 0.1904 | \(\mathbf {0.2120}\) |
| CorrectnessT MSE | 0.0499 | 0.0489 | \(\mathbf {0.0456}\) |
| CorrectnessT \(R^{2}\) | 0.2353 | 0.2515 | \(\mathbf {0.3009}\) |
| Metric | Student | Assignment | Combined |
|---|---|---|---|
| Correctness MSE | 0.1083 | 0.0819 | \(\mathbf {0.0781}\) |
| Correctness \(R^{2}\) | -0.1203 | 0.2827 | \(\mathbf {0.3157}\) |
| CorrectnessT MSE | 0.0747 | 0.0574 | \(\mathbf {0.0527}\) |
| CorrectnessT \(R^{2}\) | -0.1369 | 0.2927 | \(\mathbf {0.3508}\) |
| Note:
| |||
| Correctness: Average Correctness after first hint.
| |||
| CorrectnessT: Total Average Correctness.
| |||
Based on these, it is evident that the combined predictive model, derived from the remnant data, achieves the lowest MSE and the highest \(R^{2}\) shown as bold. Intriguingly, despite the model reliant on prior student statistics exhibits poor performance on the experimental data indicated via negative \(R^{2}\), its integration into the final combined model results in decreased MSE and increased \(R^{2}\), meaning that synergy between the datasets significantly enhances the model’s precision beyond what each dataset could attain independently. Also, our endeavors to refine the predictive models have successfully contributed to reducing estimated standard errors. However, it is important to note that ReLOOP operates without assuming that the predictions provided by these models are optimal, precise, or inherently correct.
4.3 Casual Estimators
To evaluate the effectiveness of using remnant-based predicted values in boosting statistical precision, we conducted comparisons across causal estimators (simpDiff, LOOP, ReLoop OLS and ReLoopPlus) described below, including point estimates and estimated standard errors in Table \(3\).
- simpDiff: no adjustments, difference-in-means (DM)
- LOOP: adjustments using within-sample covariates.
- ReloopOLS: adjustments using remnant-based imputations \(\hat {y}_{i}^{r}\), employing Ordinary Linear Squares (OLS) regression.
- ReLoopPlus: adjustments using with-sample covariates and remnant-based imputations \(\hat {y}_{i}^{r}\) via combining Ordinary Linear Squares (OLS) regression and Random Forest (RF).
| Estimator | Est | Est Standard Error |
|---|---|---|
| simpDiff | \(-0.0276\) | \(0.0426\) |
| LOOP | \(-0.0181\) | \(0.0376\) |
| ReLoopOLS | \(-0.0042\) | \(\mathbf {0.0355}\) |
| ReLoopPlus | \(-0.0055\) | \(\mathbf {0.0355}\) |
In conclusion, utilizing predictive models trained on remnant data to impute outcomes in A/B tests and incorporating these imputed outcomes into causal estimators can significantly enhance statistical precision in educational experiments. Adjustments using remnant-based imputations \(\hat {y}_{i}^{r}\) contribute most to reducing estimated standard errors according to Table \(3\) and are shown as bold. Also, since sampling variance scales as \(1/n\), ratios of sampling variances can be thought of as "sample size multipliers" [6]–that is, decreasing the variance by a factor of \(q\) is analogous to increasing the sample size by the same factor. Therefore, results of causal estimates demonstrate that leveraging ReLoopOLS and ReLoopPlus effectively equates to a 44% increase in sample size when compared to traditional t-tests (simpDiff), and provides a 12% improvement over LOOP estimator reliant solely on experimental data. Besides, the prediction model combining student and assignment statistics yields the most substantial gains in precision.
5. DISCUSSION
5.1 Future Research
Statistical inference in subgroups can be less precise due to their inherently smaller sample sizes, and unrepresentative remnant and/or samples have less potential to boost statistical precision. Our future research will focus on how to deal with such questions, and next paths are shown as following:
- Investigate the advantages of using remnant-based imputations to conduct causal inferences within subgroups.
- Evaluate the utility of ReLOOP estimator in scenarios where the remnant data structure does not mirror that in the experiments, and/or samples are unrepresentative of the population.
- Expand the application of predictive models and ReLOOP estimators to additional experiments within E-TRIALS to ascertain the robustness of our approaches.
5.2 Advice Sought
Also, we want to get some advice regarding the below points to improve success of ReLOOP estimators to boost precision in causal inferences on educational A/B tests:
- How to obtain a better representative remnant for experiments, or establish a universal remnant for all experiments running on E-TRIALS?
- How to deal with missing values rather than dropping
or masking them when training predictive models
using remnant data?
Specifically, there are two kinds of missing values. The first type occurs when a student does not request hint while completing the assignments. As a result, we have the total average correctness but lack the average correctness after the first instance of hint. Nevertheless, we believe it is important to retain these samples as they provide valuable information for predicting student performance. The second type of missing value arises when a student has completed only a few prior assignments, which leads to missing values when training an LSTM with a fixed maximum sequence length. - Are there any other potential predictive models we should try, to obtain more optimal predictive models regarding MSE and \(R^{2}\), when dealing with sequence data?
- How can turn these results into general advice for A/B tests in EDM?
Addressing these questions will enable us to automate causal inference in new educational experiments on E-TRIALS with a reasoned basis. Additionally, based on identifying commonalities across all experiments via feature engineering, we can pinpoint key covariates to adjust confounding bias in causal estimators and boost precision in educational A/B tests.
6. ACKNOWLEDGMENTS
The research reported here was supported by the Institute of Education Sciences, U.S. Department of Education, through Grant #R305D210031. The opinions expressed are those of the authors and do not represent views of the Institute or the U.S. Department of Education. The authors want to thank Aaron Haim for help with the data, and Kirk Vanacore and Duy Pham for helpful comments.
7. REFERENCES
- R. Baker, S. Hutt, M. Mogessie, and H. Valayaputtar. Research using the mooc replication framework and e-trials. In 2022 IEEE Learning with MOOCS (LWMOOCS), pages 131–136, 2022.
- J. A. Gagnon-Bartsch, A. C. Sales, E. Wu, A. F. Botelho, J. A. Erickson, L. W. Miratrix, and N. T. Heffernan. Precise unbiased estimation in randomized experiments using auxiliary observational data. Journal of Causal Inference, 11(1):20220011, 2023.
- N. T. Heffernan and C. L. Heffernan. The ASSISTments Ecosystem: Building a Platform that Brings Scientists and Teachers Together for Minimally Invasive Research on Human Learning and Teaching. International Journal of Artificial Intelligence in Education, 24(4):470–497, Dec. 2014.
- N. Krichevsky, K. Spinelli, N. Heffernan, K. Ostrow, and M. R. Emberling. E-TRIALS. PhD thesis, Doctoral dissertation, Worcester Polytechnic Institute, 2020.
- A. C. Sales, B. B. Hansen, and B. Rowan. Rebar: Reinforcing a Matching Estimator With Predictions From High-Dimensional Covariates. Journal of Educational and Behavioral Statistics, 43(1):3–31, Feb. 2018.
- A. C. Sales, E. B. Prihar, J. A. Gagnon-Bartsch, and N. T. Heffernan. Using auxiliary data to boost precision in the analysis of a/b tests on an online educational platform: New data and new results. arXiv preprint arXiv:2306.06273, 2023.
- P. Z. Schochet. Statistical Theory for the RCT-YES Software: Design-Based Causal Inference for RCTs. U.S. Department of Education, Institute of Education Sciences, National Center for Education Evaluation and Regional Assistance., 2015.
- E. Wu and J. A. Gagnon-Bartsch. The LOOP Estimator: Adjusting for Covariates in Randomized Experiments. Evaluation Review, 42(4):458–488, Aug. 2018.