ABSTRACT
Curricular design in higher education significantly impacts student success and institutional performance. However, academic programs’ complexity—shaped by pass rates, prerequisite dependencies, and course repeat policies—creates challenges for administrators. This paper presents a method for modeling curricular pathways including development of a Curricular Analytics App, a scalable platform that models curricula as directed acyclic graphs (DAGs) to detect structural inefficiencies and bottlenecks. This method integrates Critical Path Analysis to highlight bottleneck courses delaying student progression, enhanced Monte Carlo simulations to capture real-world variability in course pass rates and retakes, and introduces Passability Complexity, a novel metric incorporating probabilistic pass rates into structural complexity. These features provide deeper insights into curriculum difficulty and graduation timelines. As a proof of concept that allows for applied analysis, the Curricular Analytics App has an interactive interface which users can modify courses and prerequisites in real time, enabling data-driven curriculum optimization. The app’s efficient graph-based algorithms ensure scalability for large academic programs. By linking curriculum structure to student outcomes, it supports institutions in improving graduation rates and streamlining degree pathways through evidence-based decision-making.
Keywords
1. INTRODUCTION
Higher education institutions face persistent challenges in designing curricula that balance academic rigor with timely degree completion. Complex prerequisite structures, bottleneck courses with low pass rates, and uneven course offerings often impede student progression and graduation rates [7, 16]. Traditional curriculum reviews rely on qualitative assessments, which are subjective and fail to account for dynamic factors such as pass rates and course repeat policies. In contrast, data-driven approaches provide quantitative insights, enabling institutions to model curriculum structures and optimize student success [6, 2]. Curricular modeling as described in this paper has the added benefit of understanding the potential impacts of curricular changes without waiting several years for students to progress through the curriculum. This paper introduces the Curricular Analytics App, a web-based platform that integrates graph theory, simulation techniques, and optimization algorithms to analyze academic curricula. By modeling curricula as directed acyclic graphs (DAGs), where nodes represent courses and edges denote prerequisites, the app identifies structural inefficiencies and supports data-driven interventions. Users can interactively refine curricula by modifying course dependencies, offering a flexible tool for institutional planning. A key feature of the app is its Critical Path Analysis, which determines the longest dependency chains in a curriculum to identify bottleneck courses that delay student progression. Additionally, the app incorporates two complexity metrics: Structural Complexity, which quantifies curriculum difficulty based on prerequisite dependencies [14, 13, 8, 15, 12, 10], and Passability Complexity, introduced in this work, which extends Structural Complexity by incorporating course pass rates to reflect real-world student challenges. The app also employs Monte Carlo simulations to model student progression under varying conditions, estimating graduation rates and assessing policy changes, such as adjustments to pass rates or prerequisite structures [17]. These simulations provide critical insights into the cascading effects of curriculum modifications, helping institutions identify high-impact courses and refine degree pathways. By integrating critical path analysis, structural complexity assessment, probabilistic modeling, and interactive curriculum design, the app bridges the gap between curriculum structure and student outcomes. The remainder of this paper is organized as follows: Section 2 reviews related work in curricular analytics. Section 3 outlines the app’s main contributions, including Passability Complexity and interactive curriculum modification. Section 4 describes the methodology, including algorithms and time complexity analysis. Section 5 provides a walkthrough demonstrating the app’s capabilities. Finally, Section 6 discusses conclusions and future directions.
2. BACKGROUND
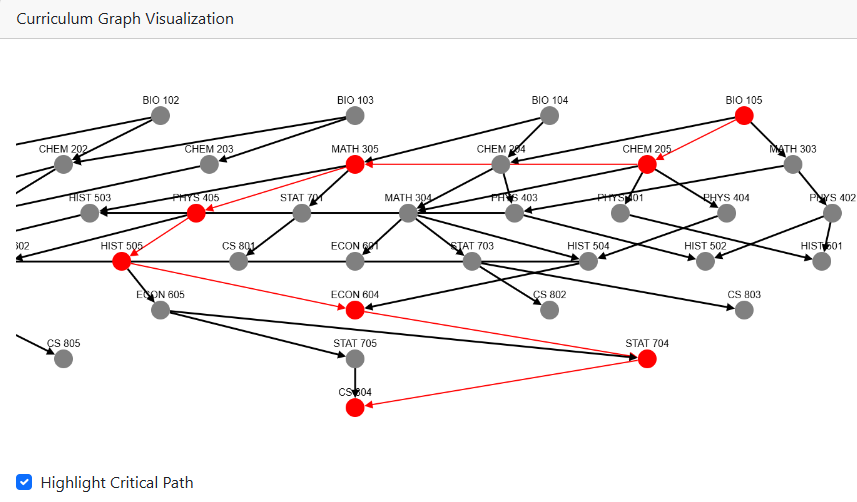
Curricular analytics plays a crucial role in optimizing academic pathways and improving student success [12, 10, 11, 9]. A fundamental approach in this field involves modeling curricula as directed acyclic graphs (DAGs), where nodes represent courses and edges denote prerequisite relationships. This structural representation enables the identification of bottleneck courses and critical pathways that impact student progression and time-to-degree. Slim et al. [14, 13] introduced key structural metrics such as the blocking factor, which quantifies a course’s influence on downstream dependencies, and the delay factor, which measures the impact of prerequisite chains on graduation timelines. These metrics have been instrumental in curriculum redesign to enhance flexibility and reduce barriers. Figure 1 illustrates a curriculum graph, highlighting course dependencies.

While traditional structural analyses provide valuable insights, they often assume static curriculum structures, limiting their adaptability in evolving academic programs. Recent advancements [8, 12, 10] integrate data-driven techniques to offer more dynamic solutions. Probabilistic models address variations in student progression by incorporating pass rates, course repeat behaviors, and enrollment constraints. Markov chain models have been particularly effective in identifying high-risk courses and critical academic transitions [15, 3, 1]. Monte Carlo simulations extend these approaches by generating thousands of potential student trajectories, providing detailed insights into graduation rates, time-to-degree, and the impact of academic policies [5]. Structural complexity metrics remain essential for quantifying curriculum difficulty. The blocking factor identifies courses that strongly influence student progression, while the delay factor highlights the impact of prerequisite chains on graduation timelines [14, 13, 4]. However, existing methods primarily focus on static analyses, overlooking the role of fluctuating pass rates and student retake behaviors. Integrating these dynamic elements into real-time curriculum analysis presents a promising avenue for future research, enabling institutions to implement more adaptive, data-driven interventions. Figure 2 illustrates Critical Path Analysis, which identifies the sequence of courses imposing the most significant constraints on student progression. This analysis demonstrates how graph theory and probabilistic models can work together to address curriculum bottlenecks.
3. MAIN CONTRIBUTIONS
This paper presents the Curricular Analytics App, a web-based platform designed to enhance curriculum evaluation and optimization through data-driven analysis, efficient algorithms, and an interactive interface. The app is used as a proof of concept to demonstrate possibilities for applied research using the concepts developed in this paper. The primary contributions of this work include:
-
Enhanced Monte
Carlo Simulation: Unlike traditional deterministic models, the app employs a dynamic Monte Carlo simulation framework that integrates real-world pass rates, course repeat thresholds, and enrollment constraints. This enables scenario analysis to estimate graduation rate distributions and assess the impact of curriculum modifications on time-to-degree. -
Optimized Critical Path Analysis: The app efficiently identifies bottleneck courses and prerequisite chains that delay graduation. Using topological sorting, the algorithm achieves a time complexity of \(O(|V| + |E|)\), enabling real-time curriculum analysis for large academic programs.
-
Interactive Curriculum Exploration and Editing: The app provides a user-friendly interface that allows administrators and faculty to modify curriculum structures dynamically. Features include:
-
Graph-based visualization of course dependencies.
-
Dynamic highlighting of critical paths and bottleneck courses.
-
Course-specific complexity metrics, displayed in extendable tables.
-
Interactive controls for adjusting simulation parameters and analyzing graduation outcomes.
-
Direct modification of course structures and prerequisite relationships.
-
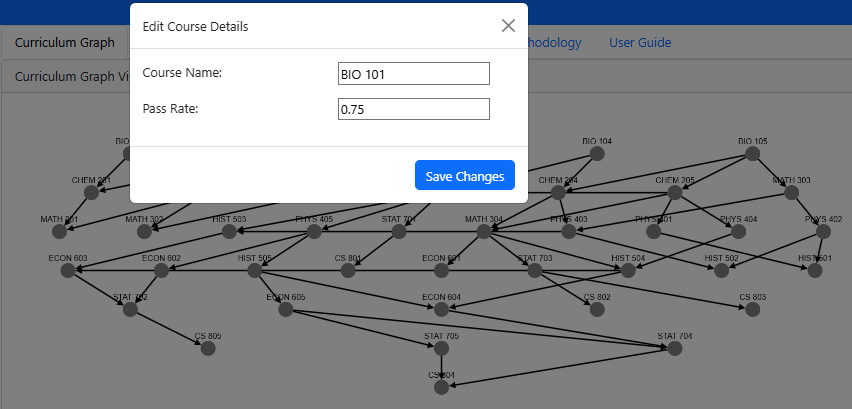
By integrating these analytical methods with interactive visualization, the Curricular Analytics App provides institutions with a scalable, data-driven tool to enhance student success, reduce time-to-degree, and optimize resource allocation. Figure 3 illustrates the interactive course editing interface, where users can modify curriculum structures and observe real-time impacts.
These contributions align with broader educational goals of optimizing academic pathways and supporting evidence-based policy interventions.
4. METHODOLOGY
This section describes the methodologies and algorithms underpinning the Curricular Analytics App. The methodologies employ graph theory and probabilistic modeling to analyze curricula, predict graduation rates, and compute complexity metrics. By leveraging computationally efficient algorithms and data-driven modeling, the app provides insights into student progression bottlenecks and supports curriculum design improvements. Each component is designed with scalability in mind, ensuring that the system can handle large-scale academic programs effectively while enabling real-time decision-making.
4.1 Graph-Based Representation of Curricula
Our analytical framework models curricula as directed acyclic graphs (DAGs), where nodes represent courses and directed edges denote prerequisite relationships. The curriculum graph is defined as \(G = (V, E)\), with \(V\) as the set of courses and \(E\) as the set of prerequisite dependencies. Additional attributes, such as \(\text {PassRate}(v)\) (probability of successful completion) and \(\text {RetakeThreshold}(v)\) (maximum retakes allowed), further refine the model. The acyclic nature of the graph ensures the absence of circular dependencies, allowing for efficient topological sorting to determine valid course sequences. This representation scales effectively to large curricula while enabling key analyses such as critical path computation, bottleneck identification, and complexity measurement. Essential graph operations include topological sorting (\(O(|V| + |E|)\)) to order courses sequentially, reachability analysis to determine downstream dependencies, and longest path analysis to identify delays in student progression. These operations underpin the app’s core functionalities, providing actionable insights for optimizing curriculum design and improving student success.
4.2 Critical Path Analysis
The critical path is a fundamental concept in curriculum analysis, representing the sequence of courses that imposes the longest cumulative delay on student progression. Identifying this path is crucial for recognizing bottleneck courses—those that disproportionately contribute to delays due to prerequisite dependencies and low pass rates. Addressing these bottlenecks enables institutions to improve graduation timelines and reduce student attrition rates. The critical path in a curriculum graph is defined as the longest path, in terms of cumulative delay, from a starting course (with no prerequisites) to an ending course (a terminal course in the curriculum). Each course contributes to this delay based on its prerequisite relationships, which enforce sequential dependencies, and its pass rate, which probabilistically determines the likelihood of successful completion in a given semester. The critical path highlights courses that most influence the time required to complete the curriculum, often acting as major bottlenecks. The delay of each course \( v \) is computed as:
-
If a course has a pass rate of 1.0 (100% success on the first attempt), then \( \frac {1}{1.0} = 1 \), meaning the student is expected to complete the course in one term.
-
If the pass rate is 0.5, meaning students succeed on average every two attempts, then \( \frac {1}{0.5} = 2 \), indicating that the expected delay is two terms.
-
Lower pass rates further increase the expected delay, emphasizing courses where students frequently need multiple attempts to pass.
By incorporating pass rates directly into the delay computation, this approach provides a realistic estimation of course completion times rather than assuming deterministic progression. This formulation allows institutions to identify courses where improving pass rates would have the most significant impact on reducing time-to-degree. To compute the critical path efficiently, a dynamic programming approach is employed, where delays are calculated for each course in topological order, ensuring valid prerequisite sequences. This approach is significantly more computationally efficient than brute-force methods, which would require evaluating all possible paths in the graph. The algorithm follows the steps in Algorithm 1.

4.3 Monte Carlo Simulation for Graduation Rate Estimation
Traditional curriculum analysis methods often rely on deterministic models that assume fixed student success rates and course completion timelines. However, real-world student progression is inherently probabilistic, influenced by dynamic pass rates, course repeat behaviors, and course availability constraints. To address these complexities, we employ Monte Carlo simulation, a probabilistic approach that models graduation outcomes under varying conditions. By incorporating stochastic variations in student performance, this method enables institutions to assess curriculum feasibility, identify high-risk courses, and evaluate policy interventions such as adjustments to pass rates or course repeat thresholds. The simulation framework is built on the curriculum graph representation, where each course \( v \in V \) has a pass rate \( \text {PassRate}(v, t) \) that evolves based on the number of attempts. Specifically, the pass rate follows:

This simulation provides a flexible and scalable method for estimating student outcomes under various academic policies. By modeling the effects of prerequisite structures, pass rates, and course repeat limits, institutions can test curriculum modifications and assess their impact on student success. The integration of dynamic pass rates ensures a more realistic representation of student progression, while Monte Carlo sampling accounts for uncertainty in academic outcomes. These insights help educators design interventions that maximize graduation rates and reduce time-to-degree with immediate data-informed feedback that demonstrates predicted impact of any given combination of policy, curriculum, or course pass rate change.
Key Advantages: Unlike deterministic models with fixed pass rates and rigid semester structures, Monte Carlo simulation accounts for student variability, allowing institutions to model diverse graduation scenarios and assess interventions. These include increasing pass rates through instructional improvements, adjusting retake thresholds to reduce delays, and restructuring prerequisites to enhance course availability. By integrating Monte Carlo simulation into the Curricular Analytics App, institutions gain a flexible, data-driven approach to optimizing curriculum structures, improving retention, and enhancing graduation outcome without waiting for students to move all of the way through the program to understand the predicted results of changes and interventions.
4.4 Structural and Passability Complexity
The complexity of a curriculum is determined by its structural dependencies, prerequisite relationships, and the probabilistic nature of course completion. Two key metrics quantify this complexity: Structural Complexity and Passability Complexity. Structural Complexity is purely topological, capturing the intrinsic difficulty of the curriculum structure by considering the Blocking Factor, which quantifies the number of downstream courses dependent on a given course, and the Delay Factor, which measures the cumulative delay introduced by a course based on its position within the curriculum graph [14]. The Blocking Factor of a course \( v \) is defined as: \( \text {BlockingFactor}(v) = |\text {Descendants}(v)| \), representing the number of courses that are reachable from \( v \). The Delay Factor of a course \( v \) is computed as:

Consider a simple curriculum with three courses: \( A \) (no prerequisites, \( \text {PassRate}(A) = 0.9 \)), \( B \) (requires \( A \), \( \text {PassRate}(B) = 0.7 \)), and \( C \) (requires \( B \), \( \text {PassRate}(C) = 0.6 \)). Their Blocking Factor and Delay Factor values are:
-
\( \text {BlockingFactor}(A) = 2, \quad \text {DelayFactor}(A) = 3 \)
-
\( \text {BlockingFactor}(B) = 1, \quad \text {DelayFactor}(B) = 2 \)
-
\( \text {BlockingFactor}(C) = 0, \quad \text {DelayFactor}(C) = 1 \)
The Structural Complexity is \( 9 \), while Passability Complexity, incorporating pass rates, is computed as: \(5 \times 0.9 + 3 \times 0.7 + 1 \times 0.6 = 11.52\). This example highlights how Passability Complexity identifies high-risk bottlenecks that Structural Complexity alone may not capture. The combined use of these metrics enables institutions to pinpoint courses that disproportionately impact student success, assess curriculum modifications, and prioritize interventions for optimizing academic pathways.
4.5 Time Complexity Analysis
The computational efficiency of the Curricular Analytics App ensures scalability for large curricula. The Critical Path Analysis algorithm operates in linear time, first performing a topological sort in \( O(|V| + |E|) \), followed by delay computation for each course in \( O(|V| + |E|) \), maintaining an overall complexity of \( O(|V| + |E|) \). Monte Carlo simulation, modeling \( N \) students over \( T \) semesters, involves course selection in \( O(|V|) \), outcome simulation in \( O(|V|) \), and state updates per term. This results in a total complexity of \( O(N \cdot T \cdot |V|) \), which, while computationally intensive, benefits from parallelization for improved efficiency. The computation of Structural and Passability Complexity involves depth-first search for Blocking Factor in \( O(|V| + |E|) \), longest-path traversal for Delay Factor in \( O(|V| + |E|) \), and pass rate adjustments in \( O(|V|) \), ensuring the overall complexity remains \( O(|V| + |E|) \). Interactive visualization, including graph layout updates and critical path highlighting, operates in \( O(|V| + |E|) \), ensuring real-time responsiveness. Performance is further optimized through caching, parallel processing, and dynamic adjustments to prevent redundant computations. By leveraging these techniques, the app achieves timely, scalable, high-performance curriculum analysis, making it practical for institutional use.
5. EXAMPLE WALKTHROUGH
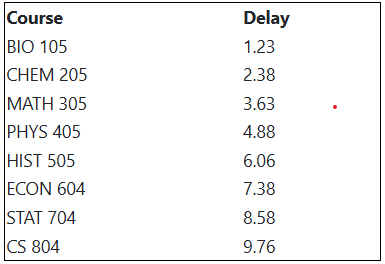
This section demonstrates how the Curricular Analytics App enables users to analyze curricula, identify bottlenecks, and evaluate student progression through an interactive workflow. The app supports curriculum upload, critical path analysis, graduation rate simulation, and complexity assessment, offering a streamlined approach to data-driven decision-making. Users begin by uploading a curriculum file in the prescribed Excel format, which includes course names, prerequisite relationships, and pass rates. The Upload Curriculum File section allows users to import data, which is then parsed and visualized as a directed acyclic graph (DAG), where nodes represent courses and edges indicate prerequisite dependencies. This visualization provides an intuitive overview of curriculum structure and highlights key dependencies. The curriculum graph (Figure 1) allows users to explore course relationships interactively. Nodes are color-coded based on attributes such as pass rates and critical path inclusion, while clicking on a node reveals detailed prerequisite and retake threshold information. Users can then navigate to the Critical Path tab, where the app highlights the longest sequence of courses that contribute to delays in student progression (Figure 2). A corresponding table (Figure 6) quantifies each course’s delay impact, helping administrators assess modifications such as prerequisite reductions or additional course offerings.
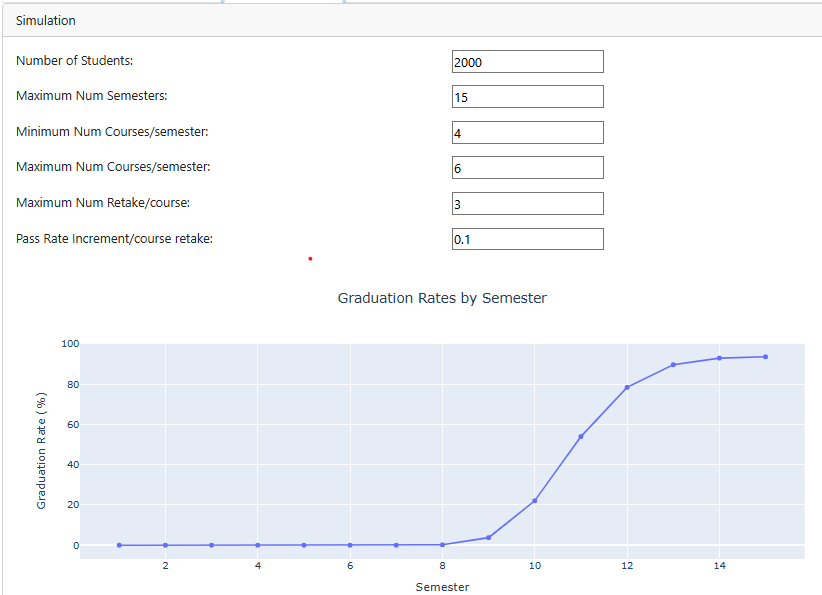
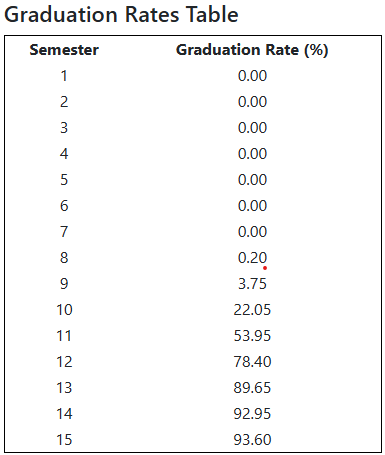
The Graduation Rate tab allows users to run Monte Carlo simulations, estimating the likelihood of students graduating within a given timeframe under varying conditions. Users configure parameters such as cohort size, course load limits, and pass rate adjustments. The app generates a graduation rate distribution plot (Figure 4) and a summary table (Figure 7), offering insights into expected graduation timelines and the impact of curriculum modifications.
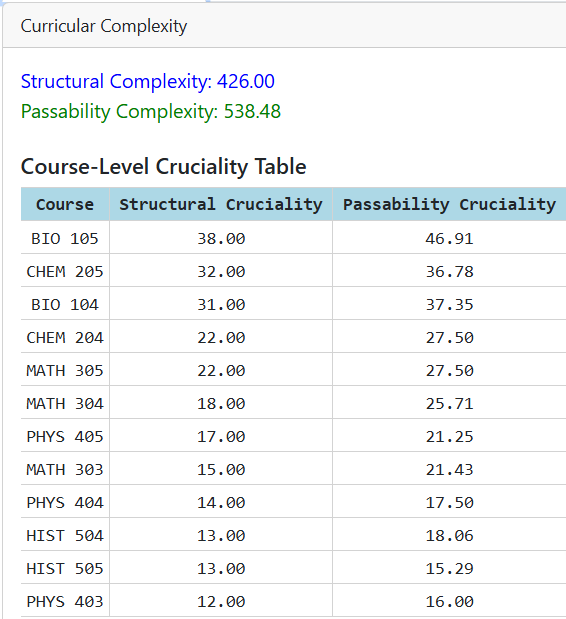
The Curricular Complexity tab provides an assessment of curriculum difficulty through Structural Complexity, which quantifies dependencies, and Passability Complexity, which incorporates pass rates. Users can analyze these metrics in a sortable table (Figure 5), dynamically observing how curriculum modifications affect complexity. This feature is particularly useful for balancing rigor and accessibility in curriculum design. This walkthrough highlights the app’s capabilities in visualizing curriculum structures, analyzing graduation rates, and assessing complexity. The integration of interactive tools enables educators and administrators to make data-driven decisions, optimizing academic pathways and improving student success.
6. CONCLUSION
The Curricular Analytics App offers a data-driven approach to curriculum analysis, integrating graph-based modeling and probabilistic simulations to address key challenges in higher education. By representing curricula as directed acyclic graphs and incorporating Monte Carlo simulations, the app provides insights into structural inefficiencies, student progression, and graduation rates. Critical Path Analysis highlights bottleneck courses, while the Passability Complexity metric extends traditional structural measures by factoring in course pass rates, identifying hidden obstacles to timely graduation. The app’s scalable algorithms and real-time editing capabilities enable institutions to dynamically assess curricular modifications, optimize resource allocation, and implement targeted interventions. Future areas or research include machine learning-based pass rate predictions, personalized course scheduling, and integration with learning management systems for real-time analytics. By equipping educators and administrators with actionable insights, the app supports evidence-based curriculum design, fostering more efficient and equitable academic pathways.
7. REFERENCES
- S. Alawadhi and M. H. Konsowa. Markov chain analysis and student academic progress: An empirical comparative study. Journal of Modern Applied Statistical Methods, 9, 2010.
- P. Baepler, J. D. Walker, and M. Driessen. It’s not about seat time: Blending, flipping, and efficiency in active learning classrooms. Computers & Education, 78:227–236, 2014.
- A. Brezavšček, M. Pejić Bach, and A. Baggia. Markov analysis of students’ performance and academic progress in higher education. Organizacija, 50(2):83–95, 2017.
- G. L. Heileman, C. T. Abdallah, A. Slim, and M. Hickman. Curricular analytics: A framework for quantifying the impact of curricular reforms and pedagogical innovations. CoRR, abs/1811.09676, 2018.
- M. S. Hickman. Development of a curriculum analysis and simulation library with applications in curricular analytics. Master’s thesis, University of New Mexico, December 2017.
- G. D. Kuh, J. Kinzie, J. H. Schuh, and E. J. Whitt. Student success in college: Creating conditions that matter. Jossey-Bass, 2005.
- G. D. Kuh and K. O’Donnell. Ensuring Quality and Taking High-Impact Practices to Scale. Association of American Colleges and Universities (AAC&U) Press, Washington, D.C., 2013.
- A. Slim. Curricular analytics in higher education. PhD thesis, The University of New Mexico, 2016.
- A. Slim, G. L. Heileman, C. T. Abdallah, A. Slim, and N. N. Sirhan. Restructuring curricular patterns using bayesian networks. In Proceedings of the International Conference on Educational Data Mining (EDM). Educational Data Mining (EDM), 2021.
- A. Slim, G. L. Heileman, M. Akbarsharifi, K. A. Manasil, and A. Slim. Causal inference networks: Unraveling the complex relationships between curriculum complexity, student characteristics, and performance in higher education. In 2024 ASEE Annual Conference & Exposition, 2024.
- A. Slim, G. L. Heileman, M. Hickman, and C. T. Abdallah. A geometric distributed probabilistic model to predict graduation rates. In 2017 IEEE SmartWorld, Ubiquitous Intelligence & Computing, Advanced & Trusted Computed, Scalable Computing & Communications, Cloud & Big Data Computing, Internet of People and Smart City Innovation (SmartWorld/SCALCOM/UIC/ATC/CBDCom/IOP/SCI), pages 1–8. IEEE, 2017.
- A. Slim, G. L. Heileman, H. A. Yusuf, Y. Zhang, A. Wasfi, M. Hayajneh, B. F. Mon, and A. Slim. Enhancing academic pathways: A data-driven approach to reducing curriculum complexity and improving graduation rates in higher education. In 2024 ASEE Annual Conference & Exposition, 2024.
- A. Slim, J. Kozlick, G. L. Heileman, and C. T. Abdallah. The complexity of university curricula according to course cruciality. In 2014 Eighth International Conference on Complex, Intelligent and Software Intensive Systems, pages 242–248. IEEE, 2014.
- A. Slim, J. Kozlick, G. L. Heileman, J. Wigdahl, and C. T. Abdallah. Network analysis of university courses. In Proceedings of the 23rd International Conference on World Wide Web, pages 713–718. ACM, 2014.
- A. Slim, H. A. Yusuf, N. Abbas, C. T. Abdallah, G. L. Heileman, and A. Slim. A markov decision processes modeling for curricular analytics. In 2021 20th IEEE International Conference on Machine Learning and Applications (ICMLA), pages 415–421. IEEE, 2021.
- V. Tinto. Leaving College: Rethinking the Causes and Cures of Student Attrition. University of Chicago Press, Chicago, IL, 1993.
- D. Torres, J. Crichigno, and C. Sanchez. Assessing curriculum efficiency through monte carlo simulation. Journal of College Student Retention: Research, Theory & Practice, 22(4):597–610, 2018.
© 2025 Copyright is held by the author(s). This work is distributed under the Creative Commons Attribution-NonCommercial-NoDerivatives 4.0 International (CC BY-NC-ND 4.0) license.