ABSTRACT
Solving a math word problem (MWP) requires understanding the mathematical components of the problem and an ability to decode the text. For some students, lower reading comprehension skills may make engagement with the mathematical content more difficult. Readability formulas (e.g., Flesch Reading Ease) are frequently used to assess reading difficulty. However, MWPs are typically shorter than the texts traditional readability formulas were designed to analyze. To identify metrics relevant to assessing the reading difficulty of MWPs, we identified 28 candidate features which may predict MWP readability. We then assessed the performance of 297,072 middle and high school students completing word problems in an intelligent tutoring system as part of standard educational practice. From this, we identified 4,446 (out of 9,421) problems where performance gaps between predicted less- and more-skilled readers were significantly larger than typical gaps between the groups. Finally, we tested how well the readability metrics could identify problems with performance gaps. Of five models tested, a random forest had the best predictive accuracy, AUC = .75. The findings suggest readability of the text played some role in less-skilled readers decreased performance and provide a path towards better understanding how to assess the readability of MWPs and make them more accessible to less-skilled readers.
Keywords
1. INTRODUCTION
Reading comprehension ability is a well establish predictor of math performance [3, 16, 48, 43, 44]. This relationship appears, at least in part, to be linked to the reading requirements inherent to solving math problems, especially math word problems (MWP)1 as interventions which support or eliminate reading have improved performance among less-skilled readers [1, 10, 18, 26, 44, 45]. Nevertheless, it is not clear what makes a MWP readable. Although improvements to text readability have improved outcomes in some cases, they have had little to no effect in others [32, 34, 45]. Studies which attempt to improve text readability often measure the improvement using traditional readability formulas or other text based metrics (e.g., [32, 34, 33]); however, it is not clear if these metrics are indicative of improved readability in a math domain [45, 44]. Improved understanding of how to evaluate MWPs for readability can help curriculum writers make MWPs more accessible, decreasing cognitive load related to reading comprehension and allowing students to focus on the math.
In this study, we took a data driven approach to first identify sets of MWPs where deviations in performance between more- and less-skilled readers were greater than expected. We then calculated 32 reading ability metrics for each problem, ranging from surface-level patterns to deeper structural elements, with the goal of assessing their ability to identify problems where less-skilled readers’ performance was lower than expected. Finally, we analyzed the feature space of the best performing model to understand which features were most important to the model fit.
1.1 Assessing Text Readability
Text readability can be assessed through multiple formulas, arguably the most famous of which is the Flesch Reading Ease (FRE) formula which was adapted into the Flesch-Kincaid Grade Level (FKGL) formula to provide a suggested grade level for a text [13, 22]. Early formulas, like the FRE, focused on the interactions between simple text metrics which could be readily measured and calculated by hand (e.g., number of words, average syllables per word, average words per sentence). Some of these formulas also integrated the prevalence of words in specific corpora (e.g., New Dale-Chall list of 3000 common words [7]) under the assumption that increased use of high frequency words in a text makes the text easier to read. These metrics are widely used and effective outside of a math domain, but their efficacy for MWPs is not understood [44].
These early formulas assessed some aspects of text complexity but they were not able to speak to others. Latent semantic analysis (LSA) filled one of these gaps, becoming an important index for understanding the coherence of a text [27, 30]. LSA constructs a term–document matrix from a corpus and applies singular value decomposition to generate low-dimensional vector representations of texts [14]. Alternatively, word embeddings learn dense word-level vectors from within large text corpora, allowing calculation of similarity scores to capture semantic overlap and thematic cohesion between texts [31, 35].
In a recent study, Walkington et al. [44] investigated a range of linguistic factors related to MWP difficulty in algebra. Prior research had suggested that vocabulary, and polysemous words in particular, were a factor in MWP readability, [11]; however, Walkington et al. found no significant effect of polysemy on problem-solving performance in their sample of algebra problems, suggesting the measure is context dependent in math and depends on the nature of the polysemous words.
Instead, Walkington et al. found that sentence count explained substantial variance in problem difficulty with performance on texts stretching over four sentences sharply declining. They also found that problems which had greater topical shifts between adjacent sentences predicted lower performance. While these findings address MWP readability in algebra, their generalizability to other mathematical domains remains uncertain. The inconsistent role of polysemy across studies highlights the need to identify broader factors affecting the readability of MWP that are not context dependent.
1.2 MATHia
The MPWs analyzed in this study are part of MATHia, an ITS for math learning used by hundreds of thousands of learners in the United States every year as a part of their math curriculum [37]. Problems in MATHia are presented to students as part of lessons on specific math topics. Most lessons are focused on mastery learning whereby students complete math problems in multiple steps, each associated with a particular skill [23]. Progress mastering the skills is tracked using Bayesian knowledge tracing [9]. A student must respond correctly to all steps in a problem before moving forward to the next problem. Most steps in a problem require free form entry; thus, completing a single step can result in multiple errors.
1.3 Assessing Reading Ability
Acquiring student reading ability estimates typically requires soliciting schools for their students’ end-of-year ELA scores. Richey et al. [36] suggested that reading ability data could be acquired for a larger proportion of an ITS’s user base by inferring reading ability based on performance on lessons not related to math. In MATHia, many students start their work for the year by completing an introductory lesson to familiarize themselves with MATHia and how to use its tools and features. Almoubayyed et al. [3] were able to use performance on this non-math based, introductory activity to make predictions about student’s reading ability. Specifically, a neural network model was trained using students’ performance in this introductory activity to predict whether a student would pass or fail the end-of-year ELA state exam score. The model achieved high accuracy with an area under receiver-operator characteristic curve (AUC) = 0.80 [3]. The model was also shown to generalize well on another district and for a different ELA state exam score with an AUC=0.76 [2]. We consider the lowest quartile of students on this metric (who are least likely to pass their end-of-year ELA state exam score) less-skilled at reading than the higher three quartiles.2
1.4 Present Study
We took a data driven approach to developing a model which can detect whether or not a math word problem may pose reading difficulties for less-skilled readers. We first identified problems where less skilled readers, as defined by the model developed in Almoubayyed et al. [3], had greater error rates than would otherwise be expected given baseline differences between more- and less-skilled readers within the ITS. Problems for which error rate differences exceeded expectations were considered flagged for potential readability concerns. We then trained five candidate models to discriminate between the flagged and non-flagged MWPs and tested their accuracy. Features in the models included 32 indices representing five types of readability metrics: basic text structure metrics, vocabulary metrics, syntactic and coherence metrics, and semantic analysis metrics. We included long-standing readability metrics as well as metrics which are not typically used to assess readability. A full explanation for each metric is provided in Section 2.2.
If a model with features representing text readability can accurately discriminate between MPWs flagged for readability concerns and those that are not flagged, it suggests that less-skilled readers error rates on these problems were driven in part by their reading comprehension. Examining the feature space of the model, including variable importance rankings, can provide additional insight into which readability metrics are important in a math domain.
2. METHOD
2.1 Problem Error Rates
All student data was collected from MATHia during the 2023-2024 school year and reflected student error rates on MWPs in mastery workspaces. Only students whose schools agreed to participate in research were included in the study. Because we were interested primarily in less-skilled readers performance, only students for whom we had reading ability predictions were included (n = 297,072 students). We defined less- and more-skilled readers relatively and within grade level. Students in the bottom quartile for each grade were classified as less-skilled and the remaining students as more-skilled readers. Each student completed 66 word problems on average, range = (1, 1030), n = 19,525,873 observations.
Problems in MATHia require students to complete multiple steps associated with specific skills and not all problems in a lesson provide opportunities for all skills in that lesson. As some combinations of skills are more difficult than others, error rates can fluctuate across problems in a workspace. Less-skilled readers tend to have higher error rates, i.e., \(\frac {\text {number of incorrect answers}}{\text {number of input fields}}\), than skilled readers on all math problems, not just those related to reading, M = 0.45, SE = 0.0002 for less-skilled readers in this sample and M = 0.35, SE = 0.0001 for more skilled readers. To compensate for this baseline difference, we calculated the mean difference in error rates for each combination of skills within a lesson. Subtracting the mean difference in error rates from a less-skilled reader’s individual error rate gave us their corrected error rate for that problem. We then used a Wilcox test to determine if corrected aggregate error rates for less-skilled readers were significantly higher than more skilled readers for a given problem. 4,446 out of 9,421 word problems across 74 workspaces showed significant deviation in error rates based on reading ability and were flagged for potential readability concerns.
2.2 Acquiring Readability Metrics
We took an exploratory approach to including candidate readability metrics. We first included multiple popular readability formulas. We next considered that even if the formula as a whole was not predictive of MWP readability, elements of the formula might be. Indeed, the simple measure of sentence count predicted significant variance in performance in Walkington et al. [44]. We then calculated measures of vocabulary complexity. Here we included Shannon entropy [38]. Though not a typical measure of readability, prediction of the next word in a sentence is believed to play a role in language processing [12, 25]. Texts with very low predictability may be difficult to process, reflecting low readability.
The fourth category reflected syntactic considerations within MWPs. These measures look at the structure and relationship among the sentences. Finally, semantic metrics consider the relationship between the text and other texts. Texts which repeat common patterns from other texts may be easier to process [29].
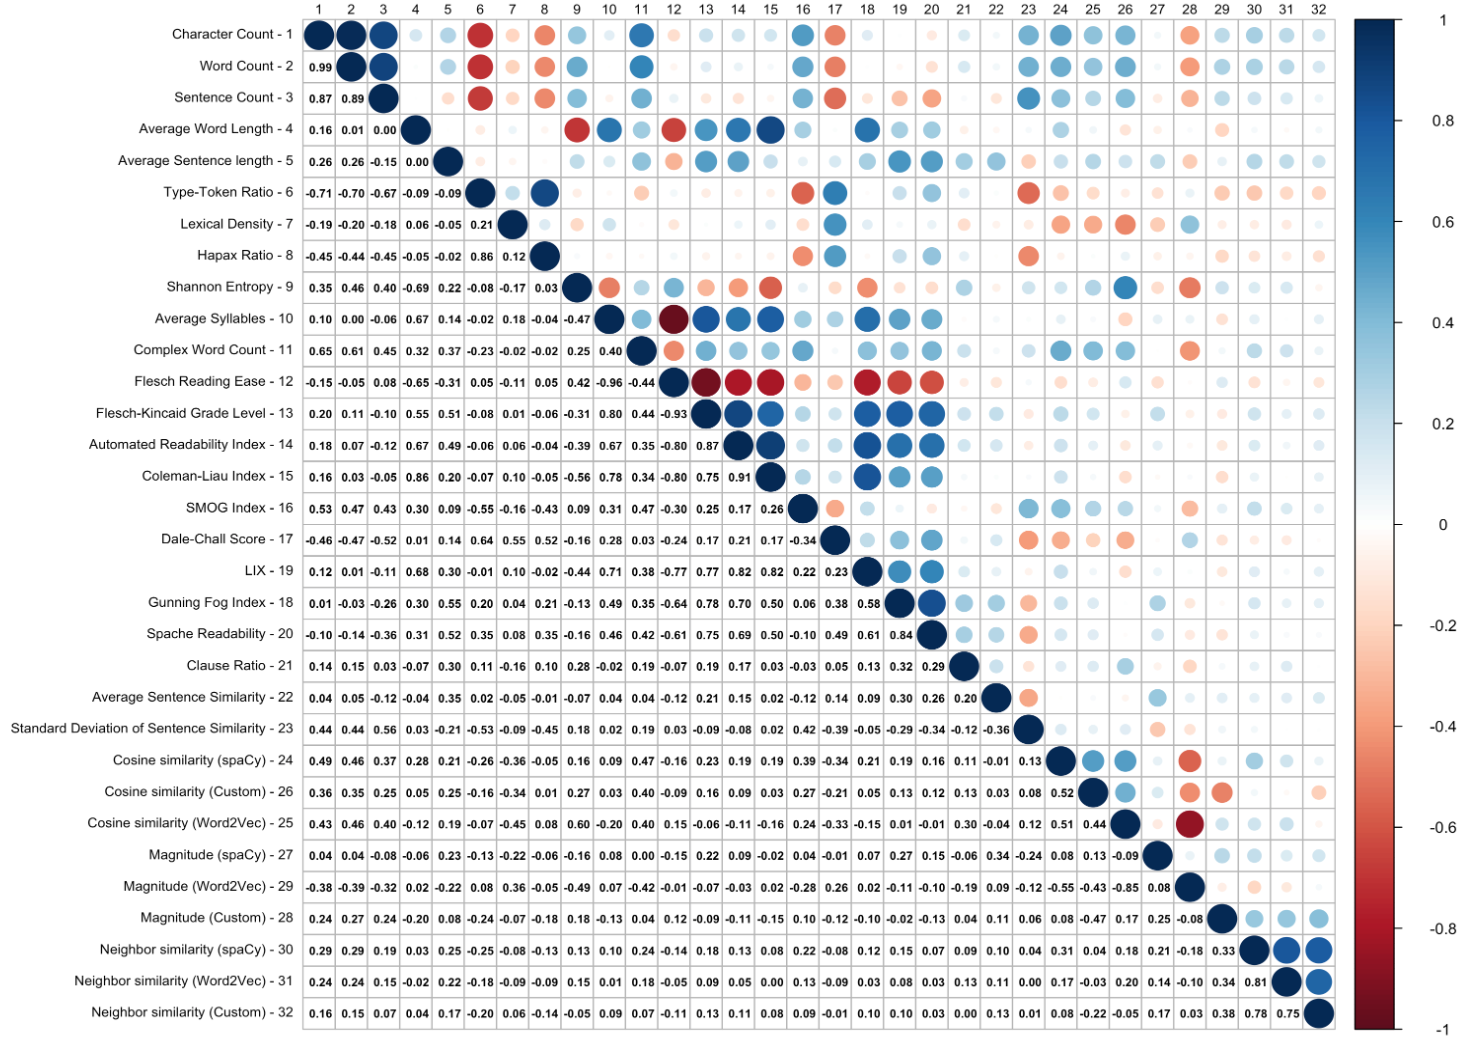
We included multiple sometimes correlating metrics in order evaluate a range of features, and nuances of each measure may affect their contributions to the models. Below we briefly define each of our 32 metrics. However, while we expected high correlation among the variables and included models robust to correlation in our analysis, some variables were nearly perfectly correlated, i.e., r > 0.90. When this occurred, we dropped one of the variables as it was nearly fully explained by an alternate variable. This left 28 metrics for inclusion in the models Figure 1 illustrates these correlations. Variables which were dropped are noted in their description below.
2.2.1 Traditional Readability Formulas
All traditional readability formulas were calculated using the textstat library [5]. For all metrics, except FRE, higher values indicate more difficult texts.
- Flesch Reading Ease (FRE): \(206.835 - 1.015 \times \text {ASL} - 84.6 \times \text {ASW}\), where ASW is average syllables per word and ASL is the average sentence length [13].
- Flesch-Kincaid Grade Level (FKGL): \(0.39 \times \text {ASL} + 11.8 \times \text {ASW} - 15.59\) [22]. FKGL is a modified form of FRE and their correlation is almost perfectly negative, r = -0.93. We kept FRE and dropped FKGL from additional analyses.
- Gunning Fog Index (GFI):
\(0.4 \times (\text {ASL} + 100 \times \frac {\text {complex words}}{\text {total words}})\) [17]. - Automated Readability Index (ARI):
\(4.71 \times (\frac {\text {characters}}{\text {words}}) + 0.5 \times \text {ASL} - 21.43\) [39]. - Coleman-Liau Index: \(0.0588L - 0.296S - 15.8\), where L is average number of letters per 100 words and S is average number of sentences per 100 words [28]. This metric correlated highly with ARI, r = 0.91. As ARI is generally considered more reliable for short texts, it was dropped from analysis.
- SMOG Index: \(1.043\sqrt {30 \times \frac {\text {complex words}}{\text {sentences}}} + 3.1291\) [39].
- New Dale-Chall (NDC): \(0.1579 \times (\frac {\text {difficult words}}{\text {words}} \times 100) + 0.0496 \times \text {ASL}\) where difficult words are words which do not occur in a corpus of 3,000 frequent words [7].
- LIX: \(\frac {\text {words}}{\text {sentences}} + \frac {\text {long words} \times 100}{\text {words}}\) [4].
- Spache Readability (SR): \(0.141 \times \text {ASL} + 0.086 \times \newline \text {percentage of unfamiliar words} + 0.839\) [40].
2.2.2 Basic Text Structure Metrics
All simple text characteristics were calculated using the Natural
Language Toolkit (NLTK) for tokenization [6].
- Character Count: Total number of characters excluding spaces correlated nearly perfectly with word count, r = .99, and was dropped from the analysis.
- Word Count (WC): Total number of tokens identified by NLTK’s word_tokenize() function
- Sentence Count (SC): Total number of sentences identified by NLTK’s sent_tokenize() function
- Average Word Length (AWL): Mean number of characters per word
- Average Sentence Length (ASL): Mean number of words per sentence
2.2.3 Vocabulary Metrics
Variables related to vocabulary were calculated using spaCy’s en_core_web_lg pipeline for lemmatization and token classification.
- Type-token Ratio (TTR): Ratio of unique lemmas to total words. Higher values indicate a wider range of vocabulary within the text.
- Lexical Density (LD): Ratio of content words (excluding stop words) to total words. Higher values indicate more information heavy text.
- Hapax Ratio (HR): Ratio of words appearing exactly once to total unique words. Higher values indicate a wider range of vocabulary within the text.
- Shannon Entropy (SE): \(H = -\sum _{i=1}^{n} p_i \log _2(p_i)\), where \(p_i\) is the probability
of word \(i\) appearing in the text, calculated as the
frequency of the word (according to
FreqDistinNLTK) divided by the total number of words in the text. - Average Syllables per Word (ASW): Average number of syllables in each word of the text. This variable correlated strongly with FRE, r = -0.93, and was dropped.
- Complex Word Count (CWC): Number of words with three or more syllables
2.2.4 Syntactic and Coherence Metrics
Measures related to the syntax of the text were calculated using
spaCy’s dependency parser [19].
- Clause Ratio (CR): Ratio of dependent clauses to total clauses
- Mean Sentence Similarity (MSS): Mean cosine similarity between consecutive sentence vectors reflects the coherence of sentence pairs. When a text had only one sentence (n = 221), this value was set to 1 to reflect perfect coherence with itself.
- Standard Deviation of Sentence Similarity (SDSS): Standard deviation of cosine similarities between consecutive sentence vector reflects the variation in coherence between sentence pairs. When a text had only one or two sentences (n = 980), this value was set to 0 to reflect lack of variation in the mean.
2.2.5 Semantic Metrics
Vector representations were generated using three methods:
spaCy’s en_core_web_lg document embeddings, pre-trained
Word2Vec embeddings from Google News accessed via gensim,
and custom, latent semantic analysis based, document
embeddings generated using TF-IDF vectorization followed by
dimensionality reduction (Truncated SVD) on a corpus of
31,008 MATHia problems (each problem having at least one
sentence and more than seven words of text). We included
custom document embeddings because semantic overlap with
other math problems may be more informative to readability
than overlap with more general text embeddings. We denoted
these variables by what they measure and their vector
representations (e.g., spaCy Cosine Similarity, gensim Cosine
Similarity, Custom Cosine Similarity).
For each vector representation, we computed three metrics creating 9 variables:
- Cosine similarity (CS): Cosine similarity between each problem’s vector and the corpus centroid (the mean of all problem vectors) to assess how typical a problem’s language is relative to the full corpus.
- Magnitude (M): Euclidean norm of the 100-dimensional for custom LSA embedding and 300 dimensions for the pooled spaCy and Word2Vec embeddings. Higher values indicate greater semantic coherence or alignment with dominant topics in the corpus.
- Neighbor similarity (NS): The mean cosine similarity between a problem’s vector and its five nearest neighbors. This reflects how consistent or typical the language is within a local group of similar texts.
2.3 Model Selection and Evaluation
After flagging problems as posing potential readability concerns for less-skilled readers, we sought to test how well readability metrics could classify problems as flagged or not flagged. The problems were spread across 72 different lessons and a given problem within a lesson had more similar text features to other problems within the same lesson than to the broader set problems. We included lesson type as a final predictive variable in the models to account for this variation between lessons. The readability metrics account for additional variance beyond what can be explained by lesson type alone.
Scenarios for MWPs in MATHia are sometimes repeated across multiple problems. Each problem may have different numbers, names, or minor contextual deviations, but problems within a given scenario are more similar to one another than to the broader set of MATHia problems. To avoid over fitting, we split the data into training and test sets, assigning 80% of the scenarios to training and 20% to testing. Thus, performance on the test set reflects the model’s ability to generalize to new scenarios.
We evaluated five models with the following configurations:
- Random Forest (RF): We trained a random forest
classifier using the
rangerpackage with 1000 trees and
permutation-based variable importance measures [46]. Hyperparameter optimization via grid search yielded a final model with anmtryvalue of 5, the Gini impurity criterion for node splitting, and a minimum node size of 10 observations. - Elastic Net: A penalized logistic regression was implemented using the Elastic Net method with \(\alpha = 0.5\), combining L1 (LASSO) and L2 (Ridge) regularization [47, 15]. The lambda parameter was tuned over a sequence of 10 values ranging from 0.001 to 0.1.
- Boosted Model: We implemented gradient boosting using XGBoost for binary classification [8]. The model was configured with 100 boosting rounds, a maximum tree depth of 6, and a learning rate of 0.3. To mitigate over fitting, both column and row subsampling were applied at 80%, and the minimum child weight was set to 1.
- Neural Network: A feed-forward neural network was
developed using the
nnetpackage [42]. The network architecture was optimized by testing 5 candidate configurations. The model was trained for a maximum of 1000 iterations with early stopping criteria to ensure convergence without over fitting. - Support Vector Machine (SVM): An SVM classifier using a Radial Basis Function (RBF) kernel was employed for non-linear classification, with default hyperparameters [41, 20].
We tested the random forest for its ability to capture non-linear relationships and handle interactions, an elastic net to examine linear relationships while managing multicollinearity, a boosted model for its iterative optimization, a neural net for potential complex patterns, and an SVM for its effectiveness with high-dimensional data. This diverse set of approaches helped identify which modeling strategy best captured the relationships between our predictors and readability metrics.
All models were trained using 3-fold cross-validation with the
caret package in R for statistical programming [24]. Model
performance was evaluated using the Area Under the Receiver
Operating Characteristic curve (ROC-AUC).
3. RESULTS
3.1 Descriptive Statistics
Table A.1 in Appendix A provides all mean and standard error values for each metric split by whether or not the problems was flagged for potential readability concerns. Although some metric comparisons showed no visible difference in values based on problem flag (e.g., FRE: M=82 for both groups), others demonstrated larger differences, particularly in structural elements like word count (M=82 for non-flagged problems vs. M=70 for flagged) and sentence count (M=5.5 for flagged problems vs. M=4.8 for non-flagged problems. Both of these mean differences are informative on their own. Shorter texts appear at face value to be associated with problems that are more difficult for less-skilled readers than we would typically expect. However, mean differences may mask more complex patterns in the data. Following analysis of variable importance, we looked at the shape of the relationships between the top four variables and the problems inferred readability.
3.2 Models
Fit statistics for each model are provided in Table 1. The random forest had the best overall performance on the hold out test set. The results and variable importance rankings (see Table 2) suggest that after accounting for features of specific lessons, readability characteristics are able to account for some remaining variance with four of the five types of variables included in this study emerging as the most important readability metrics.
| Model Type | AUC | Acc. | Sens. | Spec. |
|---|---|---|---|---|
| Random Forest | 0.75 | 0.70 | 0.69 | 0.71 |
| Elastic Net | 0.65 | 0.60 | 0.67 | 0.52 |
| XGBoost | 0.62 | 0.578 | 0.67 | 0.47 |
| SVM | 0.69 | 0.65 | 0.72 | 0.57 |
| Neural Net | 0.65 | 0.62 | 0.67 | 0.56 |
| Variable | Importance |
|---|---|
| Lesson | 100.00 |
| Word Count | 28.99 |
| Custom Magnitude | 20.13 |
| Type-Token Ratio | 19.86 |
| Clause Ratio | 19.24 |
| Mean Sentence Similarity | 18.33 |
| spaCy Cosine Similarity | 17.63 |
| Standard Deviation of Sentence Similarity | 17.35 |
| Word2Vec Cosine Similarity | 15.70 |
| Custom Neighbor Similarity | 15.29 |
| Hapax Ratio | 15.07 |
| spaCy Neighbor Similarity | 14.84 |
| Word2Vec Neighbor Similarity | 14.65 |
| Shannon Entropy | 14.61 |
| Sentence Count | 13.35 |
| Smog Index | 10.92 |
| Spache Readability | 9.03 |
| Dale Chall Score | 7.29 |
| Custom Cosine Similarity | 6.97 |
| Word2Vec Magnitude | 6.05 |
| Gunning Fog Index | 5.13 |
| Automated Readability Index | 4.27 |
| spaCy Magnitude | 3.99 |
| Average Word Length | 3.90 |
| Lexical Density | 3.56 |
| Average Sentence Length | 3.55 |
| Complex Word Count | 2.83 |
| Flesch Reading Ease | 2.18 |
| LIX | 0.00 |
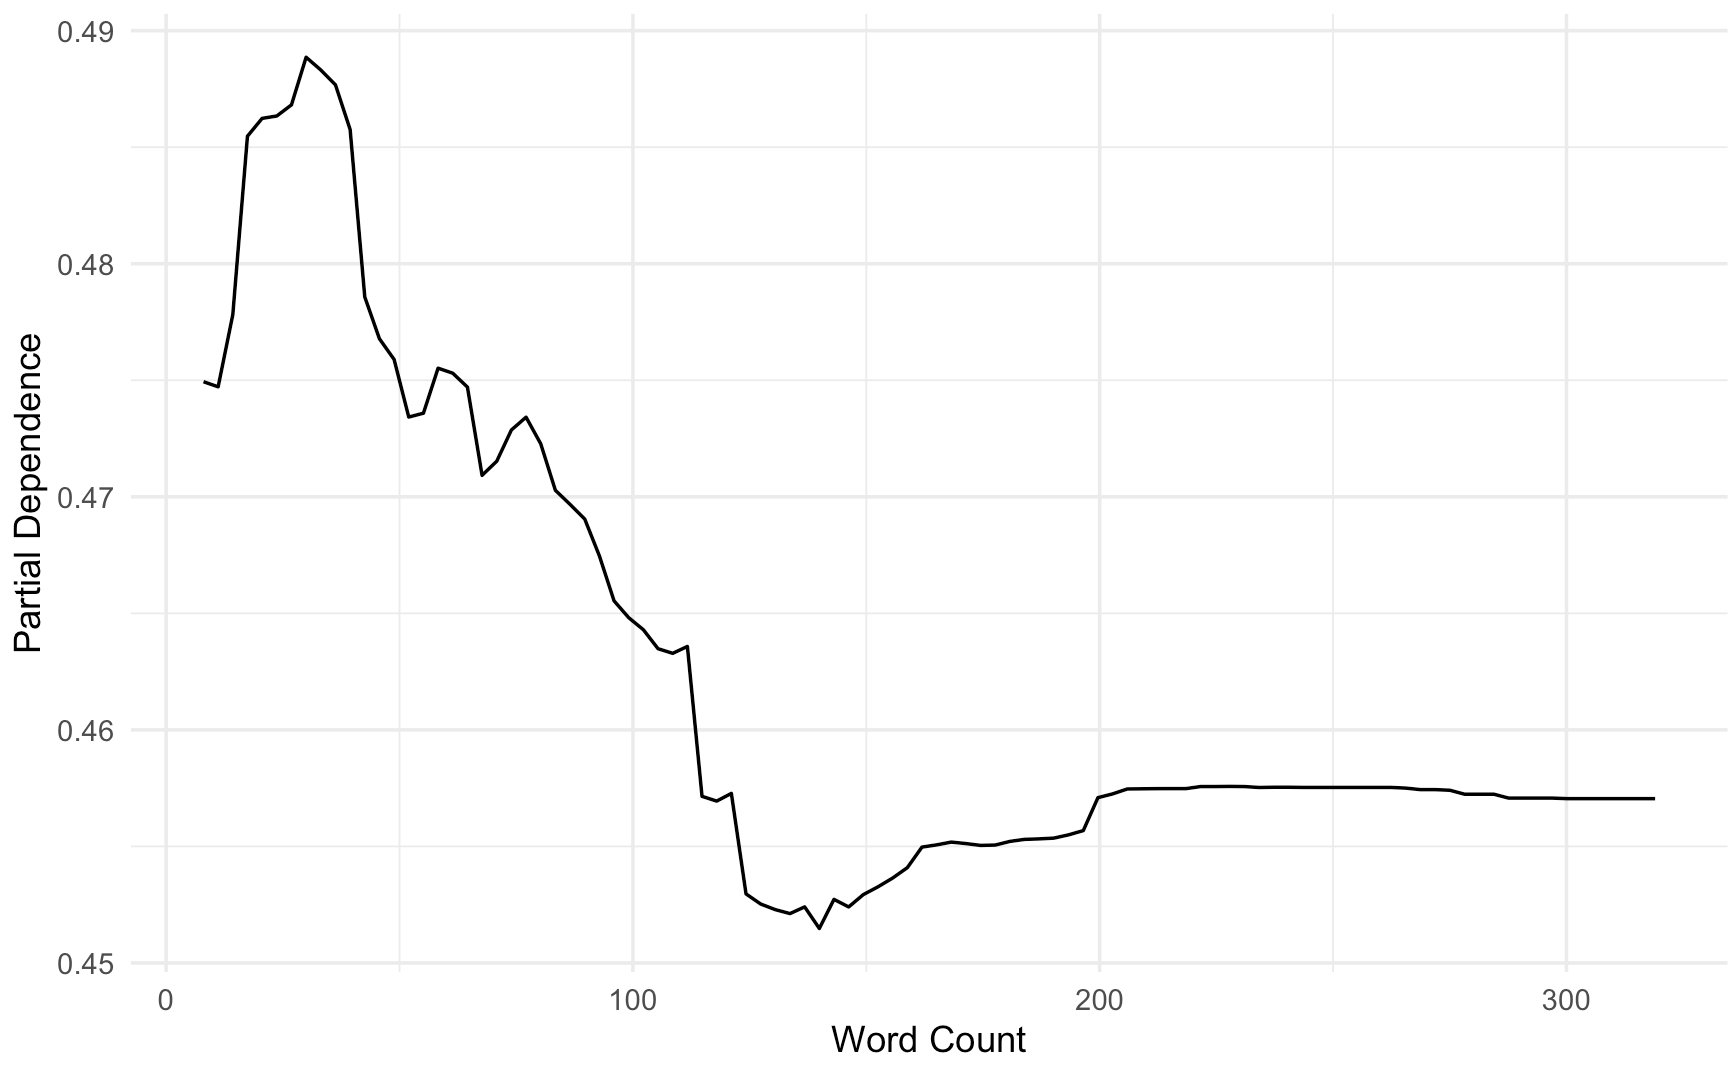
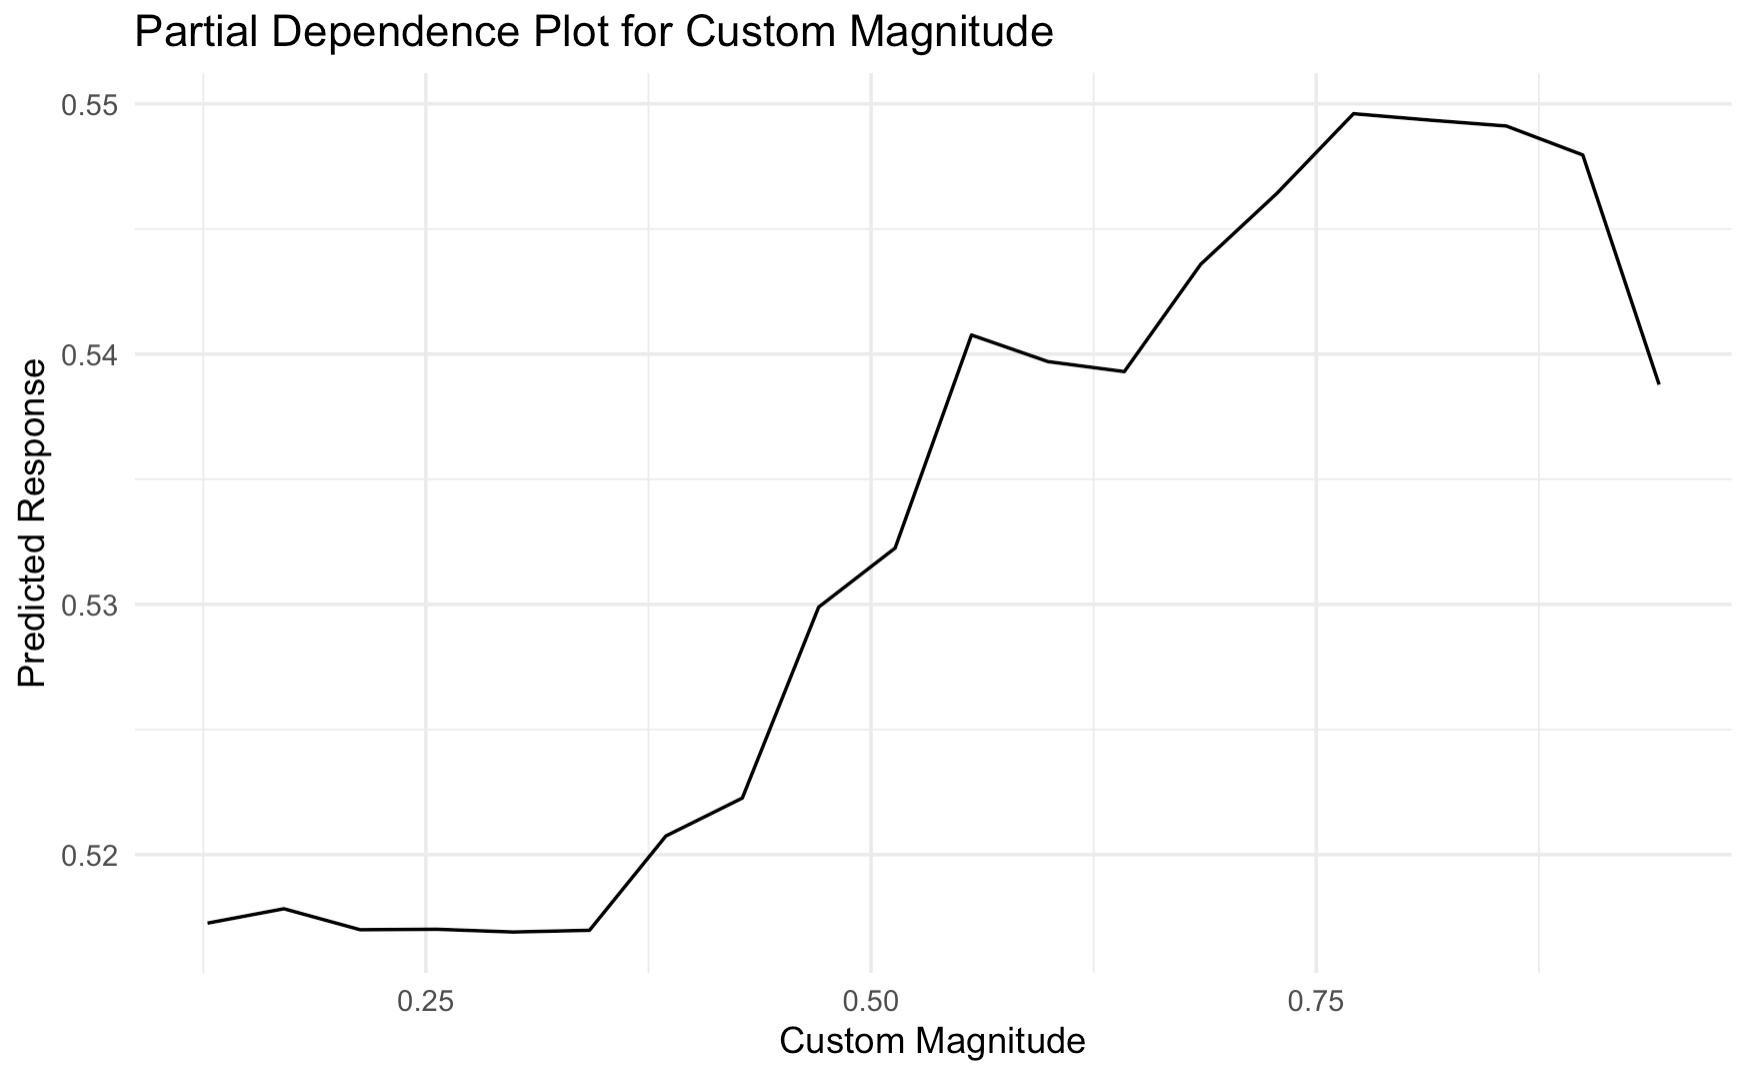
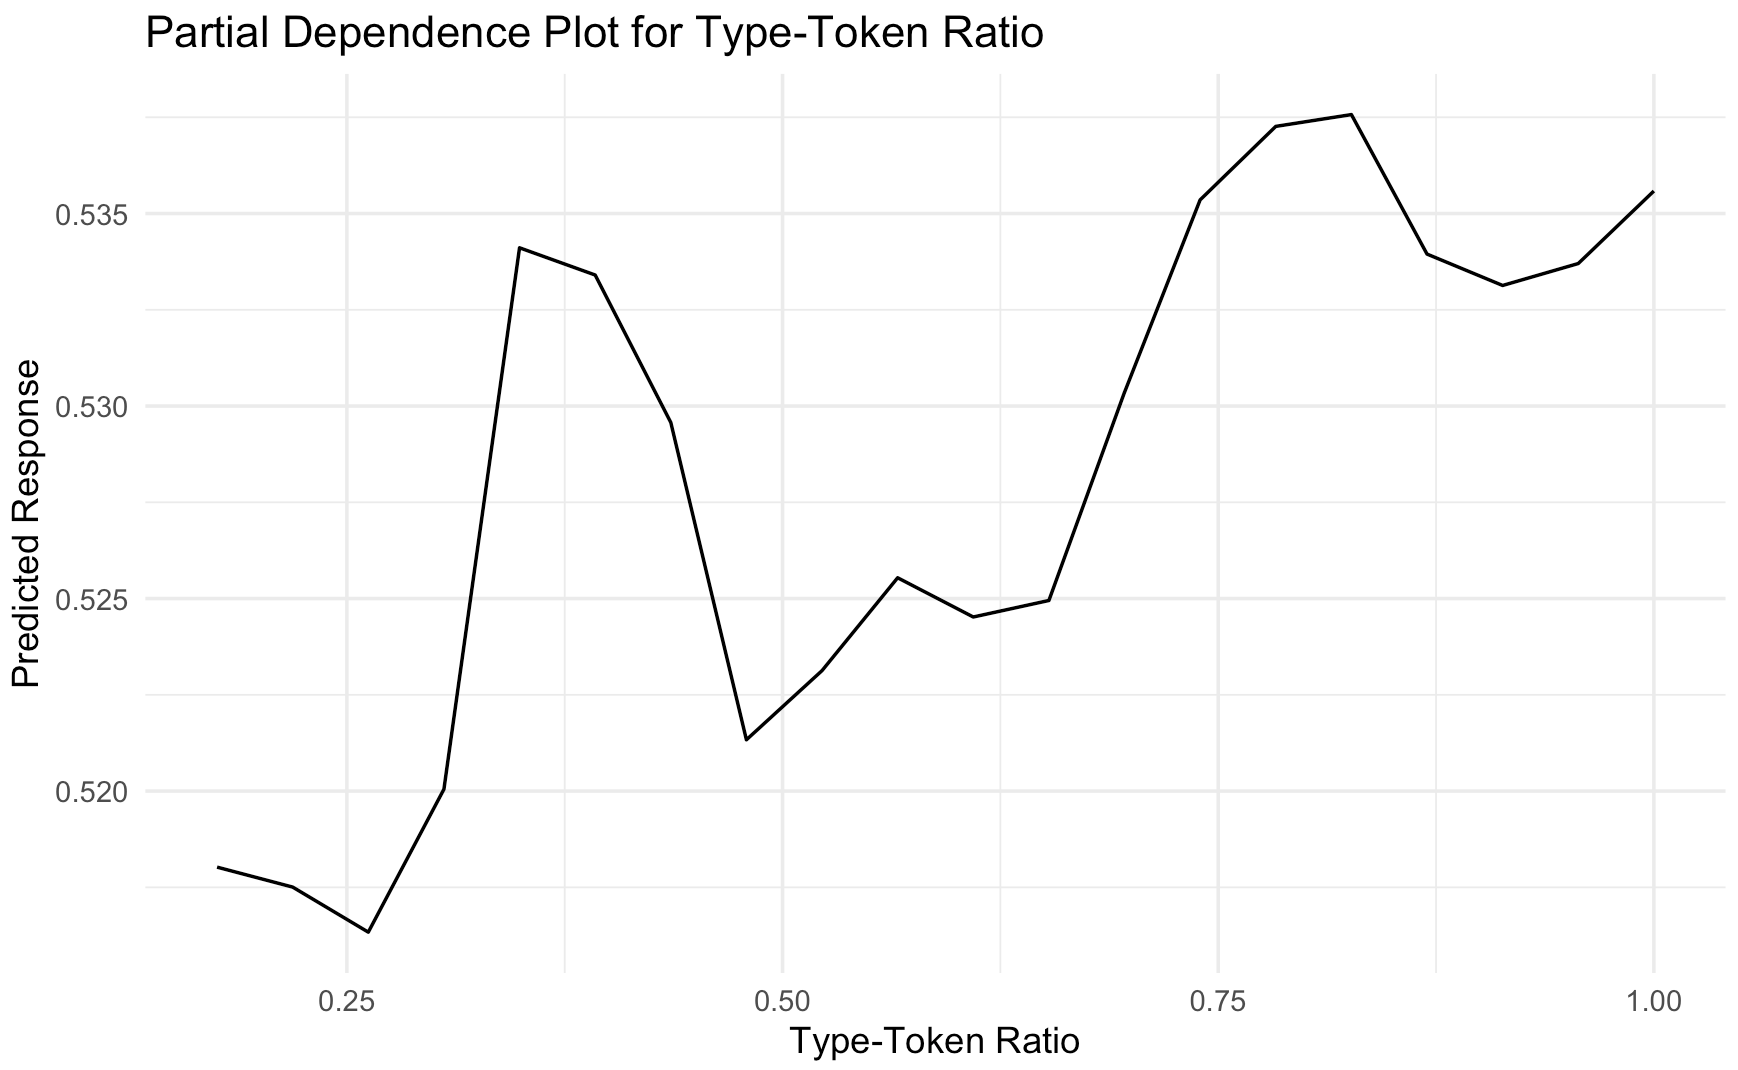
Partial dependence plots can aid in understanding the outcomes of a random forest as they show how a feature affects the predicted outcome. Figure 2 shows the partial dependence plots for the top 4 readability metrics. The plots reveal non-linear relationships which generally show that higher values of each variable are more likely to predict a problem to be flagged for potential readability issues. Reversing the pattern in the means, higher word counts were associated with higher probability that the model would classify a problem as having potential poor readability. Similarly straight forward relationships were visible for clause ratio and custom magnitude. Having more dependent clauses as compared to independent clauses led the model to give the MWP a higher probability of having poor readability. Higher custom magnitude values, indicating more specific or distinctive semantic content, were also associated with increased probability of readability concerns. However, type-token ratio showed a more complex pattern, where both very low and very high lexical diversity appeared to increase text difficulty, suggesting that some lexical variation may support reading comprehension of MWPs.

4. DISCUSSION & CONCLUSION
Solving math word problems requires both mathematical knowledge and reading comprehension ability [44]. For less-skilled readers, the language of math problems can pose a significant barrier to accessing the math content. This study aimed to identify linguistic features that predict readability of MWPs for these students. Using data from MATHia, we first identified problems where less-skilled readers struggled more than expected. We then calculated a range of linguistic metrics for these problems and used them to train a random forest which can predict the probability that a less-skilled reader will struggle with a problem. Analysis of the variable importance revealed several key insights into understanding linguistic features important to MWP readability.
First, traditional readability metrics were not important to the
model’s performance. The smog index was the highest ranking
of these but fell below most other features. Second, custom LSA
magnitude emerged as more important to the model than
magnitude calculated using SpaCy or Word2Vec and as more
important than measures of distance between texts. This finding
highlights the potential for using document embeddings from a
specialized corpus of MWPs. Finally, the top four variables after
‘Lesson’ represented distinct categories with word count being
the most important to the model. Partial dependence plots of
these variables suggested the relationships were not linear and
had sharp boundaries. Any model or formula developed to
assess MWP readability will need to be account for this
non-linearity.
These findings illustrate the difficulty in identifying readability metrics which are important to improving comprehension of MWPs. Although the model was able to distinguish between MWPs where less-skilled readers had more or less difficulty, typical measures of readability were not important to these predictions. Instead, a simple measure of word count was most important to the model. It is possible that MWPs with higher word counts are intimidating to less-skilled readers, prompting less engagement and greater tendency to rely on hints or guessing. However, recent findings using these same word problems found that such behaviors actually decline as word count increases [21]. Given these findings, it seems more likely that the importance of word count reflects the greater demand on reading for longer texts where critical information is embedded in longer narratives.
The findings here highlight the need for a more refined approach to text simplification in educational materials. Readability assessment of MWPs may require the development of an MWP corpus of problems to establish a semantic space against which new problems can be evaluated. Future research should explore and test interventions that optimize specific linguistic factors to enhance accessibility and comprehension for struggling readers. This research may unlock additional insights into how to write readable MWPs, ultimately improving equity in math education.
4.0.1
This work was supported, in whole or in part, by the Gates Foundation INV-060877. The conclusions and opinions expressed in this work are those of the author(s) alone and shall not be attributed to the Foundation. Under the grant conditions of the Foundation, a Creative Commons Attribution 4.0 License has already been assigned to the Author Accepted Manuscript version that might arise from this submission.
5. REFERENCES
- H. Almoubayyed, R. Bastoni, S. R. Berman, S. Galasso, M. Jensen, L. Lester, A. Murphy, M. Swartz, K. Weldon, S. E. Fancsali, et al. Rewriting math word problems to improve learning outcomes for emerging readers: a randomized field trial in carnegie learning’s mathia. In International Conference on Artificial Intelligence in Education, pages 200–205. Springer, 2023.
- H. Almoubayyed, S. Fancsali, and S. Ritter. Generalizing predictive models of reading ability in adaptive mathematics software. In Proceedings of the 16th International Conference on Educational Data Mining, 2023.
- H. Almoubayyed, S. E. Fancsali, and S. Ritter. Instruction-embedded assessment for reading ability in adaptive mathematics software. In LAK23: 13th International Learning Analytics and Knowledge Conference, pages 366–377, 2023.
- J. Anderson. Lix and rix: Variations on a little-known readability index. Journal of Reading, 26(6):490–496, 1983.
- S. Bansal and C. Aggarwal. textstat: Calculate statistics from text.
- S. Bird, E. Klein, and E. Loper. Natural language processing with Python: analyzing text with the natural language toolkit. " O’Reilly Media, Inc.", 2009.
- J. S. Chall and E. Dale. Readability revisited: The new Dale-Chall readability formula. Brookline Books, 1995.
- T. Chen and C. Guestrin. Xgboost: A scalable tree boosting system. In Proceedings of the 22nd acm sigkdd international conference on knowledge discovery and data mining, pages 785–794, 2016.
- A. T. Corbett and J. R. Anderson. Knowledge tracing: Modeling the acquisition of procedural knowledge. User Modeling and User-Adapted Interaction, 4(4):253–278, 1994.
- D. D. Cummins, W. Kintsch, K. Reusser, and R. Weimer. The role of understanding in solving word problems. Cognitive psychology, 20(4):405–438, 1988.
- G. Daroczy, M. Wolska, W. D. Meurers, and H.-C. Nuerk. Word problems: A review of linguistic and numerical factors contributing to their difficulty. Frontiers in psychology, 6:348, 2015.
- K. D. Federmeier. Thinking ahead: The role and roots of prediction in language comprehension. Psychophysiology, 44(4):491–505, 2007.
- R. Flesch. A new readability yardstick. Journal of applied psychology, 32(3):221, 1948.
- P. W. Foltz, W. Kintsch, and T. K. Landauer. The measurement of textual coherence with latent semantic analysis. Discourse processes, 25(2-3):285–307, 1998.
- J. H. Friedman, T. Hastie, and R. Tibshirani. Regularization paths for generalized linear models via coordinate descent. Journal of statistical software, 33:1–22, 2010.
- K. J. Grimm. Longitudinal Associations Between Reading and Mathematics Achievement. Developmental Neuropsychology, 33(3):410–426, Apr. 2008.
- R. Gunning. The fog index after twenty years. Journal of Business Communication, 6(2):3–13, 1969.
- R. Helwig, M. A. Rozek-Tedesco, G. Tindal, B. Heath, and P. J. Almond. Reading as an access to mathematics problem solving on multiple-choice tests for sixth-grade students. The Journal of Educational Research, 93(2):113–125, 1999.
- M. Honnibal, I. Montani, S. Van Landeghem, and A. Boyd. spaCy: Industrial-strength Natural Language Processing in Python. 2020.
- A. Karatzoglou, A. Smola, K. Hornik, and A. Zeileis. kernlab-an s4 package for kernel methods in r. Journal of statistical software, 11:1–20, 2004.
- P. Khanna, K. Mathieu, K. Norberg, H. Almoubayyed, and S. E. Fancsali. Math content readability, student reading ability, and behavior associated with gaming the system in adaptive learning software. In Proceedings of the Eighteenth International Conference on Educational Data Mining (EDM 2025), Palermo, Sicily, Italy, July 2025. International Educational Data Mining Society. Accepted; to appear.
- J. P. Kincaid, R. P. Fishburne Jr, R. L. Rogers, and B. S. Chissom. Derivation of new readability formulas (automated readability index, fog count and flesch reading ease formula) for navy enlisted personnel. Technical report, Naval Technical Training Command Millington TN Research Branch, 1975.
- K. R. Koedinger, A. T. Corbett, and C. Perfetti. The knowledge-learning-instruction framework: Bridging the science-practice chasm to enhance robust student learning. Cognitive Science, 36(5):757–798, 2012.
- M. Kuhn. Building predictive models in r using the caret package. Journal of statistical software, 28:1–26, 2008.
- M. Kutas and K. D. Federmeier. Thirty years and counting: finding meaning in the n400 component of the event-related brain potential (erp). Annual review of psychology, 62(1):621–647, 2011.
- J. H. Lamb. Reading grade levels and mathematics assessment: An analysis of texas mathematics assessment items and their reading difficulty. The Mathematics Educator, 20(1), 2010.
- T. K. Landauer and S. T. Dumais. A solution to plato’s problem: The latent semantic analysis theory of acquisition, induction, and representation of knowledge. Psychological review, 104(2):211, 1997.
- T. L. Liau, C. B. Bassin, C. J. Martin, and E. B. Coleman. Modification of the coleman readability formulas. Journal of Reading Behavior, 8(4):381–386, 1976.
- D. S. McNamara and A. C. Graesser. Coh-metrix: An automated tool for theoretical and applied natural language processing. In Applied natural language processing: Identification, investigation and resolution, pages 188–205. IGI Global, 2012.
- D. S. McNamara, M. M. Louwerse, P. M. McCarthy, and A. C. Graesser. Coh-metrix: Capturing linguistic features of cohesion. Discourse Processes, 47(4):292–330, 2010.
- T. Mikolov, K. Chen, G. Corrado, and J. Dean. Efficient estimation of word representations in vector space. arXiv preprint arXiv:1301.3781, 2013.
- K. A. Norberg, H. Almoubayyed, L. De Ley, A. Murphy, K. Weldon, and S. Ritter. Rewriting content with gpt-4 to support emerging readers in adaptive mathematics software. International Journal of Artificial Intelligence in Education, pages 1–40, 2024.
- N. Patel, P. Nagpal, T. Shah, A. Sharma, S. Malvi, and D. Lomas. Improving mathematics assessment readability: Do large language models help? Journal of Computer Assisted Learning, 39(3):804–822, 2023.
- D. J. Paul, W. H. Nibbelink, and H. D. Hoover. The effects of adjusting readability on the difficulty of mathematics story problems. Journal for Research in Mathematics Education, 17(3):163–171, 1986.
- J. Pennington, R. Socher, and C. D. Manning. Glove: Global vectors for word representation. In Proceedings of the 2014 conference on empirical methods in natural language processing (EMNLP), pages 1532–1543, 2014.
- J. E. Richey, N. G. Lobczowski, P. F. Carvalho, and K. Koedinger. Comprehensive Views of Math Learners: A Case for Modeling and Supporting Non-math Factors in Adaptive Math Software. In I. I. Bittencourt, M. Cukurova, K. Muldner, R. Luckin, and E. Millán, editors, Artificial Intelligence in Education, volume 12163 of Lecture Notes in Computer Science, pages 460–471. Springer International Publishing, Cham, 2020.
- S. Ritter, J. R. Anderson, K. Koedinger, and A. T. Corbett. Cognitive tutor: Applied research in mathematics education. Psychonomic Bulletin & Review, 14:249–255, 2007.
- C. E. Shannon. A mathematical theory of communication. The Bell system technical journal, 27(3):379–423, 1948.
- E. A. Smith and R. Senter. Automated readability index, volume 66. Aerospace Medical Research Laboratories, 1967.
- G. Spache. A new readability formula for primary-grade reading materials. The Elementary School Journal, 53(7):410–413, 1953.
- V. Vapnik. Support-vector networks. Machine learning, 20:273–297, 1995.
- W. N. Venables and B. D. Ripley. Modern Applied Statistics with S. Springer, New York, fourth edition, 2002. ISBN 0-387-95457-0.
- P. M. Vilenius-Tuohimaa, K. Aunola, and J.-E. Nurmi. The association between mathematical word problems and reading comprehension. Educational Psychology, 28(4):409–426, 2008.
- C. Walkington, V. Clinton, and P. Shivraj. How readability factors are differentially associated with performance for students of different backgrounds when solving mathematics word problems. American Educational Research Journal, 55(2):362–414, 2018.
- L. Wiest. Comprehension of mathematical text. Philosophy of mathematics education journal, 17:458, 2003.
- M. N. Wright and A. Ziegler. ranger: A fast implementation of random forests for high dimensional data in c++ and r. Journal of statistical software, 77:1–17, 2017.
- H. Zou and T. Hastie. Regularization and variable selection via the elastic net. Journal of the Royal Statistical Society Series B: Statistical Methodology, 67(2):301–320, 2005.
- M. Österholm. Characterizing Reading Comprehension of Mathematical Texts. Educational Studies in Mathematics, 63(3):325–346, Nov. 2006.
APPENDIX
A. APPENDIX A
| Metric | Not Flagged | Flagged Less Readable
| ||
|---|---|---|---|---|
| Mean (SD) | Range | Mean (SD) | Range | |
| Readability Indices
| ||||
| FRE | 82 (12) | 15–115 | 82 (12) | 16–114 |
| GFI | 6.5 (1.8) | 2.1–15.3 | 6.5 (1.8) | 1.6–14.8 |
| ARI | 6.01 (2.4) | -1.9–15.7 | 6.04 (2.4) | -1.6–15.9 |
| SMOG | 7.4 (3.0) | 0–15.6 | 6.5 (3.6) | 0–15.6 |
| NDC | 7.8 (1.3) | 5.2–14.2 | 8.1 (1.4) | 5.3–15.7 |
| LIX | 31.6 (8.6) | 5.6–65 | 31.4 (8.5) | 7.3–65 |
| SR | 3.5 (0.7) | 1.6–6.7 | 3.6 (0.7) | 1.9–6.6 |
| Basic Text Metrics
| ||||
| WC | 82 (44) | 8–319 | 70 (38) | 10–318 |
| SC | 5.5 (2.7) | 1–17 | 4.8 (2.4) | 1–16 |
| AWL | 4.0 (0.4) | 2.7–6.3 | 4.0 (0.4) | 2.7–5.5 |
| ASL | 15.0 (3.5) | 5–36 | 15.1 (3.6) | 5–35 |
| Vocabulary Metrics
| ||||
| TTR | 0.57 (0.2) | 0.2–1 | 0.59 (0.2) | 0.2–1 |
| LD | 0.57 (0.06) | 0.4–1 | 0.58 (0.06) | 0.4–1 |
| HR | 0.62 (0.1) | 0.1–1 | 0.64 (0.1) | 0.1–1 |
| SE | 1.51 (0.1) | 0.8–1.9 | 1.49 (0.1) | 1.0–1.9 |
| CWC | 7.1 (4.0) | 0–22 | 6.4 (3.5) | 0–22 |
| Syntactic and Coherence Metrics
| ||||
| CR | 0.52 (0.4) | 0–3 | 0.48 (0.4) | 0–2.5 |
| MSS | 0.71 (0.1) | 0.2–1 | 0.70 (0.1) | 0.0–1 |
| SDSS | 0.1 (0.1) | 0–0.4 | 0.1 (0.1) | 0–0.4 |
| Semantic Similarity
| ||||
| Cosign Similarity
| ||||
| Custom | 0.40 (0.1) | 0.1–0.8 | 0.39 (0.1) | 0.0–0.8 |
| SpaCy | 0.88 (0.07) | 0.3–1 | 0.87 (0.07) | 0.3–1 |
| W2V | 0.79 (0.07) | 0.4–0.9 | 0.78 (0.07) | 0.3–0.9 |
| Magnitude
| ||||
| Custom LSA | 0.5 (0.2) | 0.1–0.9 | 0.5 (0.1) | 0.1–0.9 |
| SpaCy | 29.5 (2.7) | 20–40 | 29.1 (2.8) | 19–40 |
| W2V | 1.0 (0.1) | 0.8–2.0 | 1.0 (0.1) | 0.8–2.2 |
| Neighbor Similarity
| ||||
| Custom | 1.0 (0.1) | 0.6–1 | 1.0 (0.1) | 0.6–1 |
| SpaCy | 1.0 (0.0) | 0.9–1 | 1.0 (0.0) | 0.7–1 |
| W2V | 1.0 (0.0) | 0.7–1 | 1.0 (0.0) | 0.8–1 |
1Math word problems include problems where language is used either in place of or in addition to symbols and include tangible narrative elements, e.g., characters, places, or actions.
2All comparisons were made at the aggregate level, minimizing the influence of students on the threshold of the boundary while still retaining the full variance of more proficient readers.
© 2025 Copyright is held by the author(s). This work is distributed under the Creative Commons Attribution-NonCommercial-NoDerivatives 4.0 International (CC BY-NC-ND 4.0) license.