ABSTRACT
Unlike multiple-choice online tests, in a system where students submit mathematical expressions as answers and they are automatically marked, it is possible to evaluate not only correct and incorrect answers, but also various other aspects, including partial marks. If an environment is prepared where students can take the test as many times as they need to get the correct answer, it is possible to visualize the process of arriving at the correct answer, and we can expect to obtain information about the process of understanding. We adopted STACK as an automatic mathematical expression grading system and visualized the solution process from the answer data. In order to visualize the situation of approaching the correct answer, it is necessary to define the distance between the answer and the correct answer, and we used two methods for visualization: one was the distance based on the classification of incorrect answers using the Potential Response Tree, which is one of the functions of STACK, and the other was the distance between the answer and the correct answer based on the Tree Edit Distance. Through these visualizations, it was found that it was easy to grasp things like students who are approaching the correct answer in an orderly fashion even if they don’t get the correct answer the first time, and the process of getting to the correct answer through trial and error, with the distance to the correct answer becoming closer or further away.
Keywords
1. INTRODUCTION
In recent years, digitalization has been progressing in our lives, and online learning, made possible by the use of individual computers, offers advantages, mainly in that it is not restricted by time or place, and that it facilitates managing learning progress. Furthermore, by fully utilizing the educational data that have become easier to obtain through online learning, the individualization of education is also progressing, enabling the presentation of appropriate educational materials to individual learners. For the individualization of education, checking learning progress through online tests is an important part of online learning to grasp students’ actual learning status and present appropriate teaching materials according to their abilities. Appropriate feedback based on online test results is also a crucial aspect of self-study.
However, the multiple-choice and numerical input methods used in many conventional online test formats limit the types of questions that can be asked and do not prevent guesswork, making it difficult to evaluate students’ abilities accurately based solely on the correctness of individual questions. An effective means to address these issues is, for example, a function that randomly generates multiple patterns of the same type of question. This function makes it difficult to cheat by sharing common answers among multiple students. Nevertheless, conventional question formats still have limitations in evaluating students’ ability to solve computational problems in science and mathematics. Therefore, a system has been proposed that allows students to submit their answers in mathematical expressions and automatically grades them. This system is gaining attention for its ability to provide appropriate grades to student responses while expanding the range of possible questions [9]. Since the system evaluates not only correct answers but also partial credit using mathematical formulas, it allows for a more detailed measurement of learners’ abilities from a single question. As a result, the analysis of online test answer data has received increasing attention.
In a pioneering study of error analysis in an e-learning mathematics system, Kawazoe et al. analyzed errors in the log data of a drill-type linear algebra calculation teaching material and classified error patterns related to calculation procedures [5]. Nakamura et al. [8] proposed an algorithm that classifies incorrect answers according to the combination of elementary functions that make up each question and provides appropriate feedback and partial credit utilizing the Potential Response Tree (PRT), one of the features of the automatic mathematical expression grading system STACK, System for Teaching and Assessment using a Computer algebra Kernel (an outline of which is introduced in the next section). Furthermore, in relation to the classification of incorrect answers in STACK answer data, Higuchi et al. [4] proposed a method to quantitatively classify incorrect answers based on the similarity of tree structures, using the Tree Edit Distance (TED) [10] and Subtree Kernel [2] methods to express mathematical formula answers in tree structures. Kurihara et al. [6] successfully provided qualitative information on answer transitions for an entire class by representing the transition from incorrect to correct answers as a weighted directed graph and allowing students to use STACK as many times as needed to reach the correct answer after making an error.
Although previous answer analyses have included temporal information in weighted directed graphs, they lack dynamic insights into the process through which each learner transitions to correct answers. We believe that the dynamic information of the learners’ responses contains valuable insights into their thinking processes and its analysis is expected to clarify the learners’ comprehension processes. In this paper, we examine two methods to visualize each learner’s answer process in a class based on STACK answer data. One approach is to classify incorrect answers using PRT, and the other is to calculate the distance between correct and incorrect answers using TED.
2. OVERVIEW OF STACK
The STACK, an automatic mathematical grading system,
developed by C. Sangwin and others in 2005 [1], is a system
that can automatically assess the correctness of answers entered
as mathematical expressions by utilizing the computer algebra
system (CAS), Maxima. It is possible to classify incorrect
responses and provide feedback according to the type of
incorrect answer using a mechanism called the Potential
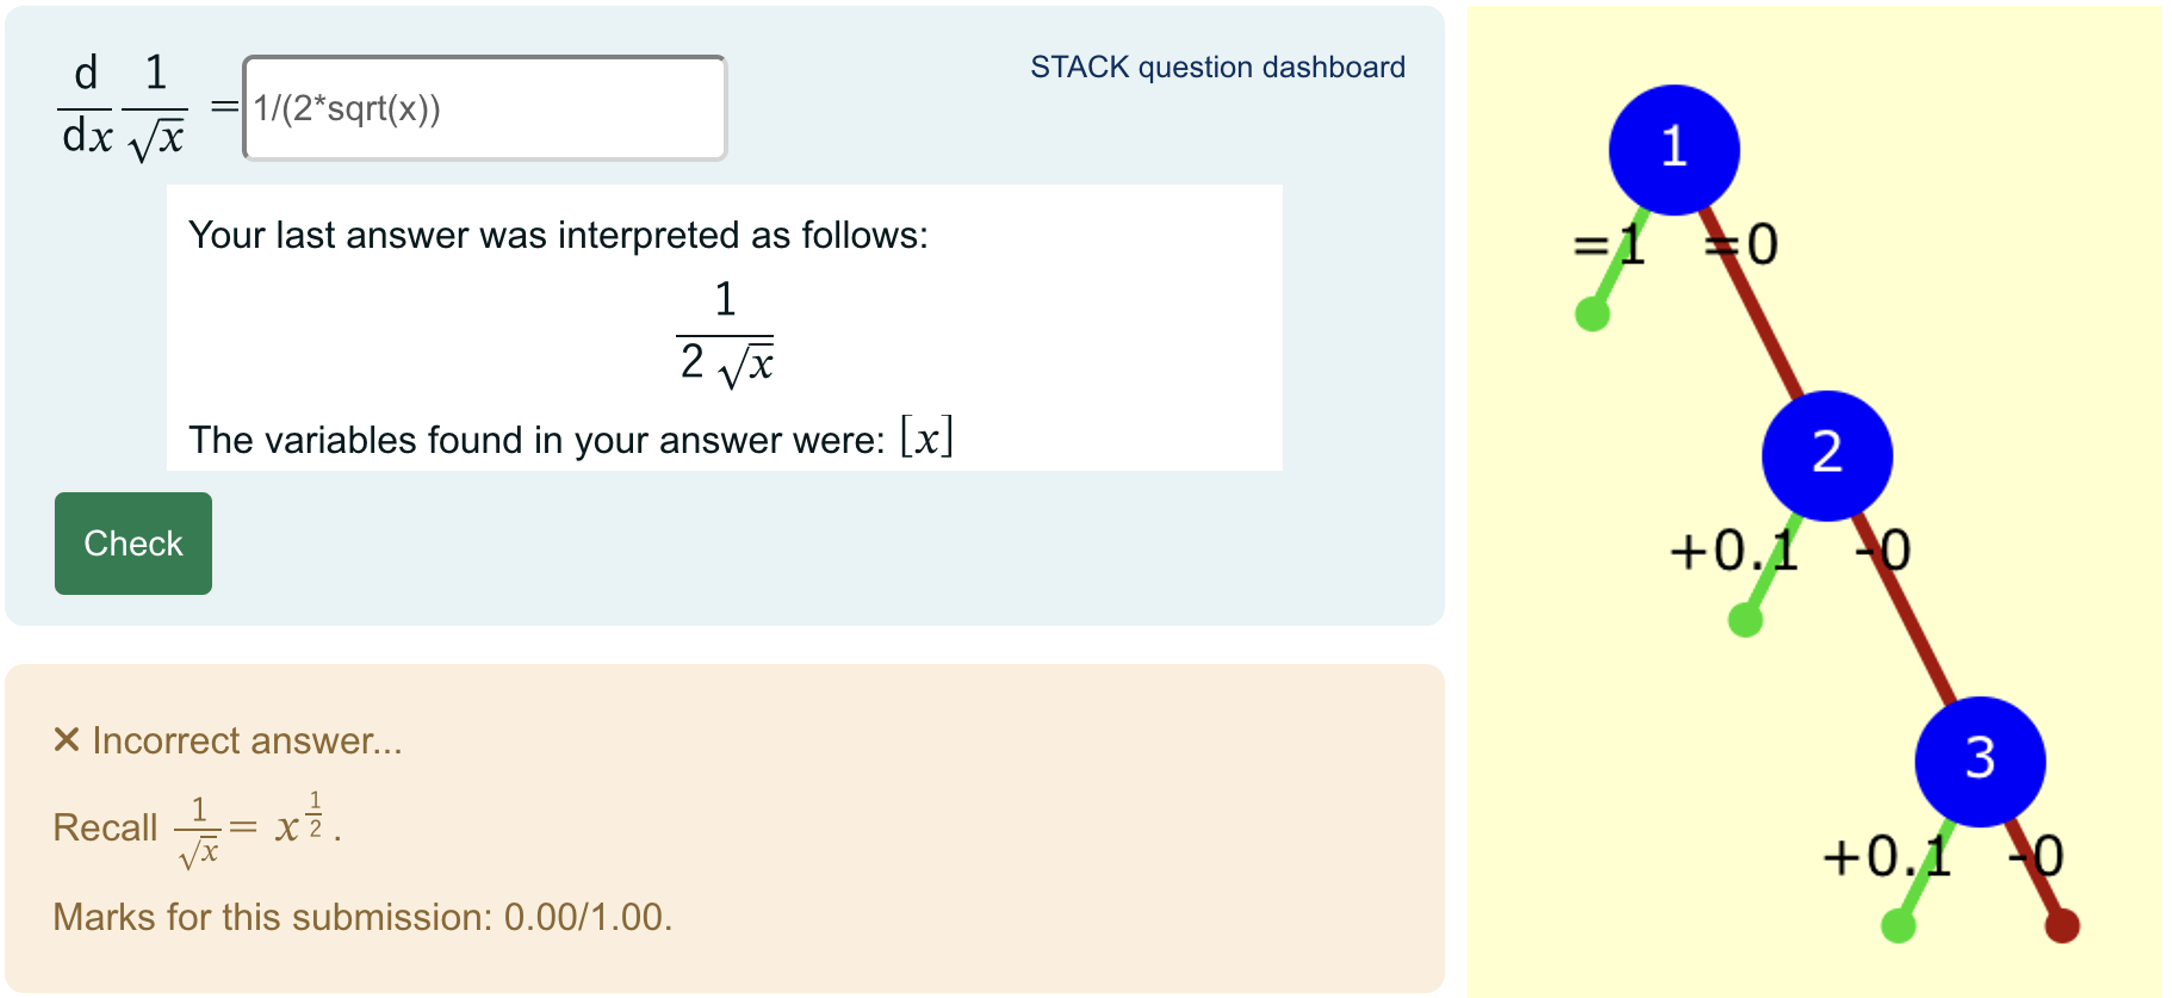
Response Tree (PRT). For example, Figure 1 shows an example
of a student’s answer and its evaluation, and PRT to evaluate
the results of a calculus question \(\frac {\mathrm {d}}{\mathrm {d}x}\frac {1}{\sqrt {x}}\).In this PRT, the correct or
incorrect answer is determined at node 1, and if the answer is
correct (note 1 is true), 1 point is awarded, and if it is
incorrect (note 1 is false), the message “Recall \(\sqrt {x} = x^{\frac 12}\).” is displayed
and the program moves to node 2. If the answer matches
-1/2*x*sqrt(x) (note 2 is true), the message “Typing error
(forgot to put parentheses)” is given and 0.1 points are awarded,
and if it does not match (note 2 is false), the program
moves to node 3, determines whether the answer matches
1/sqrt(x)^3 (a common incorrect answer)(note 3 is true),
and in that case, gives 0.1 points. If the answer does not
match the answer (note 3 is false), no point is given. In the
example in Figure 1 (left), the student’s response was \(\frac {1}{2\sqrt {x}}\), which
did not match the candidate’s answer for node 3 of the
PRT, resulting in an incorrect answer and a score of 0
points.
3. CLASSIFICATION OF ANSWERS
3.1 Potential Response Tree
In the PRT design for the question described in the previous section (Figure 1(right)), there are four types of answers, including the correct answer. When visualizing the student’s solution as it approaches the correct answer, it is thought that it would be easier to visualize if the distance from the correct answer was defined according to the type of incorrect answer, but the distance from the correct answer for each incorrect answer will be determined subjectively based on the teacher’s experience. Table 1 is an example of the definition of distance from the correct answer. When the answer is classified as true for node \(n\), the distance from the correct answer is set to \(n-1\). When node \(3\) is false, the answer is far from the correct answer, so the distance is defined as \(6\).
| Solutions | Distance | Comments |
|---|---|---|
| \(-\frac {1}{2x\sqrt {x}}\) or \(-\frac {1}{2}x^{-\frac 32}\) | 0 | Correct answer |
| \(-\frac {1}{2}x\sqrt {x}\) | 1 | -1/2*x*sqrt(x), Typo |
| \(x^{-\frac 32}\) | 2 | Common incorrect answer |
| Other | 6 | Other incorrect answer |
3.2 Tree Edit Distance
As considered in the previous subsection, classifying incorrect answers by PRT and defining their distance from the correct answer by the teacher’s experience lacks objectivity and incurs the cost of examining each individual question. Furthermore, depending on the question, there may be many incorrect answers that are not fully classified. Therefore, we examine the distance of an incorrect answer from a correct answer from a different perspective.
A student’s answers to a mathematics question is a string which
is regarded as a CAS input representing a mathematical
expression. One could measure the distance between the
student’s answer and the correct answer, which is also
represented as a string. Although the Levenshtein distance [7]
between the two strings can be calculated easily, it hardly
reflects the structure as mathematical expressions: sin(1) and
ln(1) are nearer than cos(1) and ln(1) because the former
pair shares a character ‘n’.
The syntactic structure of the CAS input can be represented
as trees. In fact, the CAS parses the input and stores as
an object so-called ‘expression tree’ which is a labeled
ordered tree. Each function and operator in the CAS input is
represented by a node whose label is the name of the function or
the operator, for example, ‘sin’ or ‘+’. The operands are
represented as its child nodes. The leaf nodes correspond to
atoms: literal numbers or variables, for example, ‘25’ or
‘x’.
Since the correct answer -1/(2*x*sqrt(x)) to the question \(\frac {\mathrm {d}}{\mathrm {d}x}\frac {1}{\sqrt {x}}\) can
be written as ‘/(-1,(*,2,x,sqrt(x))),’ it is represented as an
expression tree in Figure 2 (right). Here we regard ‘-1’ an atom.
An explanation will follow.


One of the natural distances among ordered labeled trees is the Tree Edit Distance(TED) [10]. It is a natural extension of the Levenshtein distance or the string edit distance and is defined as the minimal length of the sequence of edit operations that transforms one tree to the other. Three kinds of edit operation are allowed:
- Insert a node
- Delete a node and connect its children to its parent directly
- Rename the label of a node
TED has been used for various purposes, especially after the introduction of the efficient ZS algorithm [12]. In the context of CAS inputs, one can think of TED as the amount of students’ efforts to edit and reorganize their incorrect answers to have the correct answer.
Let us consider an incorrect answer 1/(2*sqrt(x)) which is
written as ‘(/,1,(*,2,(sqrt,x)))’. Its expression tree is shown in
Figure 2 (left). It can be transformed into the correct one by the
edit sequence consisting of two operations: renaming the label \(1\)
to \(-1\) (Figure 2 (center)) and then inserting a node with the label \(x\)
(Figure 2 (right)). It turns out that there are no edit sequences
of length \(1\) connecting these two trees. Thus, the TED between
the two is \(2\).
The correct answer can also be written as -1/2*x^(-3/2) which
has a distinct expression tree and the distance from the
incorrect answer to this form is not equal to \(2\). We avoid this
ambiguity by choosing a set of possible correct CAS inputs and
computing the smallest distance from the incorrect answer to an
element of the set.
4. VISUALIZATION OF SOLUTION PROCESSES
4.1 Solution Data and Method
In this study, we will analyze the answer data with the consent
of the student for STACK-based online tests that were
conducted in the "Introduction to Mathematics" lecture for the
humanities, which was held at one of the Japanese four-year
universities in 2021 and covered the content of one-variable
calculus. There were 102 first- and second-year students. The
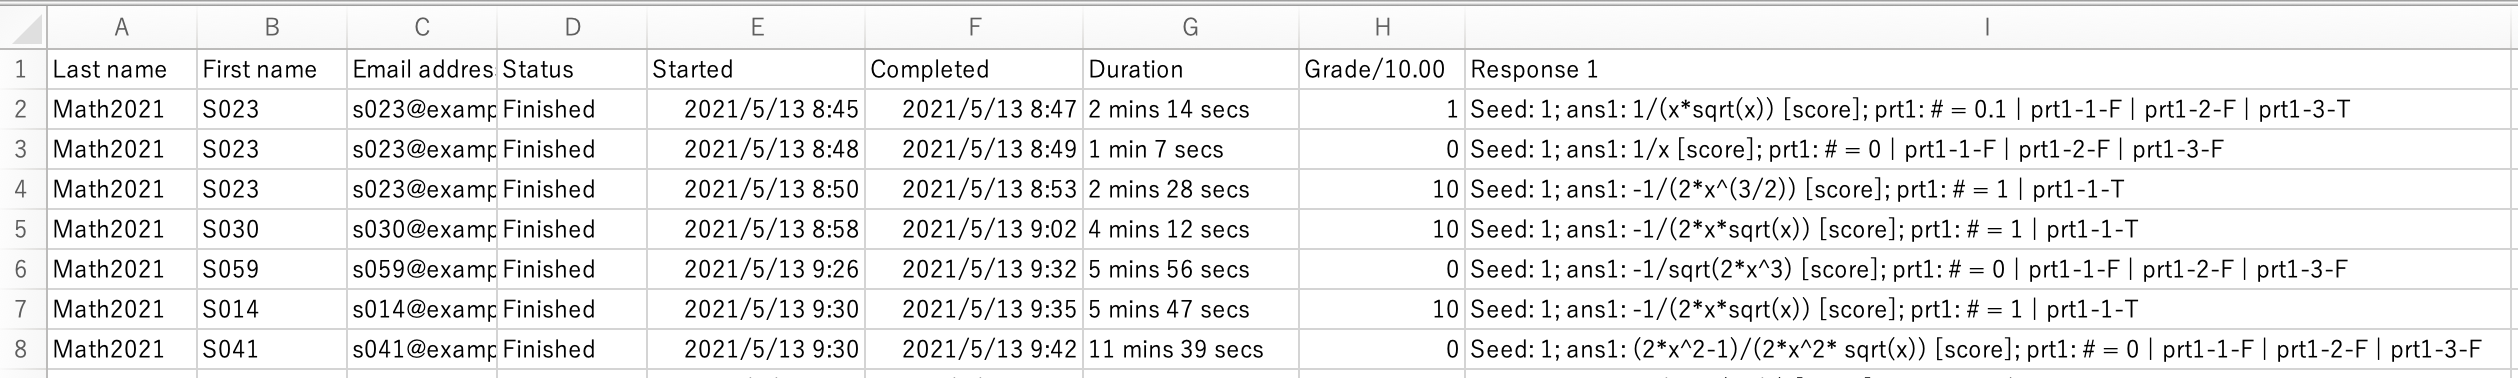
answer data are saved for each question and can be downloaded in CSV file format. The permission to use the answer data was
obtained from the students. Figure 3 shows an example
of the answer data downloaded. The students have been
anonymized and the data has been processed in such a
way that individuals cannot be identified. Students are
distinguished by their "Last name" and "First name" columns,
and since email notifications are not sent, a dummy email
address is specified in the "Email address" column. The
column "Status" indicates the test status, with ‘Finished’
indicating that the test has been taken. The "Started" and
"Completed" columns indicate the start and end times of the
test, and the "Duration" column calculates the time taken to
complete the test. The "Grade/10.00" column displays the test
results converted to a 10-point scale. The column "Response
1" is the most important column. In the "Response 1"
column, in addition to the student’s answer and the score, the
judgment result for each node of the potential response
tree is also recorded. In the case of the question in Figure
1, if the answer is correct, it is recorded as "prt1-1-T",
and if it is an incorrect answer equal to \(x^{-\frac 32}\), it is recorded as
"prt1-1-F | prt1-2-F | prt1-3-T", and so on. For example,
"prt1-1-T" indicates the judgment result "True" for node
number "1" in the potential response tree with the name
"prt1".
In the following two subsections, we will examine the visualization and analysis of the answering process using two different methods. One is based on the results of the PRT classification of the answers (PRT method), and the other is based on the TED of the actual answers that were input (TED method). For visualization, we have developed and are using a web application that automates visualization by selecting the answer data and choosing one of the two visualization methods. The visualization policy is as follows. In order to visualize the answer processes of each student in the class, we use a 3D visualization with three axes. Since students can take the test as many times as they like until they reach the correct answer, we use three axes: one to show the number of attempts ("Attempt" axis), one to show the student number ("Students" axis) used to distinguish between students (in fact, the student’s rank based on the grade is described), and one to show the distance from the correct answer to the incorrect answer in "Type of Error" axis in PRT method and "Tree Edit Distance" axis in TED methos. In this way, we expect to be able to visualize how the whole class reaches the correct answer through trial and error.
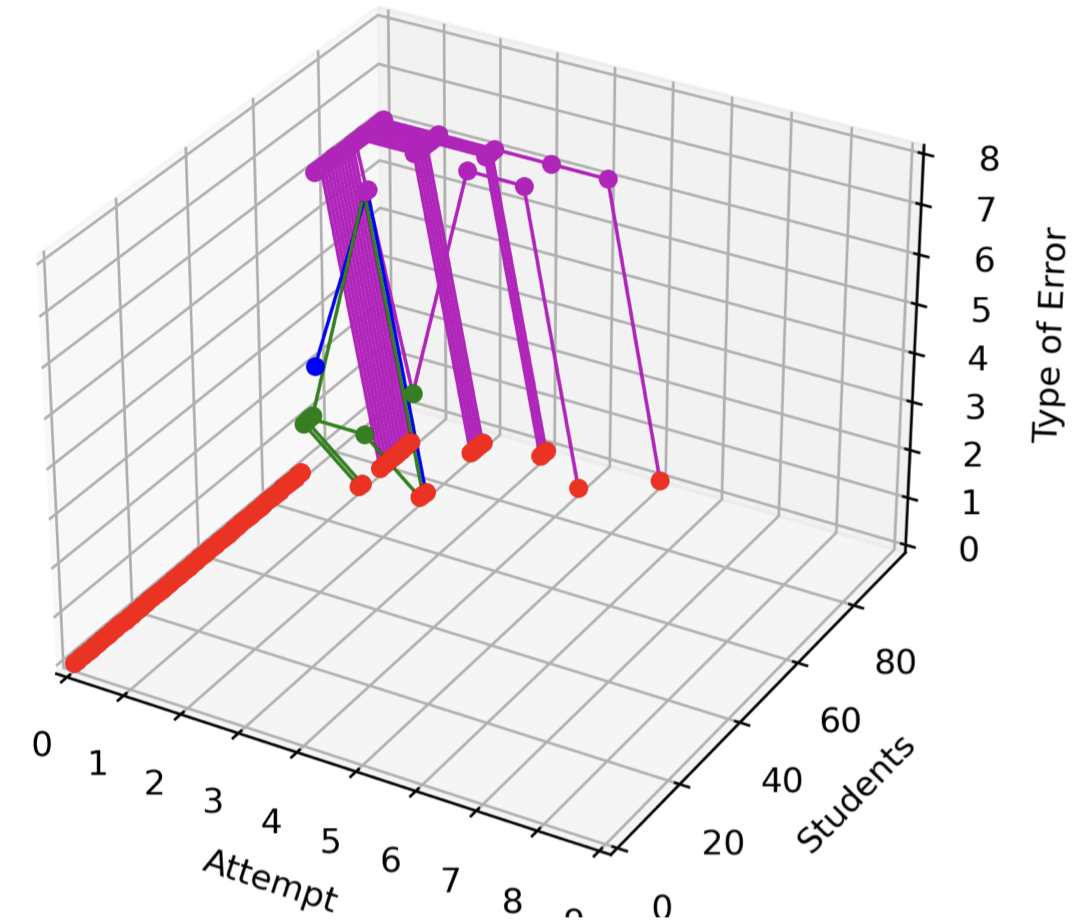
4.1.1 Visualization based on PRT
Figure 4 shows a visualization of the process of answering the differentiation question \(\frac {\mathrm {d}}{\mathrm {d}x}\frac {1}{\sqrt {x}}\), based on the distance from the correct answer and the incorrect answers classified using PRT [11]. The categories of incorrect answers and the distances from the correct answers are summarized in Table 1. It can be seen that 64 students answered the correct answer on the first try (red points where both the "Attempt" value and the "Type of Error" value are 0), and that many students reached the correct answer by the third try. It can be seen that some students are reaching the correct answer through trial and error, with the distance to the correct answer becoming smaller or larger.
4.1.2 Visualization based on TED
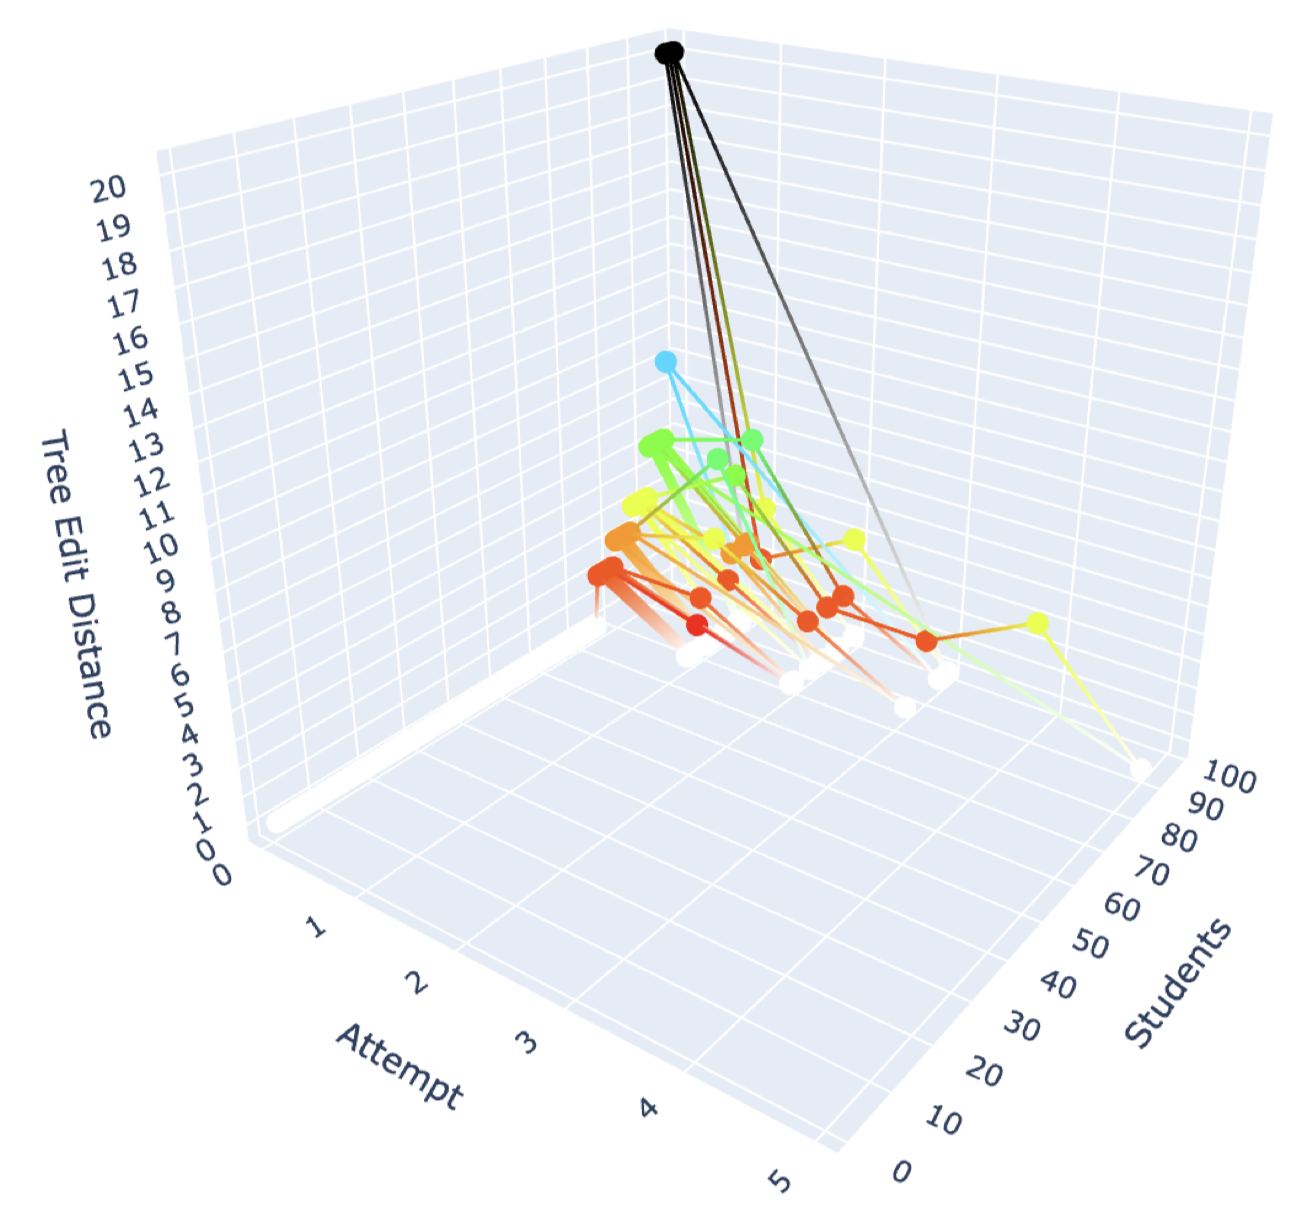
When visualizing the process of answering using PRT, the distance from the correct answer needs to be determined based on the teacher’s experience, taking into account PRT’s classification of incorrect answers. In other words, this approach lacks objectivity. Therefore, we attempt to visualize the answering process based on objective indicators by calculating the distance between a given answer and the correct answer using TED. With this method, there is no need to classify incorrect answers using PRT, and the cost for teachers to visualize the process is expected to be low. On the other hand, the notation of the answers in Maxima is not unique. For example, the correct answer for \(\frac {\mathrm {d}}{\mathrm {d}x}\frac {1}{\sqrt {x}}\) can also be written as \(-\frac {1}{2x\sqrt {x}}\) or \(-\frac {1}{2}x^{-\frac 32}\) as described in Table 1. Therefore, care must be taken when calculating the TED. In this study, we saved all mathematical expressions that were evaluated as correct answers, calculated the TED for incorrect answers against these expressions, and then visualized the results by taking the minimum value as the distance from the correct answer.
Figure 5 shows a visualization of the process of answering a differentiation question, \(\frac {\mathrm {d}}{\mathrm {d}x}\frac {1}{\sqrt {x}}\), based on the distance from the correct answer and the incorrect answers calculated using TED. Note that answers with a TED value of 20 or higher are grouped together. Compared to the classification of incorrect answers using PRT, it can be seen that there are many different types of TED distances. This suggests that the answering process is visualized, including errors that could not be classified using PRT. This suggests that the design of the PRT needs to be reconsidered. When using PRT, it is easy to track how the correct answer is reached from a specific mistake. In contrast, TED allows for visualization of how the correct answer is reached from a variety of answers that cannot be classified using PRT.
5. CONCLUSION AND DISCUSSIONS
In order to understand the process of student learning, we defined the distance between the students’ answers and the correct answers in an online math test using the PRT and TED methods. We then visualized how the students arrived at the correct answers through repeated testing. These visualizations revealed that patterns such as students systematically approaching the correct answer, even if they did not get it right on the first attempt, and the trial-and-error process in which the distance to the correct answer fluctuates before eventually decreasing.
Bayesian Knowledge Tracing (BKT) is a well-known model to handle temporal changes in learning, such as the knowledge acquisition process [3]. BKT aims to infer the state of knowledge of a learner based on the temporal accumulation of information about the correctness of the responses to multiple questions. In contrast, this study focuses on how students approach the correct answer to a single question. In fact, to our knowledge, there are almost no such attempts. Rather than constructing a formal theory, it simply visualizes the process by which students move toward the correct answer.
Understanding how students approach correct answers can provide valuable information for teachers when considering how to provide feedback. This may represent a first step toward verifying the effectiveness of feedback in the learning process. Furthermore, while the PRT-based classification of incorrect answers can help identify areas of learning deficiency, in this study, the extent to which the PRT-classified incorrect answers deviate from the correct answer was left to the subjective judgment of the teacher. In the future, it may be possible to quantify these deviations using the TED method, paving the way for the integration of the PRT and TED approaches.
6. ACKNOWLEDGMENTS
This work was supported by JSPS KAKENHI Grant Number 21H04412.
7. REFERENCES
- Stack
development
history.
https://docs.stack-assessment.org/en/Developer/Development_history/[Accessed on May 9th, 2025]. - M. Collins and N. Duffy. Convolution kernels for natural language. In T. Dietterich, S. Becker, and Z. Ghahramani, editors, Advances in Neural Information Processing Systems, volume 14, pages 625–632. MIT Press, 2001.
- A. Corbett and J. Anderson. Knowledge tracing: Modeling the acquisition of procedural knowledge. User Model User-Adap Inter, 4:253–278, 1994.
- S. Higuchi and Y. Nakamura. Classification of answers in math online tests by visualizing graph similarity. Companion Proceedings 14th International Conference on LearningAnalytics & Knowledge (LAK24), pages 197–199, 2024.
- M. Kawazoe and K. Yoshitomi. Classification of misanswer patterns in linear algebra and application to e-learning (in Japanese). The 44th Conference of Japan Society for Mathematical Education, pages 375–380, 2011.
- A. Kurihara and Y. Nakamura. Network analysis of solution processes in math online tests. Companion Proceedings 15th International Conference on LearningAnalytics & Knowledge (LAK25), pages 257–259, 2025.
- V. I. Levenshtein. Binary codes capable of correcting deletions, insertions, and reversals. Soviet Physics Doklady, 10(8):707–710, 1966.
- Y. Nakamura, Y. Ichikawa, K. Yoshitomi, S. Higuchi, Y. Miyazaki, and T. Nakahara. Automatic classification of incorrect answers to differentiation questions using potential response tree. Proceedings of Computer Aided Assessment and Feedback in Mathematics: Contributions to the International Meeting of the STACK Community 2021, pages 1113–1117, June 2021.
- C. Sangwin. Computer aided assessment of mathematics. OUP Oxford, 2013.
- K.-C. Tai. The tree-to-tree correction problem. J. ACM, 26(3):422–433, 1979.
- T. Takada and Y. Nakamura. 3D visualization and analysis of transition of answers to an online mathematics test (in Japanese). Proceedings of the 48th Annual Conference of JSiSE, pages 201–202, 2023.
- K. Zhang and D. Shasha. Simple fast algorithms for the editing distance between trees and related problems. SIAM journal on computing, 18(6):1245–1262, 1989.
© 2025 Copyright is held by the author(s). This work is distributed under the Creative Commons Attribution-NonCommercial-NoDerivatives 4.0 International (CC BY-NC-ND 4.0) license.