ABSTRACT
When tutoring students it is useful to be able to predict whether they are succeeding as early as possible. This paper compares multiple methods for predicting from sequential interaction data whether a student is on a successful path. Predicting students’ future performance and intervening has shown promise in improving learner outcomes and alleviating learner difficulty during open-ended learning. However, the literature lacks a systematic comparison of different classifiers across different open-learning datasets. This paper compares four real-time binary classifiers of learner types (on track to succeed or not) - an association rule-based classifier, a hidden Markov model-based classifier, a long short-term memory neural network classifier, and a stratified baseline classifier. Classifiers are trained and evaluated on three datasets representing different avenues of learning - an interactive simulation, massive open online courseware, and collaborative learning. A statistical evaluation of the real-time predictive performance of classifiers is conducted. This work also provides insights into model interpretability using explainable AI tools and discusses the tradeoff between accuracy and inherent interpretability of classifiers.
Keywords
1. INTRODUCTION
Open-ended learning [18] refers to exploratory student learning with minimal constraints and has shown success in supporting student learning (eg. [20, 19]) through exploration and experimentation and to promote reflection, problem-solving and critical thinking [21]. Unfortunately, for some learners, the exploratory nature of open-ended learning environments (OELEs) can be confusing leading to detrimental interaction [29]. Personalized AI systems for open-learning activities have been shown to improve student learning (eg. [23, 34, 37, 43, 6]) and deliver the benefits of individualized interaction by monitoring and responding to the learners in real-time (see [13] for an overview). While plenty of possible variables exist that can drive personalization, our work focuses on predicting students’ future learner performance (eg. student task completion, relative learning gains, outcome of pass or fail) using real-time sequential data collected during learning, where early classification can enable personalized interventions for struggling students who are predicted to have lower performance. Typically, researchers build these classifiers from scratch for a specific application in learning or leverage existing classifiers used in similar learning contexts. Although there is a vast number of classifiers for learner performance (eg. [34, 2, 24]) using sequential interaction data in different open-ended applications of learning, the field lacks a comprehensive evaluation of classifiers across multiple open-ended learning datasets. Such a comparison can guide researchers looking to implement personalized adaptive support and enable the development of more accurate adaptive support systems, enhancing personalized interventions and potentially improving student learning.
This paper focuses on the binary classification of students’ learner type (eg. high learners - will complete the task/low learners - will not complete the task, gainer/non-gainers, pass/fail) using sequential interaction data collected during open-ended learning. Four classification methods are investigated - i) the Framework of User Modeling and Adaptation (FUMA) [22], a rule-based student classifier; ii) a hidden Markov model-based (HMM) classifier; iii) a long short-term memory (LSTM) neural network classifier; iv) a stratified dummy classifier (baseline). Classifiers are trained and evaluated on three open-ended learning datasets with varying size and feature complexity - an interactive simulation, a massive open online courseware (MOOC), and collaborative learning with a social robot. The performance of each of these classifiers is evaluated through a comprehensive statistical analysis evaluating the potential for real-time personalization in each dataset. Classifier performance over time is studied in each dataset along with insights into the usefulness of these classifiers for early-stage and late-stage predictions. Further insights into model interpretability of these classifiers are obtained through two explainable artificial intelligence (XAI) tools - permutation importance (PI) [4] and approximating Shapley values (SHAP) [15, 33]. These findings provide insights about the underlying mechanisms of the classifiers in each specific learning context which is useful for understanding the potential impact of deploying these classifiers in novel contexts.
To the best of our knowledge, this is the first comprehensive study that evaluates and compares different classifiers across multiple datasets of sequential interaction data in different open-ended learning datasets. The analysis looks at datasets of various sizes, levels of feature complexity, and data modality, which aims to help a diverse group of educators looking to implement adaptive personalization in learning and researchers who are aiming to design and select models to predict learner type for adaptive personalization during learning. It simulates real-time personalization by looking at the performance of predictive classifiers across incremental time windows. This provides insights into how predictions can inform timely interventions. This is a critical step towards deploying adaptive systems that respond promptly to learner needs. By looking at the most predictive features based on interpretability techniques, the analysis provides insights into the strengths and weaknesses of different classifiers along with a discussion about the tradeoff of inherent interpretability and accuracy. These findings aim to contribute to the development of more effective and transparent adaptive support systems and scaffold research on building personalized systems in learning and other areas where sequential interaction data can be used for prediction such as games [25], wellbeing [45] and web services [31].
The rest of the paper is organized as follows. Section 2 discusses related work. Section 3 describes the three datasets of different open-ended learning contexts that we use in our analysis. Section 4 introduces the four classifiers used in the paper and their mechanisms. Section 5 provides an overview of the process of training the classifier and our evaluation in terms of model performance and model importance. Section 6 discusses our results on model performance, and section 7 discusses our findings with the XAI tools in relation to the model performance. Finally, we conclude in section 9 and provide future work.
2. RELATED WORK
Our work focuses on predicting learner type in open-ended learning using sequential interaction data. There is existing literature where learner types have been successfully predicted in open-learning contexts. For example, Murali et. al [34] showed that a rule-based classifier can be used to predict student learner types using action logs across multiple datasets in an open-ended game-design-based environment. Kaser et. al [24] showed that a probabilistic model jointly representing student knowledge and strategies can significantly improve the prediction of external posttest results compared to only using accuracy data collected from an inquiry-based environment. Al-azazi and Ghurab [2] were able to successfully predict students’ performance using an artificial neural network and LSTM leveraging student interaction records in a MOOC dataset. Moreover, prior studies [23, 34, 37] on personalized adaptive support have shown that timely interventions based on learner-type predictions can improve student experiences by targeting students who are likely to struggle or underperform. While these methods have been applied individually in various contexts, comprehensive performance comparisons across multiple open-ended learning datasets are lacking. Our work addresses this gap by systematically comparing the performance of classifiers across different datasets, providing insights into their effectiveness and generalizability.
There are existing studies where interpretability techniques have helped researchers in education with insights into predictive models outside of the context of open-learning environments. For example, Nagy et. al [35] look at various interpretability techniques for predicting student drop-out in a dataset of a large public university. Leveraging interpretability tools including permutation importance (PI) and SHAP values, they demonstrate how the predictions can be explained for that particular dataset. Wang et. al [46] leverage SHAP values to explain a model that predicts student achievement in a dataset from a public university of academic records. Choi et. al [11] compared several machine learning algorithms to predict student programming learning performance in a virtual learning environment leveraging various educational data, such as course information, student demographics, and interactions with the online learning platform. Their work leverages SHAP to interpret the best-performing classifier. To the best of our knowledge, while these interpretability techniques have been applied in educational contexts, they have not been contrasted across multiple classifiers or datasets in open-ended learning. Thus, our work attempts to fill this gap by comparing and contrasting the top features from these interpretability techniques across multiple classifiers and datasets in open-ended learning.
3. DATASETS
This work uses three different open-ended learning datasets and their characteristics are summarized in table 1, detailing in each dataset the number of data points \(N\), the total number of features, data modality, and the binary variable of student learner type that is predicted. These datasets have various degrees of feature complexity and participant size.
| Dataset | N | Data Modality | Number of Features | Binary Variable |
|---|---|---|---|---|
| Unity-CT | 206 | Actions | 572 | High/Low Learners |
| CS1 MOOC | 469 | Actions | 28 | Pass/Fail |
| JUSThink | 35 | Actions, Speech, Affective states, Gaze | 102 | Gainers/Non-gainers |
3.1 Unity-CT (interactive simulation)
Context: Unity-CT is an open-ended learning environment that engages students in interactive game construction. Students learn how to design platformer games using the Unity game engine during an online lesson to improve computational thinking (CT) skills. Each lesson usually poses a particular objective that the student must achieve. This analysis focuses on data from the first lesson of the curriculum which fosters two CT skills in alignment with the well-established Brennan and Resnick’s framework [9] - i) Being Incremental and Iterative, and ii) Testing and Debugging. The lesson involves making a simple platformer game with the following instructions - "Create a ramp and bucket with different types of platform objects. Add a ball that must hit at least once each type of platform before landing in the bucket".
Each online class included a human teacher and up to 12 students. No researchers attended the remote classrooms nor interacted with the students or teachers in any way. Each class lasted 60 minutes and included an initial tutorial (20-30 minutes) led by the teacher describing the basics of using the Unity editor and the steps involved in achieving the goal for the initial lesson. The remaining time consisted of the student’s interaction with Unity-CT to complete the objective. Teachers monitored students’ progress and provided help to students if they needed it. Students could signal to the teachers if they finished the objective early or keep working on their solution until the end of the 60-minute class.
During interaction with Unity-CT, action logs were collected in real-time, tracking clickstream data of the students’ interaction with the game objects in Unity (eg. delete a Ground Slide platform, add a ball, Select a ground platform, duplicate a ball), and students’ final solutions to the challenge were saved for analysis. Student solutions were graded based on 4 binary criteria defined by the teachers who taught this lesson - whether the solution has a ramp, whether the solution has a bucket, whether the ball hits all special platforms, and whether the ball ends up in the bucket. These criteria are evaluated with either 1 or 0 if they complete it or not. Finally, the 4 criteria are averaged and students get a solution score of 0, 0.25, 0.5, 0.75, or 1.
Dataset: This dataset was obtained with permission from the authors of [34]. This dataset consists of log data obtained from online classes conducted in 2021 and has been studied previously to build a pedagogical agent that delivers help interventions [34]. This dataset consists of 205 students with an average interaction length with Unity-CT of 28.39 minutes (std.dev 6.23 minutes). Learner types were labeled based on a median split of solution scores. The average grade for students was 0.61 (std.dev 0.49) and median = 1, thus the median-split bifurcates students into those who completed the challenge successfully, and those who did not complete some part of the challenge. Of the 205 students, 125 students were labeled as high-learners, and 79 students were low-learners. The aim here is to predict whether students would successfully complete the challenge or not as early as possible into the interaction. Action logs are processed into features in a similar way employed in other research with data from Unity-CT [28, 34] as described in table 2. Action features are generated for each action-object pair (as tuples) available in Unity-CT, as described in table 2. The features in table 2-(a) indicate summative statistics over all pairs and indicate overall student engagement, while the features in table 2-(b) are generated for each pair, indicating behaviors specific to individual actions and target objects. For each student, these action features were computed over each 10-second window interval, and its cumulative value was also calculated. Thus each feature was computed twice - as a non-incremental feature, and an incremental feature. A non-incremental feature would mean the value of a feature in only that particular time window while an incremental type would mean the value of a feature aggregated up until that particular time window. Classifiers were trained on the entire collection of features (incremental + non-incremental).
| Features on all action-object pairs together | • Total Number, Frequency of Actions • Average, SD of intervals in-between actions |
|---|---|
| Features on each action-object pair | • Frequency, Count of tuple, Longest repetition of this tuple |
| • Average, SD of time intervals in-between next action | |
| • Time to first, Time to last tuple occurrence | |
| Pausing | • Number, frequency of pauses • Average and SD of pause duration |
3.2 CS1 Introductory Programming (MOOC)
Environment: The CS1 MOOC [30] utilizes an Integrated Development Environment (IDE) to teach introductory programming concepts in Java covering typical CS1 concepts like variables, conditionals, loops, and lists. The self-guided course uses online materials and is split into seven parts where students work on ten to thirty exercises. In addition to the exercises, there were three online exams, and passing the course was determined based on both points received from the exercises and points received from the online exams (see [30] for a full overview). Student action logs were tracked during the interaction.
Dataset: An open-access dataset [30] is used that consists of log data collected in the 2021 offering of the CS1 MOOC. In total, the dataset consists of 469 students1, with an average interaction length with the IDE of 2066 minutes (std.dev 1878 minutes). Learner types were labeled by whether students passed or failed the course. Of the 469 students, 159 students passed the course, and 310 students failed the course.
The action logs consist of unique identifiers for each student and timestamps with seven different types of events, which were processed into action features described in table 3. For each student, these action features were calculated at increasing 60-second window2 intervals in incremental and non-incremental ways3. As compared to other MOOCs studied for adaptive support such as the video-watching MOOC in [28], the CS1 MOOC dataset offers fewer features which may affect certain classification methods that rely on a complex set of features. The CS1 MOOC dataset serves as an example where complex interaction data with a vast set of features is unavailable, providing insights into the ability of classifiers to work with a limited set of features, which can often be the case in the real world.
| Features related to text | • Frequency and Count for text being added into the IDE (at the key-stroke level) |
|---|---|
| • Frequency and Count for text being removed from the IDE | |
| • Frequency and Count for text being pasted into the IDE | |
| Features related to IDE focus | • Frequency and Count for the IDE gaining focus (student clicked into the IDE) |
| • Frequency and Count for the IDE losing focus (student clicked away from the IDE) | |
| Other features | • Frequency and Count for the student executing their program |
| • Frequency and Count for the student submitting their program |
3.3 JUSThink (collaborative learning)
Environment: JUSThink [36, 38] is a robot-mediated collaborative and constructivist learning activity for children aged 9-12 mediated by a social robot. Interaction with JUSThink involves a learning activity that aims to improve students’ computational thinking (CT) skills through a map-based learning scenario. Students collaborate and interact with the environment and an interactive social robot robot intervenes intermittently during the learning task to provide feedback on the progress, give hints, and lend support through verbal and non-verbal behaviors. Students’ actions, speech behavior, affective states through OpenFace [5], and gaze patterns are tracked during the interaction.
Personalized adaptive support has been provided before in JUSThink [37] by defining a learner engagement score using a complex sequence mining and HMM-based model, but no previous work has been done on evaluating classifiers that predict learner types on this dataset.
Dataset: The open-access PE-HRI-temporal dataset [39] consists of a total of 64 learners interacting with the JUSThink environment. The participants were organized in teams of two, resulting in a total of 32 teams with an average interaction length with JUSThink of 24.745 minutes (std.dev 5.1 minutes). Team-level learning gains were evaluated through a pre-test and post-test. Team-level learner performance is measured as the average of the two individual relative learning gains of the team members. Among the 32 teams, learner types were labeled based on the valence (positive/negative) of the team-level learner performance: 15 teams had positive learning gains (gainers) and 17 teams did not have learning gains (non-gainers). The dataset consists of the features described in table 4. For each student, these action features were calculated at increasing 10-second window intervals in incremental and non-incremental ways. This dataset has the most rich and complex set of features among the three datasets. It is also the smallest dataset of the three due to the difficulty in obtaining complex multimodal data. The JUSThink dataset will provide insights into the ability of each classifier to leverage small but rich and diverse features.
| Action features | • Number of times a team added/removed an edge on the map |
|---|---|
| • The ratio of addition of edges over deletion of edges by a team | |
| • The total number of actions taken by a team | |
| • The number of times a team opened the sub-window with the history of their previous solutions | |
| • The number of times a team opened the instructions manual | |
| • The number of times either of the two members in the team followed the pattern consecutively: add/delete and then delete/add | |
| • The number of times the team had redundant edges in their map | |
| Emotion Features | • The average value of positive/negative valence for the team |
| Gaze Features | • The average of the two team member’s gaze when looking at their partner/robot/opposite to robot/ left or right side of the screen |
| Speech features | • The average of the two team member’s speech activity/silence/short pauses/long pauses |
| • The average percentage/ratio of time the speech of the team members overlaps |
4. USER CLASSIFICATION METHODS
The classification problem in this analysis is the binary classification of learner types such as high-learners/low-learners, gainers/non-gainers, and pass/fail. This analysis looks at classifiers that work with any type of sequential interaction data that is commonly collected during learning such as featurized action logs, emotion, speech, and gaze data. The first classifier is an existing framework FUMA [22] that has shown success in predicting learner types in various contexts such as interactive simulations [23, 27, 16, 34], and MOOCs [28]. The next two classifiers were built for this analysis: a Bayesian HMM-based model, and a neural network involving an LSTM layer. The last classifier is a baseline.
4.1 FUMA
The Framework of User Modeling and Adaptation or FUMA, fully described in [22], is an unsupervised method of modeling student behaviors from interaction data that applies to almost any open learning environment, and consists of two main parts - behavior discovery and user classification as portrayed in fig. 1.
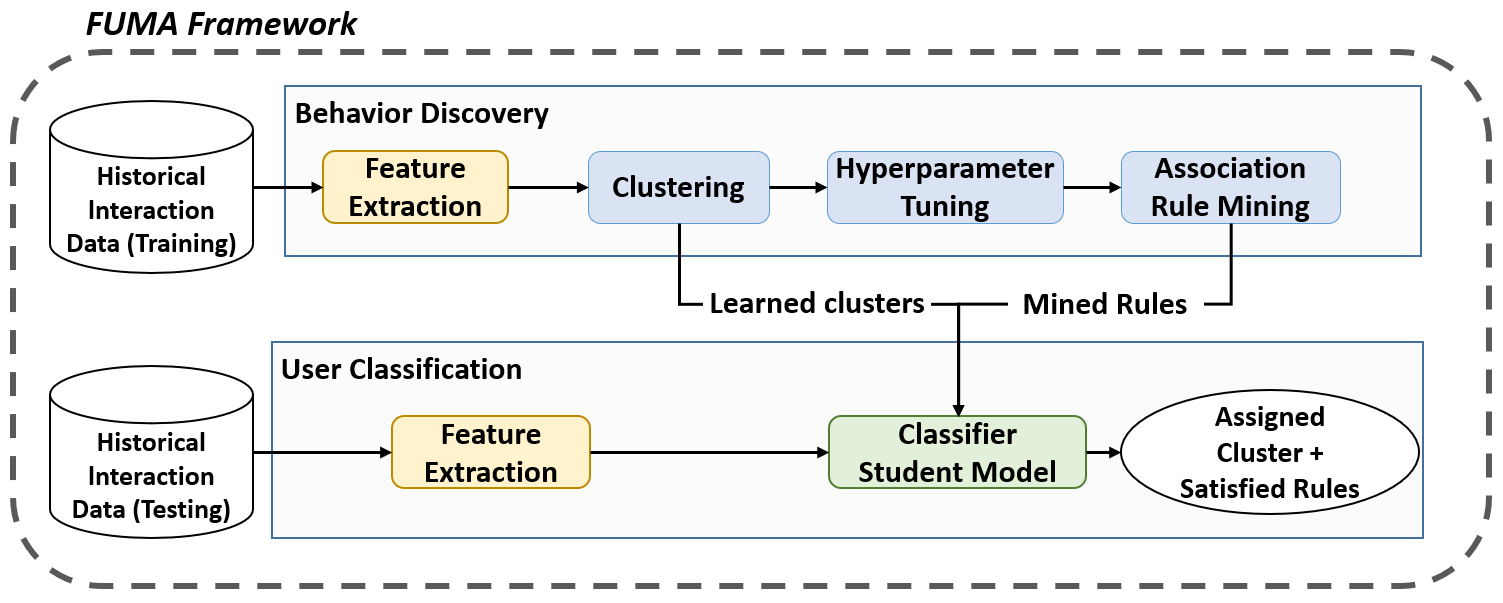
In behavior discovery, a k-means clustering algorithm is applied to users’ aggregated interaction features to identify groups with similar interaction behaviors. To determine the optimal number of clusters, FUMA aggregates three measures4 to choose the best value of k. Once k is chosen, the clusters are associated with each learner type. Previous applications of FUMA [23, 16, 28, 34] typically found two clusters (k=2) with significant differences in learner performance (learning gains in [23, 16, 28], and solution scores, a proxy for student performance in [34]) and labeled the learner types in these clusters as high-performing and low-performing students. Then, behaviors in each cluster are mined using association rule mining. This process extracts behavior patterns in terms of class association rules in the form \(X\rightarrow c\), where \(X\) is a feature-value pair and \(c\) is the predicted class label for the data points where \(X\) applies. Particularly, the hotspot algorithm in the WEKA data mining toolkit [17] is used to extract behaviors in the form of feature trees. These feature trees comprise branches with rules of the form \(X\rightarrow c\) (\(X\) implies \(c\)) as nodes. Each branch can be interpreted as the intersection of the rules, ie. \((X_1\rightarrow c_1) and (X_2\rightarrow c_2) and \cdots and (X_m\rightarrow c_m)\).
During user classification, the labeled clusters and corresponding association rules learned during behavior discovery are used to build a rule-based classifier. This classifier works in real time by calculating membership scores that summarize how well the user’s behavior matches the association rules of each cluster. The class with the highest score is assigned as the predicted label for the user. Thus, in addition to classifying students in one of the clusters, this phase returns the specific association rules describing the user’s behaviors that caused the classification. These behaviors have been used [22, 34] to trigger real-time interventions designed to encourage productive behaviors and discourage detrimental ones. Unlike the other classifiers considered in the analysis, FUMA is a simple rule-based classifier built on aggregated features and may not explicitly model time-based dependencies. However, there is an advantage of FUMA in that its rule-based classifier shows inherent interpretability to an extent that may be useful for personalization. Most previous work with FUMA evaluated student models through cross-validation against the cluster labels5obtained at the end of the interaction, however, this analysis provides a more accurate assessment by validating predictive models against ground-truth labels of learner types.
4.2 HMM
HMMs have been shown to predict student performance using educational game activity logs [14], and knowledge states in educational datasets [1]. HMMs have also been used to predict cognitive states [44] and learner engagement [7, 37] in open-ended learning activities.
This analysis considers a Gaussian Mixture Model Hidden Markov Model-based (GMM-HMM) schema with Bayesian inferencing portrayed in fig. 2. A GMM-HMM is an HMM where the emission probabilities are sampled from a mixture of Gaussians.
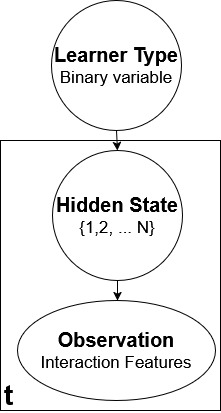
The HMM classifier consists of two separate GMM-HMMs with \(N\) (hyper-parameter) hidden states representing the two learner types (we shall use the learner type: gainer/non-gainer for this explanation). During training, depending on the training label, ie. the learner type, sequential observational data is used to train a gainer type HMM or the non-gainer type HMM. For inference, given unseen sequential interaction data, Bayes rule gives us the probability of an observation sequence belonging to the respective learner type. Let \(\mathrm {P}(\text {gainer})\) and \(\mathrm {P}(\text {non-gainer})\) be the prior probabilities of gainer and non-gainer types. These prior probabilities are initialized by the proportion of gainer and non-gainer data points seen during training data. During training, the training set’s observation sequences from gainers and non-gainers are used to train the respective HMMs the Baum-Welch expectation-maximization (EM) algorithm [41]. During inference, given an unseen observation \(O\), the EM algorithm lets you obtain observation probabilities \(\mathrm {P}(O|\text {gainer})\) and \(\mathrm {P}(O|\text {non-gainer})\) for the two learner types. The output prediction is then derived as follows:
This HMM-based model has fewer parameters and involves less complex calculations than some other HMM-based methodologies previously used for adaptive support such as leveraging sequence mining to interpret temporal behaviors in a collaborative learning context [37], or the Hierarchical Dirichlet Process HMM to predict student proficiency in educational games [14].
4.3 LSTM
Long Short-Term Memory Networks (LSTMs) are a type of recurrent neural network (RNN) that handles the problem of long-term dependencies [47]. LSTMs have shown success in early student performance prediction using interaction data in MOOCs [2], and learner performance in learning management systems using featurized report data [3] and featurized action logs [32]. Our LSTM framework is outlined in fig. 3.
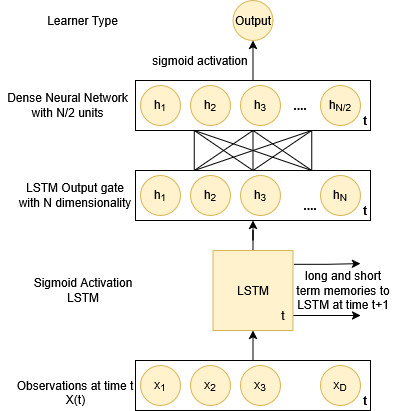
This analysis leverages an LSTM neural network classifier with 2 hidden layers. An observation \(X(t)\) with \(D\) dimensions/features is passed to the first LSTM layer with output dimensionality \(N\) representing the number of hidden units in the LSTM (\(N\) is treated as a hyper-parameter during training). The next layer is a neural network layer with \(\frac {N}{2}\) units with linear activation. The final output layer is a sigmoid neuron that predicts the learner type. This network was chosen as it includes an LSTM layer to model time-based dependencies and a densely connected neural network layer to learn more complex interactions between features. During training, learner types are used as labels to train the network through backpropagation with a binary cross-entropy loss and Adam optimizer. Inferencing is done by passing unseen sequential interaction data to the network and taking its output.
4.4 Baseline Classifier
Baseline classifiers are commonly used in the field [16, 27, 34] to establish a simple standard to compare the performance of other classifiers. This analysis uses a stratified dummy classifier from the scikit-learn package [40] which randomly samples one-hot vectors from a binomial distribution parametrized by the empirical class prior probabilities.
5. METHODOLOGY
5.1 Training
For each dataset, four binary classifiers are trained and evaluated using 8-fold nested cross-validation: 1) the rule-based classifier from the FUMA framework; 2) the GMM-HMM classifier; 3) The LSTM neural network; 4) a Stratified Dummy classifier from the sci-kit learn package [40]. Classifiers are trained to predict the binary learner type for that dataset. For Unity-CT, the binary variable corresponds to high/low learners (based on median-split solution scores); for JUSThink, the binary variable corresponds to gainers/non-gainers (based on learning gains); and for the MOOC the binary variable corresponds to pass/fail (the class outcome).
In each cross-validation iteration, the interaction data from 7 folds is used to train the classifiers, and the remaining fold is used as a test set to simulate a classification problem for real-time personalization. The trained classifier is evaluated on incremental data windows corresponding to interaction time. In each dataset, students’ interaction lengths vary considerably, so increments are used up to the longest time it took for any student to complete their interaction. At each window, test data consists of available interaction data for a student up until that window. 5-minute linear increments are used for the Unity-CT and JUSThink datasets which have similar average interaction lengths, and an appropriate logarithmic time scale starting at 110 minutes (5% of the average interaction length) is used for the CS1 MOOC dataset that includes a large range of interaction lengths.
A hyper-parameter grid search that optimizes accuracy is performed inside the cross-validation folds6. For FUMA, the hyper-parameters for its association rule-mining algorithm are: \(minsupport \in \{0.7, 0.8\}, branch \in \{3,4\}, impv \in \{0.07, 0.08\}\). For the HMM model, the hyper-parameter \(N \in \{2,3,4,5\}\), and or the LSTM, the hyper-parameter \(N \in \{32,64,96,128\}\) is the number of units in the LSTM layer. Accuracies over time are averaged across folds and compared in a statistical analysis.
5.2 Performance Evaluation
Model performance is measured using the metric of accuracy (defined as the ratio of correctly predicted data points to total data points). Accuracy provides a straightforward measure of overall performance, showing how often the classifier is correct. Accuracy is chosen because previous work on personalized support for open-ended learning (eg. [34, 23]) has considered this metric to build and evaluate student models. Moreover, the interventions implemented in these studies have been based on a discrete binary prediction of student learner type, ie. whether the student is on track to succeed or not. For each dataset, accuracies across folds of classifiers are compared using pairwise t-test at each data window, and the adjusted p-values 7 with effect size Cohen’s d are reported. It is important to note that when looking at relatively small datasets, the effect size plays a meaningful role when the p-value of the t-test is not low enough simply due to a lack of test sample size.
5.3 Interpretability tools
In each cross-validation fold, two explainable artificial intelligence (XAI) tools are applied to try to interpret each classifier. In particular, this analysis looks at two tools - permutation importance (PI) and Shapley (SHAP) values. PI tells us how our model would differ in performance in the absence of a particular feature, while the SHAP values tell us how much a feature contributed to increasing or decreasing model output. This analysis looks at these XAI tools to explain the prediction at the last data window for each dataset, with the aim of understanding what features contributed to the models’ predictions overall. We aim to provide insights into these models explaining the top contributing features in relation to their performance.
During each run of nested cross-validation at the last data window, to calculate the PI for a particular feature, the remaining features are shuffled across the test dataset (call this the permuted dataset), and the difference in overall accuracy between the test dataset and the permuted dataset is measured. Thus, \(PI = original\ accuracy - permuted\ accuracy\). This analysis focuses on the global explanations of SHAP as opposed to local explanations and looks at the mean SHAP value for each feature. SHAP values are computed using a linear approximation (see [15, 33] for overviews of approximating Shapley values) over 1000 random iterations. For both PI and SHAP, results are averaged across all cross-validation folds for robustness. For each classifier (excluding baseline) and dataset, the top 3 features (based on the highest mean absolute PI and mean absolute SHAP value) are reported along with their PI and SHAP values (non-absolute/true value).
6. RESULTS ON MODEL PERFORMANCE
This section discusses the results of the statistical analysis. While we expect accuracies to generally trend upwards with more data available for classification, this analysis looks at two aspects of prediction in terms of performance in early or late data windows. If a model performs well at later data windows, it may be used to personalize future interactions, serve as an automated assessment for a particular learning environment, or provide direct adaptive feedback at the end of the interaction. If a model performs well at early data windows, it can be useful to drive early personalization that may impact the rest of the interaction like personalized interventions for struggling students [23, 34]. Thus, for each dataset, we look at i) statistical comparisons at the last window to understand the potential for late-stage personalization; ii) statistical comparisons overtime against the baseline to understand the potential for early-stage personalization.
The performance of classifiers when tested in the last data window (and hence all possible interaction data) in each dataset is summarized in table 5. The table lists the average accuracy across folds for each classifier on each dataset, as well as the results of pairwise t-test comparisons for all classifiers.
| HMM | FUMA | LSTM | Baseline | T-test | |
|---|---|---|---|---|---|
| Unity-CT (n=206) | 64.81 +- 2.78 | 59.60 +- 3.74 | 56.08 +- 1.40 | 50.62 +- 2.99 | HMM = FUMA >LSTM >Baseline |
| MOOC (n=469) | 76.97 +- 1.42 | 34.65 +- 2.44 | 71.51 +- 2.05 | 53.95 +- 2.19 | HMM >LSTM >Baseline > FUMA |
| JusThink (n = 35) | 67.50 +- 5.99 | 59.38 +- 7.78 | 58.75 +- 6.72 | 43.75 +- 9.79 | HMM = LSTM = FUMA >Baseline |
This summary suggests that the HMM classifier performs the
best overall for each dataset as it is not significantly worse or
significantly outperforms all the other classifiers. These results
look at classifiers that use the entire length of interaction data,
and thus the HMM classifier is likely useful when making
predictions for late-stage personalization or personalization
after the interaction of a learner in each of these learning
contexts.
Unity-CT Dataset: Figure 4 plots the percentage accuracies of
the four classifiers at each of the data windows. Error bars are
provided for all classifiers excluding the baseline.
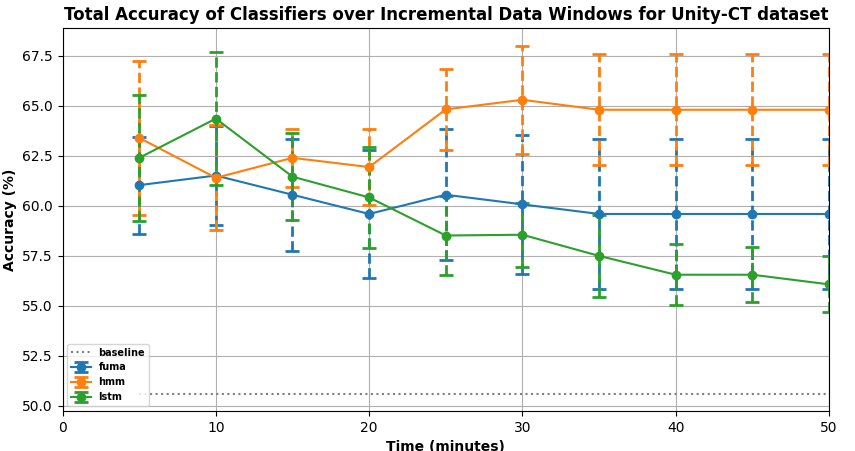
i) Comparisons at last window: Pairwise t-test comparisons of classifiers accuracy using at the last data window show that the HMM classifier is not statistically significant from FUMA ((\(p>0.05\), \(d = 0.523\)) but it significantly outperforms both the LSTM and the Baseline classifier with a large effect size(\(p<0.01\), \(d =\) 1.313 and 1.628 against LSTM, and Baseline classifiers respectively). Individual t-test comparisons at each data window do not yield any statistically significant difference between the HMM and FUMA classifiers for all data windows and between the HMM and LSTM for \(t\le 35\) minutes. This is likely due to the small sample size as suggested by the minimal overlap in error bars and the moderate effect sizes (range of \(d\): 0.273 - 0.523)
ii) Comparisons over time: Pairwise t-test comparisons show that
the HMM classifier significantly outperforms the baseline with
large effect sizes (\(p<0.05\), \(d\) range: 1.226 - 1.840) across all data windows
(\(0
CS1 MOOC Dataset: Figure 5 plots the percentage accuracies of
the four classifiers at each data window.
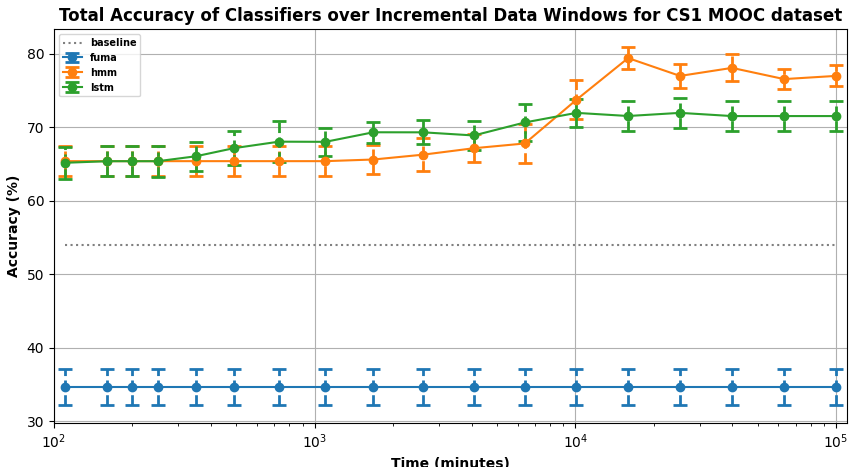
i) Comparisons at last window: Pairwise t-test comparisons of classifier accuracy at the last data window show that the HMM classifier significantly outperforms all the other classifiers with large effect sizes (\(p<0.05\), \(d =\)7.013, 1.024 and 4.126 against FUMA, LSTM, and Baseline classifiers respectively). Individual t-test comparisons of the HMM classifier against other classifiers at each data window show that it is not statistically different from the LSTM for \(t<10^4\), and for \(t>10^4\) it significantly outperforms all other classifiers (\(p<0.05\)) with large effect sizes (range of \(d\): 0.91 - 7.013 ). This suggests that both the LSTM and HMM classifiers could be used for early personalization in MOOC contexts, but our results favor HMM for later predictions. These findings are consistent with the results in [2] which found value in LSTMs for early predictions in MOOCs.
ii) Comparisons over time: Pairwise t-test comparisons of the
HMM and LSTM classifiers against the baseline show that they
both significantly outperform the baseline with large effect sizes
(\(p<0.01\), \(d\) range: 1.780 - 4.500, 1.707 - 2,681 for HMM and LSTM
respectively) for all data windows. Pairwise t-test comparisons
of the FUMA classifier against the baseline show that it
performs significantly worse than the baseline with large
effect sizes (\(p<0.01\), \(d\) range: 2.756 - 2.756 for HMM and LSTM
respectively) for all data windows. Previous work with FUMA
in MOOCs [28] showed higher accuracies for predicting high
and low learners, but that involved a richer and diverse dataset
including video-watching features and specific usage features.
This suggests that FUMA may not perform well on a dataset
like the CS1 MOOC which only involves simple features
related to student interface events. This is likely due to the
rule-based nature of the FUMA classifier, which requires
meaningful, curated features to build an accurate user model.
JUSThink Dataset: Figure 6 plots the percentage accuracies of
the four classifiers at each data window.
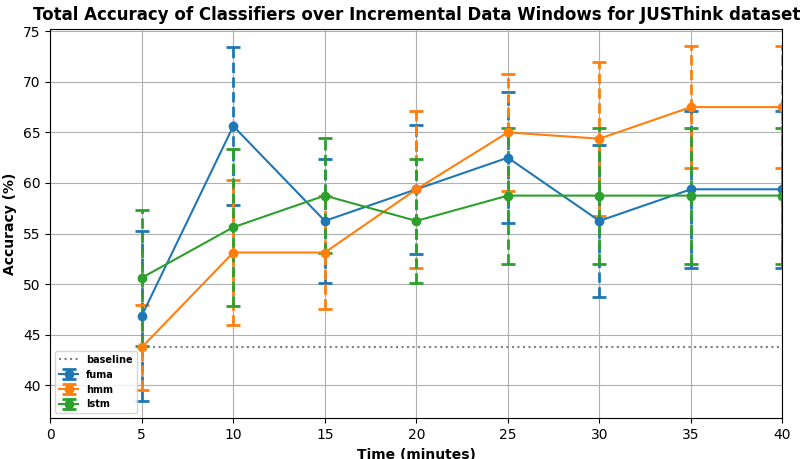
i) Comparisons at last window: Pairwise t-test comparisons of classifier accuracy at the last data window show that the HMM classifier has no significant difference to the LSTM (\(p>0.05\), \(d = 0.455\)) and FUMA classifiers (\(p>0.05\), \(d = 0.028\)), and significantly outperforms the baseline with a large effect size (\(p<0.05\), \(d = 0.967\)). We suspect that the lack of statistical significance is due to a small sample size rather than a lack of an effect, and it requires more data points to achieve statistical significance for the t-tests on this dataset. Although there is no significant difference between the HMM and the other classifiers, a trend is observed in fig. 6 similar to the other datasets where the HMM classifier seems to perform best by the end of the interaction with higher accuracies.
ii) Comparisons over time: Pairwise t-test comparisons of the HMM, FUMA, and LSTM classifiers against the baseline do not show any statistically significant differences at all data windows except at the last data window. Individual t-test comparisons between classifiers at each data window do not yield any statistically significant p-values as well, however at the 10-minute mark, statistical comparisons between FUMA and the other classifiers show moderate to large effect sizes (range of \(d\): 0.425 - 0.818) and minimal overlap in error bars, suggesting that FUMA might be suitable for early personalization in a collaborative learning setting.
7. MODEL INTERPRETABILITY
This section describes the top features for each classifier in each dataset in terms of the highest absolute value of PI and SHAP values. The baseline classifier is omitted as all the importance values are zero due to its output being independent of the features. Features with a negative importance have a value highlighted in red, and those with a positive importance are highlighted in green. A positive PI means that permuting that feature lowers accuracy, indicating that the feature is important for that classifier to make predictions, whereas a negative PI indicates that including the feature was detrimental to predictive performance. A positive SHAP value indicates the feature contributed towards increasing the value of the model output, ie. in terms of predicting the positive class (high learner performance), whereas a negative SHAP value indicates the feature contributed towards predicting the negative class (low learner performance).
Unity-CT: Table 6 lists the top features for Unity-CT. For the FUMA classifier, the top 3 important features match with those found in a previous study with Unity-CT [34], where these features were used to define interventions, namely - Moving a special ground object and frequency of playing/pausing the game. As FUMA is a rule-based classifier, the top PI features simply correspond to the most common occurrences in the feature trees that define the rule-based classifier. Two out of the three top SHAP features match the top PI features for FUMA, with the exception of the top SHAP feature: frequency of Remove Component. While this feature seemed to contribute the most to predicting high learner performance, its impact on overall model performance is quite low with a PI of 0.02. The HMM classifier has different top features suggesting a different mechanism for predicting learner type. Here as well, two out of three top features match between PI and SHAP. Interestingly, the top PI feature - Select Tool interval mean - impacted performance negatively. A student who irregularly uses the Select Tool and has a high interval mean would not be interacting with the game objects and is likely a low-performing student. The corresponding SHAP value tells us that this feature predicted high learner performance for the HMM, which explains the negative PI. We are unable to identify trends relating the top PI and SHAP values of the LSTM classifier in relation to its performance on the dataset as there was no consistency between the top PI and SHAP features.
| Unity-CT: Top 3 Features Based on PI and SHAP Values
| ||||
|---|---|---|---|---|
| Model | Feature (PI) | PI | Feature (SHAP) | SHAP |
|
FUMA | Move Ground Slide timefirst | 1.92 | Remove Component freq | 0.0200 |
| Play freq | 0.52 | Play freq | 0.0150 | |
| Stop freq | 0.50 | Move Ground Slide timefirst | 0.0063 | |
|
HMM | Select Tool interval mean | -3.83 | Select Tool interval sd | -0.0225 |
| Pause mean | 0.50 | Select Tool interval mean | 0.0150 | |
| Delete Ground count | 0.48 | Delete Ground count | 0.0113 | |
|
LSTM | Select Tool timefirst | 1.50 | Pause mean | -0.0039 |
| Unselect timefirst non_inc | 1.46 | Select Tool interval sd | 0.0021 | |
| Zoom interval mean | 1.44 | Delete Ground count | -0.0023 | |
CS1 MOOC: Table 7 lists the top features for CS1 MOOC dataset. Two out of three top PI and SHAP features are observed to match for FUMA and LSTM classifiers, and all three match for the HMM classifier. This is likely due to the simplicity of the data in the CS1 MOOC dataset. The top PI and SHAP feature for FUMA is run frequency, as opposed to text_insert_count for the HMM and LSTM models. Given that the HMM and LSTM models both outperform FUMA significantly in terms of performance, it suggests that this feature was indeed crucial to distinguish between learner types in this dataset. This finding alludes to a limitation of FUMA’s rule-based approach to be effective with simple datasets such as the CS1 MOOC. The LSTM classifier looks heavily reliant on text insertion, whereas the HMM classifier seems to emphasize both text insertion and removal. This may explain why the HMM classifier performs better towards the end of the interaction as compared to the LSTM classifier as student behavior tends to increase in complexity and reliance on multiple features may improve performance.
| CS1 MOOC: Top 3 Features Based on PI and SHAP Values
| ||||
|---|---|---|---|---|
| Model | Feature (PI) | PI | Feature (SHAP) | SHAP |
|
FUMA | Run frequency | 3.29 | Run frequency | 0.0138 |
| Text insert frequency | 1.32 | Text insert frequency | -0.0025 | |
| Submit frequency | -0.88 | Submit count | -0.0088 | |
|
HMM | Text insert count | 13.13 | Text insert count | 0.0400 |
| Text remove count | 10.30 | Text remove count | 0.0025 | |
| Focus gained count | 1.10 | Focus gained count | -0.0025 | |
|
LSTM | Text insert count | 30.05 | Text insert count | 0.0006 |
| Focus gained count | 2.07 | Text remove count | -0.0059 | |
| Run count | 1.30 | Focus gained count | -0.0012 | |
JUSThink: Table 8 lists the top features for the JUSThink dataset. As there are no statistical differences in accuracy, the impact of the differences in top features across classifiers on accurate prediction is uncertain. However, the LSTM classifier is observed to rely solely on two features whereas the FUMA and HMM classifiers rely on multiple features suggesting that the underlying mechanisms are different. Moreover, there no overlap in top features among the different classifiers suggesting that multiple behavioral patterns exist across different features in this dataset and can lead to equally accurate predictions.
| JUSThink: Top 3 Features Based on PI and SHAP Values
| ||||
|---|---|---|---|---|
| Model | Feature (PI) | PI | Feature (SHAP) | SHAP |
|
FUMA | Redundant exist | 6.25 | T overlap | -0.0200 |
| T overlap | 6.25 | T long pauses | -0.0150 | |
| Gaze at partner | 3.75 | Gaze at partner | 0.0113 | |
|
HMM | T add | 6.25 | T action | 0.0388 |
| Gaze at screen right non_inc | 3.13 | Redundant exist | 0.0113 | |
| Gaze at screen right | 3.13 | T add | 0.0088 | |
|
LSTM | T short pauses | 3.13 | T action | 0.0004 |
| T speech activity | 3.13 | T speech activity inc | 0.0006 | |
| T add | 0.00 | Gaze at screen right | -0.0008 | |
8. DISCUSSION
Across the three datasets — Unity-CT, CS1 MOOC, and JUSThink, the HMM classifier performed well and significantly outperformed the baseline for both early-stage and late-stage predictions in each dataset. In the CS1 MOOC and Unity-CT datasets, the LSTM shows potential for early predictions, and in the JUSThink dataset, FUMA shows potential for early predictions. Thus, while the HMM classifier provides consistently high accuracy across datasets, the choice of classifier for real-time personalization in adaptive learning environments can depend on the learning context or required timing of the personalized interventions.
Our results on model interpretability with PI and SHAP values provided more insights into these classifiers. First, results for the FUMA classifier in the Unity-CT dataset align with previous work in that the most impactful features overlap with the important features identified by Murali et. al [34]. In all datasets, the HMM and LSTM classifiers had different top features as compared to FUMA showcasing different underlying mechanisms. There was some overlap in top SHAP features between the HMM and LSTM indicating that there may be some common student behavioral patterns that were picked up by both classifiers. On the other hand, there were some differences in the way these classifiers relied on certain important features for predictive performance. The LSTM classifier often heavily relied on only one feature as seen in the simple but large CS1 MOOC dataset and two features in the complex and small JUSThink dataset, whereas the HMM classifier relied on more features.
Overall, when choosing a classifier to build an adaptive support system, one has to consider to what extent is it valuable to understand why the classifier makes a certain prediction. FUMA is a rule-based classifier and is inherently interpretable in simple interaction datasets (it is not always interpretable as is the case with data in more unstructured environments [34]). The inherent transparency of the FUMA model due to its feature trees makes it a good candidate model for those who definitely require transparent classifiers for adaptive personalization. On the other hand. both the HMM and LSTM classifiers lack inherent interpretability, and while insights using PI and SHAP values may provide a general idea of which features contribute the most to predictions (which may not always be useful to understand the classifier as was the case in the Unity-CT and JUSThink datasets), they are unable to explain individual predictions. Thus, to choose the most suitable classifier for a specific application, one must consider the tradeoff between accuracy and interpretability, and whether personalization can be provided with a simple understanding of important features, or if personalization requires a more sophisticated understanding of the inner workings of the classifier.
9. CONCLUSIONS AND FUTURE WORK
This paper addresses the need for a comparative evaluation of classifiers for sequential interaction data in learning. This paper compared classifiers that use sequential interaction data to predict learner types for personalized adaptive support across multiple learning contexts. This is the first attempt at a systematic evaluation of classifiers in different open-ended learning datasets and testing them in a cross-validation schema. Moreover, further insights into model interpretability are provided using XAI tools like PI and SHAP values. The results and statistical analysis showed that the HMM classifier performed best overall, however, depending on the specific context, required timing of the personalized interventions, or the need for inherent interpretability, one may choose to opt for another classifier like the LSTM or FUMA classifier. These findings may be useful to practitioners looking to implement a personalization mechanism in any context where sequential interaction data is leveraged including learning environments, as well as researchers interested in analyzing interaction datasets. While the datasets this paper focuses on arise in learning, our analysis applies to any context where predictions are needed using sequential interaction data.
For future work, larger multimodal datasets are desired and the impact of different modalities on classifier performance could be studied. While beyond the scope of this paper, future work may look into dissecting the interpretability of the HMM and LSTM classifiers in more detail by looking at local explanation techniques like LIME [33] which may provide more insights into individual personalization, or it may be possible to identify specific transitions between hidden states in the HMM-based classifier that correspond to learning behaviors, offering a form of post-hoc interpretability similar to Nasir et. al [38]. Future work also entails acquiring larger multimodal interaction datasets and testing out more sophisticated classifiers.
10. REFERENCES
- Solmaz Abdi, Hassan Khosravi, and Shazia Sadiq. Predicting student performance: the case of combining knowledge tracing and collaborative filtering. In Proceedings of the International Conference on Educational Data Mining, pages 545–548, 2018.
- Fatima Ahmed Al-Azazi and Mossa Ghurab. Ann-lstm: A deep learning model for early student performance prediction in mooc. heliyon, 9(4), 2023.
- Abdulaziz Salamah Aljaloud, Diaa Mohammed Uliyan, Adel Alkhalil, Magdy Abd Elrhman, Azizah Fhad Mohammed Alogali, Yaser Mohammed Altameemi, Mohammed Altamimi, and Paul Kwan. A deep learning model to predict student learning outcomes in lms using cnn and lstm. IEEE Access, 10:85255–85265, 2022.
- André Altmann, Laura Toloşi, Oliver Sander, and Thomas Lengauer. Permutation importance: a corrected feature importance measure. Bioinformatics, 26(10):1340–1347, 2010.
- Tadas Baltrušaitis, Peter Robinson, and Louis-Philippe Morency. Openface: an open source facial behavior analysis toolkit. In 2016 IEEE winter conference on applications of computer vision (WACV), pages 1–10. IEEE, 2016.
- Satabdi Basu, Gautam Biswas, and John S Kinnebrew. Learner modeling for adaptive scaffolding in a computational thinking-based science learning environment. User Modeling and User-Adapted Interaction, 27:5–53, 2017.
- Carole Beal, Sinjini Mitra, and Paul Cohen. Modeling learning patterns of students with a tutoring system using hidden markov model, in proceedings of the 13th international conference on artificial intelligence in education (aied), r. luckin et al.(eds), marina del rey, july 2007.
- Yoav Benjamini and Yosef Hochberg. Controlling the false discovery rate: a practical and powerful approach to multiple testing. Journal of the Royal statistical society: series B (Methodological), 57(1):289–300, 1995.
- Karen Brennan and Mitchel Resnick. New frameworks for studying and assessing the development of computational thinking. In Proceedings of the 2012 annual meeting of the American educational research association, Vancouver, Canada, volume 1, page 25, 2012.
- Tadeusz Caliński and Jerzy Harabasz. A dendrite method for cluster analysis. Communications in Statistics-theory and Methods, 3(1):1–27, 1974.
- Wan Chong Choi, Chan-Tong Lam, and António José Mendes. Analyzing the interpretability of machine learning prediction on student performance using shapley additive explanations. In 2024 IEEE International Conference on Teaching, Assessment and Learning for Engineering (TALE), pages 1–8. IEEE, 2024.
- Jacob Cohen. Statistical power analysis for the behavioral sciences new york. NY: Academic, 54, 1988.
- Cristina Conati and Sébastien Lallé. 8. student modeling in open-ended learning environments. Handbook of Artificial Intelligence in Education, pages 170–183, 2023.
- Mohammad H Falakmasir, José P González-Brenes, Geoffrey J Gordon, and Kristen E DiCerbo. A data-driven approach for inferring student proficiency from game activity logs. In Proceedings of the third (2016) acm conference on learning@ scale, pages 341–349, 2016.
- Shaheen S Fatima, Michael Wooldridge, and Nicholas R Jennings. A linear approximation method for the shapley value. Artificial Intelligence, 172(14):1673–1699, 2008.
- Lauren Fratamico, Cristina Conati, Samad Kardan, and Ido Roll. Applying a framework for student modeling in exploratory learning environments: Comparing data representation granularity to handle environment complexity. International Journal of Artificial Intelligence in Education, 27:320–352, 2017.
- Mark Hall, Eibe Frank, Geoffrey Holmes, Bernhard Pfahringer, Peter Reutemann, and Ian H Witten. The weka data mining software: an update. ACM SIGKDD explorations newsletter, 11(1):10–18, 2009.
- Michael Hannafin, Susan Land, and Kevin Oliver. Open learning environments: Foundations, methods, and models. In Instructional-design theories and models, pages 115–140. Routledge, 2013.
- Michael J Hannafin. Open-ended learning environments: Foundations, assumptions, and implications for automated design. In Automating instructional design: Computer-based development and delivery tools, pages 101–129. Springer, 1995.
- Michael J Hannafin, Craig Hall, Susan Land, and Janette Hill. Learning in open-ended environments: Assumptions, methods, and implications. Educational Technology, 34(8):48–55, 1994.
- Janette R Hill and Susan M Land. Open-ended learning environments: A theoretical framework and model for design. 1998.
- S Kardan and C Conati. A framework for capturing distinguishing user interaction behaviours in novel interfaces. In EDM 2011 4 th International Conference on Educational Data Mining, page 159, 2011.
- Samad Kardan and Cristina Conati. Providing adaptive support in an interactive simulation for learning: An experimental evaluation. In Proceedings of the 33rd Annual ACM Conference on Human Factors in Computing Systems, pages 3671–3680, 2015.
- Tanja Käser and Daniel L Schwartz. Modeling and analyzing inquiry strategies in open-ended learning environments. International Journal of Artificial Intelligence in Education, 30(3):504–535, 2020.
- Erica Kleinman, Sabbir Ahmad, Zhaoqing Teng, Andy Bryant, Truong-Huy D Nguyen, Casper Harteveld, and Magy Seif El-Nasr. ” and then they died”: Using action sequences for data driven, context aware gameplay analysis. In Proceedings of the 15th International Conference on the Foundations of Digital Games, pages 1–12, 2020.
- James A Koziol and Zhenyu Jia. The concordance index c and the mann–whitney parameter pr (x> y) with randomly censored data. Biometrical Journal: Journal of Mathematical Methods in Biosciences, 51(3):467–474, 2009.
- Sébastien Lallé, Özge Nilay Yalçın, and Cristina Conati. Combining data-driven models and expert knowledge for personalized support to foster computational thinking skills. In LAK21: 11th International Learning Analytics and Knowledge Conference, pages 375–385, 2021.
- Sébastien Lallé and Cristina Conati. A data-driven student model to provide adaptive support during video watching across moocs. In Proceedings of AIED 2020, the 21st International Conference on Artificial Intelligence in Education, Ifrane, Morocco, 2020.
- Susan M Land. Cognitive requirements for learning with open-ended learning environments. Educational Technology Research and Development, 48(3):61–78, 2000.
- Juho Leinonen. Open ide action log dataset from a cs1 mooc. In Educational Data Mining in Computer Science Education Workshop. Zenodo, 2022.
- Weiqiang Lin, Natasa Milic-Frayling, Ke Zhou, and Eugene Ch’ng. Predicting outcomes of active sessions using multi-action motifs. In IEEE/WIC/ACM International Conference on Web Intelligence, pages 9–17, 2019.
- Yutong Liu, Si Fan, Shuxiang Xu, Atul Sajjanhar, Soonja Yeom, and Yuchen Wei. Predicting student performance using clickstream data and machine learning. Education Sciences, 13(1):17, 2022.
- Scott M Lundberg and Su-In Lee. A unified approach to interpreting model predictions. In I. Guyon, U. Von Luxburg, S. Bengio, H. Wallach, R. Fergus, S. Vishwanathan, and R. Garnett, editors, Advances in Neural Information Processing Systems, volume 30. Curran Associates, Inc., 2017.
- Rohit Murali, Sébastien Lallé, and Cristina Conati. An intelligent pedagogical agent for in-the-wild interaction in an open-ended learning environment for computational thinking. In Proceedings of the 24th ACM International Conference on Intelligent Virtual Agents, 2024.
- Marcell Nagy and Roland Molontay. Interpretable dropout prediction: towards xai-based personalized intervention. International Journal of Artificial Intelligence in Education, 34(2):274–300, 2024.
- Jauwairia Nasir. Introducing productive engagement for social robots supporting learning. Technical report, EPFL, 2022.
- Jauwairia Nasir, Mortadha Abderrahim, Barbara Bruno, and Pierre Dillenbourg. An hmm-based real-time intervention methodology for a social robot supporting learning. pages 2204–2211, 08 2023.
- Jauwairia Nasir, Mortadha Abderrahim, Aditi Kothiyal, and Pierre Dillenbourg. Temporal pathways to learning: How learning emerges in an open-ended collaborative activity. Computers and Education: Artificial Intelligence, 3:100093, 2022.
- Jauwairia Nasir, Barbara Bruno, and Pierre Dillenbourg. Pe-hri-temporal: a multimodal temporal dataset in a robot mediated collaborative educational setting. URL: https://doi. org/10.5281/zenodo, 5576058, 2021.
- Fabian Pedregosa, Gaël Varoquaux, Alexandre Gramfort, Vincent Michel, Bertrand Thirion, Olivier Grisel, Mathieu Blondel, Peter Prettenhofer, Ron Weiss, Vincent Dubourg, et al. Scikit-learn: Machine learning in python. The Journal of Machine Learning Research, 12:2825–2830, 2011.
- Lawrence R Rabiner. A tutorial on hidden markov models and selected applications in speech recognition. Proceedings of the IEEE, 77(2):257–286, 1989.
- Peter J Rousseeuw. Silhouettes: a graphical aid to the interpretation and validation of cluster analysis. Journal of computational and applied mathematics, 20:53–65, 1987.
- Tasmia Shahriar and Noboru Matsuda. What and how you explain matters: Inquisitive teachable agent scaffolds knowledge-building for tutor learning. In International Conference on Artificial Intelligence in Education, pages 126–138. Springer, 2023.
- Paras Sharma, Angela EB Stewart, Qichang Li, Krit Ravichander, and Erin Walker. Building learner activity models from log data using sequence mapping and hidden markov models. 2024.
- Robin Turkington, Maurice Mulvenna, RR Bond, Siobhan O’Neill, and Cherie Armour. The application of user event log data for mental health and wellbeing analysis. In British HCI Conference 2018. BCS Learning & Development Ltd, 2018.
- Sixuan Wang and Bin Luo. Academic achievement prediction in higher education through interpretable modeling. Plos one, 19(9):e0309838, 2024.
- Yong Yu, Xiaosheng Si, Changhua Hu, and Jianxun Zhang. A review of recurrent neural networks: Lstm cells and network architectures. Neural computation, 31(7):1235–1270, 2019.
1Four students from the original dataset were dropped as they only had a single row of data.
2We chose a larger increment than in the Unity-CT or JUSThink datasets as the interaction length was considerably longer in the CS1 MOOC
3In the same manner described in section 3.1
4C-index [26], Calinski-Harabasz index [10], Silhouettes [42]
5The clusters were usually labeled as high/low learners based on a sample of proxy measures for learner performance
6For FUMA, we use the hyper-parameters in a previous application [27]. For the HMM and LSTM, we chose a range of hyperparameters with computational constraints in mind.
7p-values were adjusted for multiple comparisons using Benjamini/Hochberg correction [8]
8Guidelines for d are 0.2 (small), 0.5 (medium), and 0.8 (large) as per [12]
© 2025 Copyright is held by the author(s). This work is distributed under the Creative Commons Attribution-NonCommercial-NoDerivatives 4.0 International (CC BY-NC-ND 4.0) license.