ABSTRACT
Instruction in many STEM domains heavily relies on visual representations, such as graphs, figures, and diagrams. However, students who lack representational competencies do not benefit from these visual representations. Therefore, students must learn not only content knowledge but also representational competencies. Further, as learning progresses, knowledge likely becomes more abstract, so that content knowledge may no longer be tied to a specific representation. This raises the question of whether students integrate representational competencies with content knowledge as learning progresses. The present study addresses this question by building knowledge-component models using log data collected from two studies in an introductory electrical engineering course. We compared knowledge-component models that separate representational competencies from content knowledge to knowledge-component models that integrate representational competencies with content knowledge. Our results show that as learning progressed, integrated knowledge-component models had better model fit. This finding indicates that over time, students’ representational competencies become gradually integrated into content knowledge. Further, this suggests that different knowledge-component models might be needed at different times during a learning progression.
Keywords
INTRODUCTION
The success of adaptive educational technologies depends on analyses of students’ knowledge growth during their interaction with problem-solving activities. These analyses equip the educational technology with information about the students’ current learning progress to mastery of the targeted knowledge [32] and enables it to provide adaptive feedback or to select appropriate interventions [16] based on the individual student’s learning progress [7]. This capability has contributed to the success of adaptive educational technologies [30].
Therefore, much research has investigated how to analyze students’ knowledge growth based on log data generated by students’ problem-solving interactions in educational technologies. The first step in analyzing knowledge growth is to capture students’ knowledge in a way that can then be used to trace their knowledge acquisition over time [4, 7]. Knowledge-component models are a common way of capturing students’ knowledge [15]. The basic assumption of knowledge-component models is that knowledge consists of fine-grained “atom-like” components [15]. Hence, knowledge-component modeling seeks to identify all knowledge components required for mastering the targeted knowledge [13].
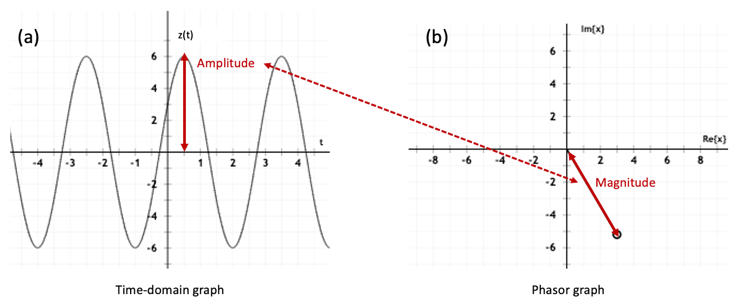
Traditional knowledge-component models have focused on capturing content knowledge. However, focusing on only content knowledge may not adequately enable educational technologies to support students’ learning, especially in STEM fields. Previous research showed that, students often have difficulties understanding visual representations, while most STEM instruction heavily relies on multiple visual representations [2, 17]. Such struggles can impede their content learning [24]. For example, electrical engineering courses on signal processing frequently use visual representations as shown in Fig. 1 to explain concepts related to sinusoids. While visual representations are often thought to support learning [1], they can impede learning for students who do not know how to interpret the visual representations. For instance, if the students are unfamiliar with time-domain graphs (Fig. 1a) or phasor graphs (Fig. 1b), they may struggle to understand the concept of the sinusoid. This example typifies that many instructional scenarios expect students to have representational competencies. Representational competencies are defined as the knowledge and skills that enable students to understand and use visual representations to reason and solve tasks [9].
While most research on knowledge-component models has focused on content knowledge, only a few studies show that capturing representational competencies in addition to content knowledge improves the fit of knowledge-component models [25]. A limitation of these studies is that they have assumed a static structure of knowledge-component models; that is, representational competencies and content knowledge were captured as separate knowledge components, and this did not change over time. However, as learning progresses, students’ content knowledge likely becomes more abstract and their use of representational competencies becomes more automated. Thus, the goal of this paper is to address this limitation by comparing knowledge-component models that separate or integrate representational competencies and content knowledge in various ways.
Literature review
In the following, we first review research on representational competencies. Then, we briefly review the few prior studies that have captured representational competencies in knowledge-component models.
Representational Competencies
The educational psychology has identified several types of representational competencies that enable students to learn content knowledge from visual representations [24].
First, students need visual-understanding competencies: the ability to map visual features to relevant to-be-learned content [28]. In the previously mentioned example of a student learning about sinusoids, visual-understanding competencies allow the student to map a visual feature (e.g., the peak in the time-domain graph) to the concept it depicts (e.g., the amplitude of a sinusoid).
Second, students need conceptual connection-making competencies: the ability to conceptually understand similarities and differences between multiple visual representations [1]. This allows students to explain how domain-relevant concepts are depicted in different visual representations [29]. For example, the red arrow in Fig. 1 illustrates how a student should connect the amplitude in the time-domain graph (Fig. 1a) to the phasor’s magnitude in the phasor graph (Fig. 1b). Conceptual connection-making competencies also involve identifying visual features that have surface similarities among visual representations but are conceptually irrelevant [11]. For example, a student may notice that both the time-domain graph (Fig. 1a) and the phasor graph (Fig. 1b) have two axes. Yet, the axes represent different concepts: time and amplitude in the time-domain graph, the imaginary and real parts of the phasor in the phasor graph.
Third, students need perceptual connection-making competencies: the ability to effortlessly and efficiently translate between multiple visual representations [12]. Students with perceptual connection-making competencies can intuitively translate between two visual representations and quickly judge whether they depict the same concept, without experiencing mental effort when executing this task [12]. For example, a perceptually proficient student would see "at a glance" the phasor graph in Fig. 1b represents the amplitude of the sinusoid in Fig. 1a.
Knowledge-Component Model
Adaptive educational technologies require information about the students’ learning progress in order to provide individualized support. [30]. They must describe the knowledge students have already learned and what knowledge they still have to learn [6]. Furthermore, adaptive educational technologies rely on algorithms that predict which types of support (e.g., contextual feedback, choice of problem-solving activities) would help the student acquire the knowledge s/he has not yet learned [21].
Educational technologies rely on knowledge-component models to trace students’ knowledge acquisition and to predict the growth of students’ knowledge. Knowledge-component models represent “acquired units of cognitive function that can be inferred from performance on a set of related tasks” [15]. Here, knowledge components refer to a unit of distinct skills or concepts, which together compose the knowledge students learn in problem-solving activities. Therefore, the accuracy of a knowledge-component model depends on identifying all relevant knowledge components that describe the targeted knowledge [13, 16].
Cognitive Task Analysis (CTA) is one prominent method to describe the requisite knowledge components to perform a task [33]. However, since CTA relies on a thorough analysis of how experts solve tasks, it is time consuming. To increase the efficiency of knowledge-component modeling, educational data mining techniques can be used to automate the process of building models, including learning factors analysis (LFA) [4], Knowledge Spaces [31], and matrix factorization [8]. Typically, multiple potential models are compared using Akaike Information Criterion (AIC) and Bayesian Information Criterion (BIC) scores [14]. However, since this research has focused mostly on modeling content knowledge, the interplay between representational competencies and content-focused knowledge components remains unexamined.
One study compared knowledge-component models that captured (1) only content knowledge and (2) content knowledge and representational competencies. Capturing both content knowledge and representational competencies resulted in better model fit [25]. A follow-up study tested whether adapting instructional support to students’ representational competencies in addition to content knowledge resulted in higher learning outcomes than adapting only to content knowledge [23]. Results showed that adapting to students’ representational competencies in addition to content knowledge enhanced students’ learning of content knowledge.
However, this prior research is limited in two ways. First, while most prior research focuses on modeling content knowledge [18, 20], the few studies that have also modeled representational competencies [23, 25] have focused on a particular domain; namely chemistry. Therefore, we seek to replicate these findings in another domain. A second limitation is that the prior studies assumed that the structure of the knowledge-component model remains static over time. Yet, according to expert-novice research, students gradually acquire highly abstract schemas about the content knowledge relevant to a given domain [5, 10]. This yields the hypothesis that capturing representational competencies separately from content knowledge is most important early in a learning progression whereas later in a learning progression, representational competencies likely become integrated with content knowledge.
Hypotheses
To address the limitations of prior research just described, we test:
Hypothesis 1: A knowledge-component model that captures representational competencies and content knowledge is more accurate than a knowledge-component model that captures only content knowledge or a knowledge-component model that captures only representational competencies.
Hypothesis 2. As students’ learning progresses, a knowledge-component model that integrates content knowledge and representational competencies is more accurate than a knowledge-component model that captures content knowledge separately from representational competencies.
Datasets
To test these hypotheses, we use log data generated from students’ problem-solving interactions in Signals Tutor, an intelligent tutoring system (ITS) for undergraduate electrical engineering. In the following, we first describe the problem-solving activities in Signals Tutor, and then the log data we used to test our hypotheses.
Signals Tutor
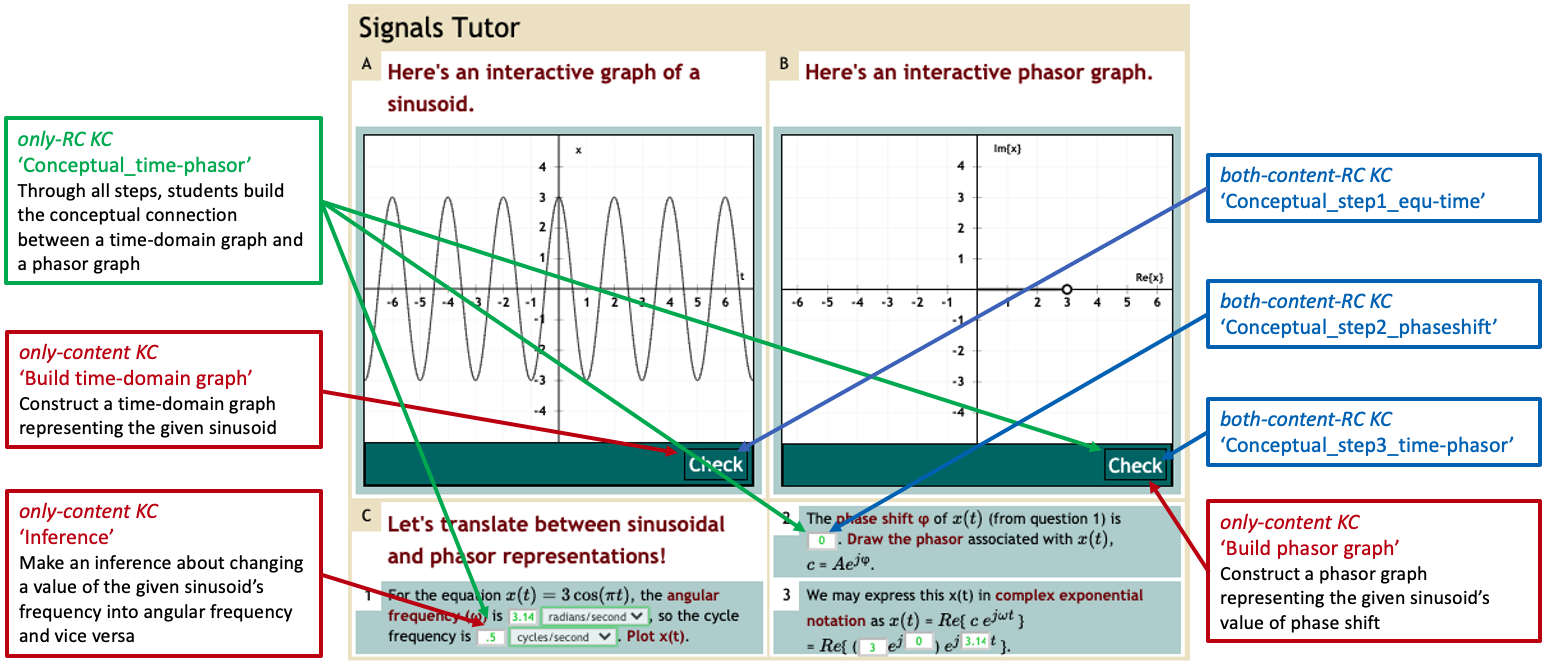
Signals Tutor supports learning through problem solving [22, 27, 30]. As is typical for ITSs, Signals Tutor provides step-by-step guidance for complex problem-solving tasks [30], detects multiple possible solution paths, provides personalized feedback that addresses diagnosed misconceptions, and on-demand hints for each step. As illustrated in Fig. 2, students work with interactive visual representations to visually depict concepts related to sinusoids.
Because Signals Tutor incorporates multiple visual representations, it offers opportunities for students to practice representational competencies. Specifically, students practice visual-understanding competencies when they interact with one visual to make sense of sinusoid concepts. Students practice conceptual connection-making competencies when they have to integrate information from multiple visual representations to understand sinusoid concepts. They practice perceptual connection-making competencies when a task requires translating quickly among multiple visual representations to extract relevant information about sinusoids.
Log Data
We collected log data from two studies that were conducted as part of an introductory electrical engineering course on signal processing at a university in the Midwestern U.S. Study 1 was conducted in Fall 2020; Study 2 was conducted in Spring 2021. The course was taught online during both semesters. Students used Signals Tutor as part of the course for a study described elsewhere [26]. The present paper focuses on log data generated from students’ interactions with two units of Signals Tutor that provided opportunities to practice the representational competencies described above. Specifically, we extracted 84,960 transactions generated by 136 students from Study 1 log data and 76,786 transactions generated by 145 students from Study 2. These transactions involved problem-solving steps where students constructed visual representations and equations and answered conceptual questions by selecting answers from drop-down menus or via text input.
Analysis
To test hypothesis 1, we created knowledge-component models with and without representational competencies. To test hypothesis 2, we created several knowledge-component models that captures the integration of content knowledge and representational competencies. We compared the fit of each model in the earlier vs. the later unit of Signals Tutor.
Knowledge-Component Models with and without Representational Competencies
To test hypothesis 1, we created three knowledge-component models: (1) the only-content-KC model captures only content knowledge, (2) the only-RC-KC model captures only representational competencies, and (3) the both-content-and-RC-KC model captures both content knowledge and representational competencies. The knowledge components captured by each model were derived from manual cognitive task analysis relying on expert content knowledge provided by an engineering professor who taught the course for more than 30 years/decades.
First, the only-content-KC model contains 9 only-content knowledge components that describe concepts and skills irrespective of the representational competencies, listed in Table 1. For example, the knowledge component ‘Inference’ in Table 1 refers students’ ability to make an inference about changing a value of the given sinusoid’s frequency into the angular frequency.
Second, the only-RC-KC model captures only representational competencies but not content knowledge. It contains 11 knowledge components, listed in Table 1. As mentioned above, Signals Tutor offers opportunities to practice three types of representational competencies. The only-RC-KC model describes the competencies students need to understand the visual representations used in the problems; for example, conceptual connection-making competencies (e.g., ‘Conceptual_time-phasor’) and perceptual connection-making competencies (e.g., ‘Perceptual_time-phasor’) related to translating a time-domain graph to a phasor graph.
Finally, the both-content-and-RC-KC model captures both content knowledge and representational competencies. It contains 42 knowledge components, listed in Table 1. To develop content knowledge of translating a time-domain to a phasor graph, students practice competencies for making both conceptual and perceptual connections among visuals. For example, consider the following steps that provided practice opportunities for conceptual connection-making competencies. Students first built a time-domain graph representing a given sinusoid represented in the equation form (e.g., ‘Conceptual_step1_equ-time’ KC in Table 1). The next step is to find the value of phase shift (e.g., ‘Conceptual_step2_phaseshift’), which is basis for building a corresponding phasor graph in the next step. In the third step, students translate the time-domain graph to a phasor graph (e.g., ‘Conceptual_step3_time-phasor’).
Hypothesis 1 predicts that the both-content-and-RC-KC model has better model fit than the other knowledge-component models.
Knowledge Components | Examples of knowledge components | Description | Example |
|---|---|---|---|
only-content KC | Inference | Make inferences about changing the value of frequency to angular frequency or vice versa. | is has an angular frequency of in radians/sec. The frequency in cycles/sec is [.25]. |
Planning | Plan how to represent the sinusoid using different type of visual representation. | The complex amplitude can be represented visually by a [phasor]. | |
Build phasor graph | Construct a phasor graph of a given sinusoid | Plot the phasor corresponds to . | |
Build time-domain graph | Construct a time-domain graph of a given sinusoid | Plot this sinusoid on the given time-domain graph. | |
only-RC KC | Conceptual_time-phasor | Make sense of how a time-domain visual correspond to a given phase-domain visual | The given graph shows a sinusoid . Plot the phasor corresponding to . |
Perceptual_phasor-time | Translate a phase-domain visual to a time-domain visual | Here’s a phasor. Which cosine function represents that phasor? | |
both- content-and-RC KC | Conceptual_step1_equ_time | Given a cosine function, build a time-domain graph representing the given time-domain equation | For the equation , plot . |
Conceptual_step2_phaseshift | After building a time-domain graph in step 1, identify its value of phase shift | The phase shift of is [0]. | |
Conceptual_step3_time-phasor | Based on identified information in step 2, translate a time-domain graph to a phasor graph | Draw the phasor associated with , . | |
Conceptual_step4_phasor-exp | After building a phasor graph in step 3, write corresponding complex exponential notation. | We may express in complex exponential notation as exp(exp | |
Perceptual_time-phasor (clockwise) | Translate a time-domain graph to a phasor graph (rotated in the clockwise direction) | Here’s a sinusoid (cosine function). Which phasor represents that sinusoid? | |
Perceptual_time-phasor (counter-clock) | Translate a time-domain graph to a phasor graph (rotated in the counter-clockwise direction) | Here’s a sinusoid (cosine function). Which phasor represents that sinusoid? |
Knowledge-Component Models with and without abstracted Knowledge Components
To test hypothesis 2, we created two knowledge-component models: (1) the separate-RC-KC model describes the knowledge structure of students starting at the novice-level (2) the integrated-RC-KC model describes the knowledge structure of students reaching to the expert-level through working on Signals Tutor, detailed in the following.
First, based on learning gains we observed between units [26], we assumed that structural changes in knowledge components would occur between units 1 and 2. Therefore, we chose to investigate knowledge components that were common to units 1 and 2 and examined how these knowledge components changed after finishing each unit. Thus, starting with the list of knowledge components in the both-content-and-RC-KC model described in 5.1, we identified 33 knowledge components that unit 1 and unit 2 had in common. This yielded the separate-RC-KC model. Given that this knowledge-component model separately captures content knowledge and representational competencies, we anticipate that this might capture the knowledge structure of novice students in the first unit.
Second, based on previous studies’ finding that sufficient training makes students’ knowledge become abstracted [5, 10] or abstracted away from the type of representational competencies [25], we assumed that students’ knowledge components started to be integrated into content knowledge after finishing unit 1. Thus, we identified lists of knowledge components from the both-content-and-RC-KC model that describe similar content knowledge. For example, in Signals Tutor, students learn about concepts related to the phase shift of sinusoids, which we classify as content knowledge. Depending on how students interact with the visual representations that depict these concepts, they practice different representational competencies. The both-content-and-RC-KC model contains six knowledge components related to phase shift, illustrated in Table 1: three knowledge components describe students’ ability to conceptually connect a sinusoid’s shifted amount and direction shown in a time-domain graph to a phasor’s rotational direction and amount shown in a phasor graph (e.g., ‘Conceptual_step1_equ_time’, ‘Conceptual_step2_phaseshift’, ‘Conceptual_step3_time-phasor’), and two knowledge components describe students’ ability to make perceptual connections between a time-domain graph and a phasor graph by treating the representations holistically (e.g., ‘Perceptual_time-phasor (0)’, ‘Perceptual_time-phasor (clockwise)’, ‘Perceptual_time-phasor (counter-clock)’).
If these six representational competencies become more integrated with content knowledge about phase shift after practice (hypothesis 2), separating these representational competencies from content knowledge may no longer adequately describe students’ abstracted knowledge structure. To capture this more abstracted understanding, we built new knowledge-component models that contained merged knowledge components. Starting with the knowledge components from the separate-RC-KC model, we first merged knowledge components that covered similar content knowledge. For example, ‘Conceptual_step1_equ_time’, ‘Conceptual_step2_phaseshift’, ‘Conceptual_step3_time-phasor’ and ‘Perceptual_time-phasor (clockwise)’ were merged into the ‘Build phasor graph’ knowledge component, which is one of the knowledge components from the only-content KC model. We then tested whether merging these knowledge components improved model fit using AIC and BIC scores. If it did, we kept the merged knowledge component; if it did not, we kept the separated knowledge components. We repeated these steps until there were no more opportunities to merge knowledge components. We carried out these steps separately for the data from Studies 1 and 2, yielding integrated-RC-KC model-1 and integrated-RC-KC model-2 as shown in shown in Table 2.
Hypothesis 2 predicts that the integrated-RC-KC model-1 and the integrated-RC-KC model-2 have a better model fit compared to the separate-RC-KC model in unit 2. Similarly, since students are novice at the beginning stage, hypothesis 2 predicts that the separate-RC-KC model shows better model fit compared to the integrated-RC-KC model-1 and the integrated-RC-KC model-2 in unit 1.
Separate KCs in unit 1 | Integrated KCs in unit 2 |
|---|---|
Conceptual_step3_time-phasor | Build phasor graph (integrated-RC-KC model-1) |
Perceptual_time-phasor (0) | |
Perceptual_time-phasor (clockwise) | |
Perceptual_time-phasor (counter-clockwise) | |
Perceptual_phasor-exp | Write complex exponential notation (integrated-RC-KC model-1) |
Conceptual_step4_phasor-exp | |
Perceptual_phasor-cartesian | Write cartesian form (integrated-RC-KC model-2) |
Individual_phasor-cartesian (real part) | |
Individual_phasor-cartesian (imaginary part) |
Results
To test hypothesis 1, we compared the model fit of the only-content-KC model, only-RC-KC model, and both-content-and-RC-KC model using data from Studies 1 and 2. Table 3 shows that the both-content-and-RC-KC model has a better model fit than the only-content-KC model and the only-RC-KC model in Study 1 and Study 2. For AIC scores, the lower AIC indicate a better-fit-model, and more than -2 is considered significantly better than model it is being compared [3]. Similarly, a decrement greater than 10 indicates very strong evidence in terms of BIC [19]. Lower values of RMSE also indicate better fit. These results support hypothesis 1.
To address hypothesis 2, we compared the model fit of the separate-RC-KC model, the integrated-RC-KC model-1, and the integrated-RC-KC model-2 as shown in Table 4. For Study 1, results show that in unit 1, the separate-RC-KC model shows the better fit than the integrated-RC-KC models. By contrast, in unit 2, the integrated-RC-KC model-1 shows better model fit than the separate-RC-KC model in terms of AIC and RMSE (but based on BIC the integrated-RC-KC model-2 shows the best model fit). This supports hypothesis 2.
For Study 2, we found that in unit 1, the separate-RC-KC model shows a better model fit than the integrated-RC-KC models in terms of AIC as shown in Table 5. However, the BIC and RMSE scores indicated that the integrated-RC-KC model-1 had the best model fit. By contrast, in unit 2, the integrated-RC-KC model-2 shows the best model fit. This result supports hypothesis 2 in terms of AIC scores. For BIC and RMSE scores, the results partially support hypothesis 2, because the integrated-RC-KC model-1 shows the better model fit than the integrated-RC-KC model-2.
Study | KC Model | # of KC | AIC | BIC | RMSE |
|---|---|---|---|---|---|
1 | both-content-and-RC | 42 | 22,123 | 24,221 | 0.4422 |
only-RC | 34 | 22,736 | 24,709 | 0.4456 | |
only-content | 9 | 23,853 | 25,446 | 0.4537 | |
2 | both-content-and-RC | 42 | 18,559 | 20,358 | 0.4370 |
only-RC | 34 | 19,120 | 20,796 | 0.4421 | |
only-content | 9 | 20,133 | 21,418 | 0.4544 |
Unit | RC-KC Model | # of KC | AIC | BIC | RMSE |
|---|---|---|---|---|---|
1 | separate-RC-KC model | 33 | 9,733 | 11,488 | 0.4367 |
integrated-RC-KC model-1 | 30 | 9,779 | 11,491 | 0.4368 | |
integrated-RC-KC model-2 | 27 | 9,803 | 11,492 | 0.4374 | |
2 | separate-RC-KC model | 33 | 10,387 | 12,133 | 0.4414 |
integrated-RC-KC model-1 | 30 | 10,372 | 12,075 | 0.4387 | |
integrated-RC-KC model-2 | 27 | 10,396 | 12,054 | 0.4399 |
Unit | RC-KC Model | # of KC | AIC | BIC | RMSE |
|---|---|---|---|---|---|
1 | separate-RC-KC model | 33 | 8,134 | 9,587 | 0.4445 |
integrated-RC-KC model-1 | 30 | 8,156 | 9,567 | 0.4431 | |
integrated-RC-KC model-2 | 27 | 8,201 | 9,570 | 0.4461 | |
2 | separate-RC-KC model | 33 | 9,095 | 10,598 | 0.4278 |
integrated-RC-KC model-1 | 30 | 9,085 | 10,546 | 0.4263 | |
integrated-RC-KC model-2 | 27 | 9,080 | 10,498 | 0.4264 |
Discussion
Our results show that the knowledge-component model incorporating both representational competencies and content knowledge had the best model fit (hypothesis 1). This result aligns with findings from a previous study that investigated whether a knowledge-component model should incorporate representational competencies using chemistry students’ learning data. Our results replicate this finding in the electrical engineering domain.
Further, we found that students’ representational competencies become abstracted and integrated with content knowledge as students practice representational competencies (hypothesis 2). This shows that as students’ learning progress, their representational competencies are gradually merged with content knowledge. We note that the time at which each representational competency is integrated into the content knowledge may not be uniform. For instance, while students’ representational competency of translating a time-domain graph to a phasor graph were merged with content knowledge in unit 2, the representational competency of translating a phasor graph to a time-domain graph remained separate from content knowledge. It is possible that after more practice, the latter representational competency would also merge with content knowledge.
Additionally, our results indirectly suggest that students’ timelines may differ depending on their learning rates. Specifically, we found differences between the Study 1 and Study 2 cohorts. The fact that BIC, AIC, RMSE disagreed as to whether the integrated-RC-KC model-1 or the separate-RC-KC model had a better model fit for unit 1suggests that students in Study 2 started with somewhat more integrated knowledge and ended with more integrated knowledge compared to students in Study 1. We do not want to speculate what might have caused these cohort effects because there are numerous possible reasons, but it suggests that students may start and end at different points on a separate-to-integrated knowledge trajectory.
Our study makes novel contributions to the field of educational data mining because it is, to our knowledge, the first study capturing dynamic development of students’ representational competencies using knowledge-component models. Knowledge-component modeling allowed us to identify dynamic, developmental patterns of representational competencies and to show that they are not static. Further, our finding that knowledge-component models should incorporate representational competencies in addition to content knowledge expands the search space for knowledge-component models in future work.
Our findings also have important implications for the design of adaptive educational technologies. First, technologies that use visual representations should trace students’ acquisition of representational competencies in addition to content knowledge. Doing so is particularly important at the beginning of a learning sequence. When students first learn a new concept with visual materials, instructional supports should be designed with consideration of students’ representational competencies and content knowledge. Second, as students’ representational competencies change dynamically through practice, the educational technology may no longer need to monitor representational competencies separately from content knowledge. This, however, may need to be adapted to the rate at which students learn specific representational competencies and content knowledge.
Limitations & Future Work
Our results should be interpreted considering the following limitations. First, we collected log data from students working on Signals Tutor in the context of online learning. Online learning differs from in-person learning in multiple ways. Therefore, future studies should replicate our results in the context of in-person learning. Second, our experiment was constructed in a specific electrical engineering course. Even though visual representations are commonly used in many STEM instructions, representational competencies are domain-specific and highly dependent on the particular content knowledge covered. Thus, future research needs to test whether our results generalize to other STEM domains and topics. Finally, open questions remain about the suitable length of a learning intervention to ensure that all representational competencies become integrated with content knowledge. Although this study found that the students’ representational competencies are gradually integrated with content knowledge, it did not examine when each representational competency becomes fully integrated into the content knowledge. To address this limitation, a longer intervention is needed. Such research could help establish the length of learning trajectories that relate to representational competencies.
Conclusion
The present paper shows that the structure of students’ knowledge changes over time. Consequently, different knowledge-component models are best suited at different times during a learning trajectory. While modeling representational competencies is important, representational competencies become integrated with content knowledge with practice. Thus, educational technologies should employ dynamic knowledge-component models that capture representational competencies separately from content knowledge at the beginning of a learning trajectory while merging them with content knowledge later in a learning sequence. The way in which these knowledge components are merged may depend on the student’s learning rate. Given that prior research shows that adapting instructional support to students’ representational competencies can significantly enhance their learning of content knowledge and given the prevalence of visual representations in STEM instruction, our study may have considerable impact on the effectiveness of educational technologies.
ACKNOWLEDGMENTS
This work was supported by NSF DUE 1933078 (IUSE). We also thank Talha Sultan, Eduardo Arvelo, and the teaching assistants for their help with this project.
REFERENCES
- Ainsworth, S. 2006. DeFT: A conceptual framework for considering learning with multiple representations. Learning and Instruction 16, 3 (2006), 183–198.
- Arcavi, A. 2003. The role of visual representations in the learning of mathematics. Educational Studies in Mathematics 52, 3 (2003), 215–241.
- Cavanaugh, J.E. and Neath, A.A. 2019. The Akaike information criterion: Background, derivation, properties, application, interpretation, and refinements. Wiley Interdisciplinary Reviews: Computational Statistics 11, 3 (2019), e1460.
- Cen, H. et al. 2006. Learning Factors Analysis – A General Method for Cognitive Model Evaluation and Improvement. Intelligent Tutoring Systems (Berlin, Heidelberg, 2006), 164–175.
- Chi, M.T.H. et al. 1981. Categorization and representation of physics problems by experts and novices. Cognitive Science 5, 2 (1981), 121–152.
- Corbett, A. et al. 2000. Modeling Student Knowledge: Cognitive Tutors in High School and College. User Modeling and User-Adapted Interaction 10, 2 (2000), 81–108.
- Corbett, A.T. and Anderson, J.R. 1994. Knowledge tracing: Modeling the acquisition of procedural knowledge. User Modeling and User-Adapted Interaction 4, 4 (1994),
- Desmarais, M.C. and Naceur, R. 2013. A Matrix Factorization Method for Mapping Items to Skills and for Enhancing Expert-Based Q-Matrices. Artificial Intelligence in Education (Berlin, Heidelberg, 2013), 441–450.
- diSessa, A.A. 2004. Metarepresentation: Native Competence and Targets for Instruction. Cognition and Instruction 22, 3 (2004), 293–331.
- Dreyfus, H.L. et al. 1986. Five steps from novice to expert. Mind over machine: The power of human intuition and expertise in the era of the computer. (1986), 16–51.
- Gentner, D. and Markman, A.B. 1997. Structure mapping in analogy and similarity. American Psychologist 52, 1 (1997), 45–56.
- Kellman, P.J. and Garrigan, P. 2009. Perceptual learning and human expertise. Physics of Life Reviews 6, 2 (2009), 53–84.
- Koedinger, K.R. et al. 2012. Automated Student Model Improvement. International Educational Data Mining Society.
- Koedinger, K.R. et al. 2015. Data mining and education. Wiley Interdisciplinary Reviews: Cognitive Science 6, 4 (2015), 333–353.
- Koedinger, K.R. et al. 2012. The Knowledge‐Learning‐Instruction Framework: Bridging the Science‐Practice Chasm to Enhance Robust Student Learning. Cognitive Science 36, 5 (2012), 757–798.
- Koedinger, K.R. et al. 2013. Using Data-Driven Discovery of Better Student Models to Improve Student Learning. Artificial Intelligence in Education (Berlin, Heidelberg, 2013), 421–430.
- Kozma, R. 2003. The material features of multiple representations and their cognitive and social affordances for science understanding. Learning and Instruction 13, 2 (2003), 205–226.
- Long, Y. et al. 2018. What exactly do students learn when they practice equation solving? refining knowledge components with the additive factors model. Proceedings of the 8th International Conference on Learning Analytics and Knowledge (New York, NY, USA, 2018), 399–408.
- Lorah, J. and Womack, A. 2019. Value of sample size for computation of the Bayesian information criterion (BIC) in multilevel modeling. Behavior Research Methods 51, 1 (2019), 440–450.
- Nguyen, H. et al. 2019. Using Knowledge Component Modeling to Increase Domain Understanding in a Digital Learning Game. International Conference on Educational Data Mining (Montreal, Canada, Jul 2 - 5, 2019). 139-148.
- Papousek, J. et al. 2014. Adaptive Practice of Facts in Domains with Varied Prior Knowledge. Proceedings of the 7th International Conference on Educational Data Mining (London, UK, July 4-7, 2014), 6–13.
- Rau, M.A. 2017. A Framework for Educational Technologies that Support Representational Competencies. IEEE Transactions on Learning Technologies 10, 3 (2017), 290–305.
- Rau, M.A. et al. 2021. Adaptive support for representational competencies during technology-based problem solving in chemistry. Journal of the Learning Sciences 30, 2 (2021), 163–203.
- Rau, M.A. 2017. Conditions for the Effectiveness of Multiple Visual Representations in Enhancing STEM Learning. Educational Psychology Review 29, (2017), 717–761.
- Rau, M.A. 2017. Do Knowledge-Component Models Need to Incorporate Representational Competencies? International Journal of Artificial Intelligence in Education. 27, 2 (. 2017), 298–319.
- Rho, J. and Rau, M. A. Preparing future learning with novel visuals by supporting representational competencies. Artificial Intelligence in Education (Durham, UK, July 27 - 31, 2022), in press.
- Ritter, S. et al. 2007. What evidence matters? A randomized field trial of Cognitive Tutor Algebra I. Frontiers in artificial intelligence and applications 162, (2007), 13.
- Schnotz, W. 2005. An integrated model of text and picture comprehension. The Cambridge handbook of multimedia learning 49, (2005), 69.
- Seufert, T. 2003. Supporting coherence formation in learning from multiple representations. Learning and Instruction 13, 2 (2003), 227–237.
- VanLehn, K. 2011. The Relative Effectiveness of Human Tutoring, Intelligent Tutoring Systems, and Other Tutoring Systems. Educational Psychologist 46, 4 (2011), 197–221.
- Villano, M. 1992. Probabilistic student models: Bayesian Belief Networks and Knowledge Space Theory. Intelligent Tutoring Systems (Berlin, Heidelberg, 1992), 491–498.
- Xhakaj, F. et al. 2016. How Teachers Use Data to Help Students Learn: Contextual Inquiry for the Design of a Dashboard. Adaptive and Adaptable Learning (2016), 340–354.
- Yates, K.A. and Clark, R.E. 2012. Cognitive task analysis. International Handbook of Student Achievement. New York, Routledge. (2012).
© 2022 Copyright is held by the author(s). This work is distributed under the Creative Commons Attribution-NonCommercial-NoDerivatives 4.0 International (CC BY-NC-ND 4.0) license.