ABSTRACT
Several studies adopt different approaches to examining how economic, racial, and gender circumstances influence student performance in large-scale entrance exams, such as the National High School Exam (ENEM). Using a methodology based on Item Response Theory, ENEM’s exam attempts to assess, for each item (question), the curve (function) that relates the participants’ abilities to their probabilities of correctly answering the item, which is assumed to hold whichever subgroup, a fundamental premise of IRT called invariance. This work analyzes whether the ENEM 2019 test presented similar curves for subpopulations defined by gender, race, and income, regardless of the participant’s actual abilities. Our approach is to analyze the properties of the observed curve for each group and then perform a non-parametric ranking test to compare the equity of each item (question) for each analyzed characteristic. We found that the "Languages and Codes" questions consistently favored male, white, and high-income participants. At the same time, the other three sets of questions (Mathematics, Natural Sciences, and Human Sciences) were considerably more egalitarian.
Keywords
1. INTRODUCTION
The Brazilian National High School Exam (ENEM, for its initials in Portuguese) is one of the most extensive entrance exams globally, having over 5 million participants registered in 2019 [11]. The exam has several functions; on an individual scale, it serves as an admission test to access the federal universities (through the Unified Selection System or SISU) and access to the federal scholarship programs (University for All Program or ProUni). On a collective scale, this exam allows a comparison between schools and municipalities, and it also serves as an indicator for national public educational policies at the national level [10]. Several studies investigated how sensible characteristics such as income, race, gender, and locality, affect the participants’ score [13, 20, 19]. However, most studies use the grade obtained as a direct indicator of the participants’ ability without investigating whether exams’ grading methodologies are unfairly favoring or disfavoring specific subpopulations.
Since 2009, ENEM’s participants’ grades have been assigned using Item Response Theory (IRT) methods, which consider the difficulty of each participant’s correct questions [7] to assign the grades, in contrast to the Classical Test Theory, where only the number of correct answers matter [4]. IRT creates a probability function that gives, for each question, the probability of a correct answer given the participant’s ability. Moreover, the primary assumption of IRT theory is that such function does not vary independently of subgroups of students [7, 16]. This assumption means that, given two groups based on a specific characteristic (e.g., men and women), we expect the proportion of correct answers for a particular question and grade to be similar in both groups. If that is not the case for several questions in a test, the method will end up a sub or super estimating a group’s grade, causing inequality between the groups.
We investigate ENEM’s 2019 edition to evaluate whether the invariant assumption holds for gender, race, and income level characteristics. For such, we use the assigned grades and participant’s answers given by ENEM’s IRT evaluation to approximate the Item Characteristic Curves (ICCs) — which are functions of the probability of correct answer given the participant score. We compare the standard deviation of the observed Area Under Curve (AUC) for each group based on a characteristic (such as men and women for the gender). If a group has a bigger AUC than another group, their participants have a more significant overall probability of correctly answering the question, independently of their true abilities. Therefore, questions showing a high AUC standard deviation for a particular characteristic may favor a group. Following the first analysis, we perform a non-parametric ranking test to check if the behavior found in the questions is statistically consistent in the whole test.
Thus, this paper uses statistical analysis to evaluate whether or not the ICC’s estimation of IRT theory might favor particular groups. The contributions of our analysis reside in these aspects: (1) Analyzing whether the question estimations per se discriminate towards certain groups instead of evaluating the grades themselves. (2) Using robust non-parametric statistical tests to determine if these differences are consistently privileging a specific group.
2. DATA
We used ENEM’s most recent microdata from 2019, composed of four objective tests, each containing 45 multiple choice questions and an essay. The tests evaluate the knowledge areas: Mathematics, Languages and Codes, Human Sciences, and Natural Sciences. The Languages and Codes test consists of five foreign language questions, where the participant chooses whether to be evaluated in English or Spanish, and the remaining 40 questions are in Portuguese. Each participant must take all of the tests.
The National Institute of Educational Studies and Research Anísio Teixeira (INEP), responsible for the ENEM, made available the microdata per participant. These data are anonymized and contain the scores obtained, each participant’s answers, registration data (such as city, age, and school), and a non-mandatory socioeconomic questionnaire about (self-declared) race, family income, and parent’s education and profession. We analyze three group characteristics obtained from the questionnaire:
Race: There are five options in addition to “undeclared": white, black, brown, yellow (Asian), and indigenous. We analyzed only the first three (white, black, and brown), as the others have few participants.
Income: Family income is defined as monthly minimum wages (MW), and the possible range goes from zero to twenty or more MW. Based on Neri et al. (2020) [14], we separate the participants into low (less than 1/2 MW per capita), middle (between 1/2 and 2 MW per capita), and high-income (more than two MW per capita) classes.
Gender: The exam’s registration only allowed for “Female" and “Male" to be mandatory in its selection. Therefore, we do not have information about other gender minorities.
As the parameters of the grading methodology used by ENEM are estimated using only the responses of students who are regular graduates in that particular year, our analysis will use data from such students who answered the questions of gender, race, and income. Table 1 summarizes the number of analyzed participants in each subgroup divided by the different characteristics.
3. ENEM SCORE ESTIMATION
The method used to obtain the ENEM participants’ score is from the Item Response Theory (IRT) [8], which models the probability of a participant responding correctly to an item (or question) as a function of its parameters and the participant’s ability (or proficiency). Several increasing monotonic functions are used to model such a relationship such as the Rasch model [15], and the one and two-parameter logistic models [12, 2]. We employed ENEM’s three-parameter logistic function [2], that is the probability of a correct answer by participant to item (event ) given the proficiency parameter and item parameters , , and :
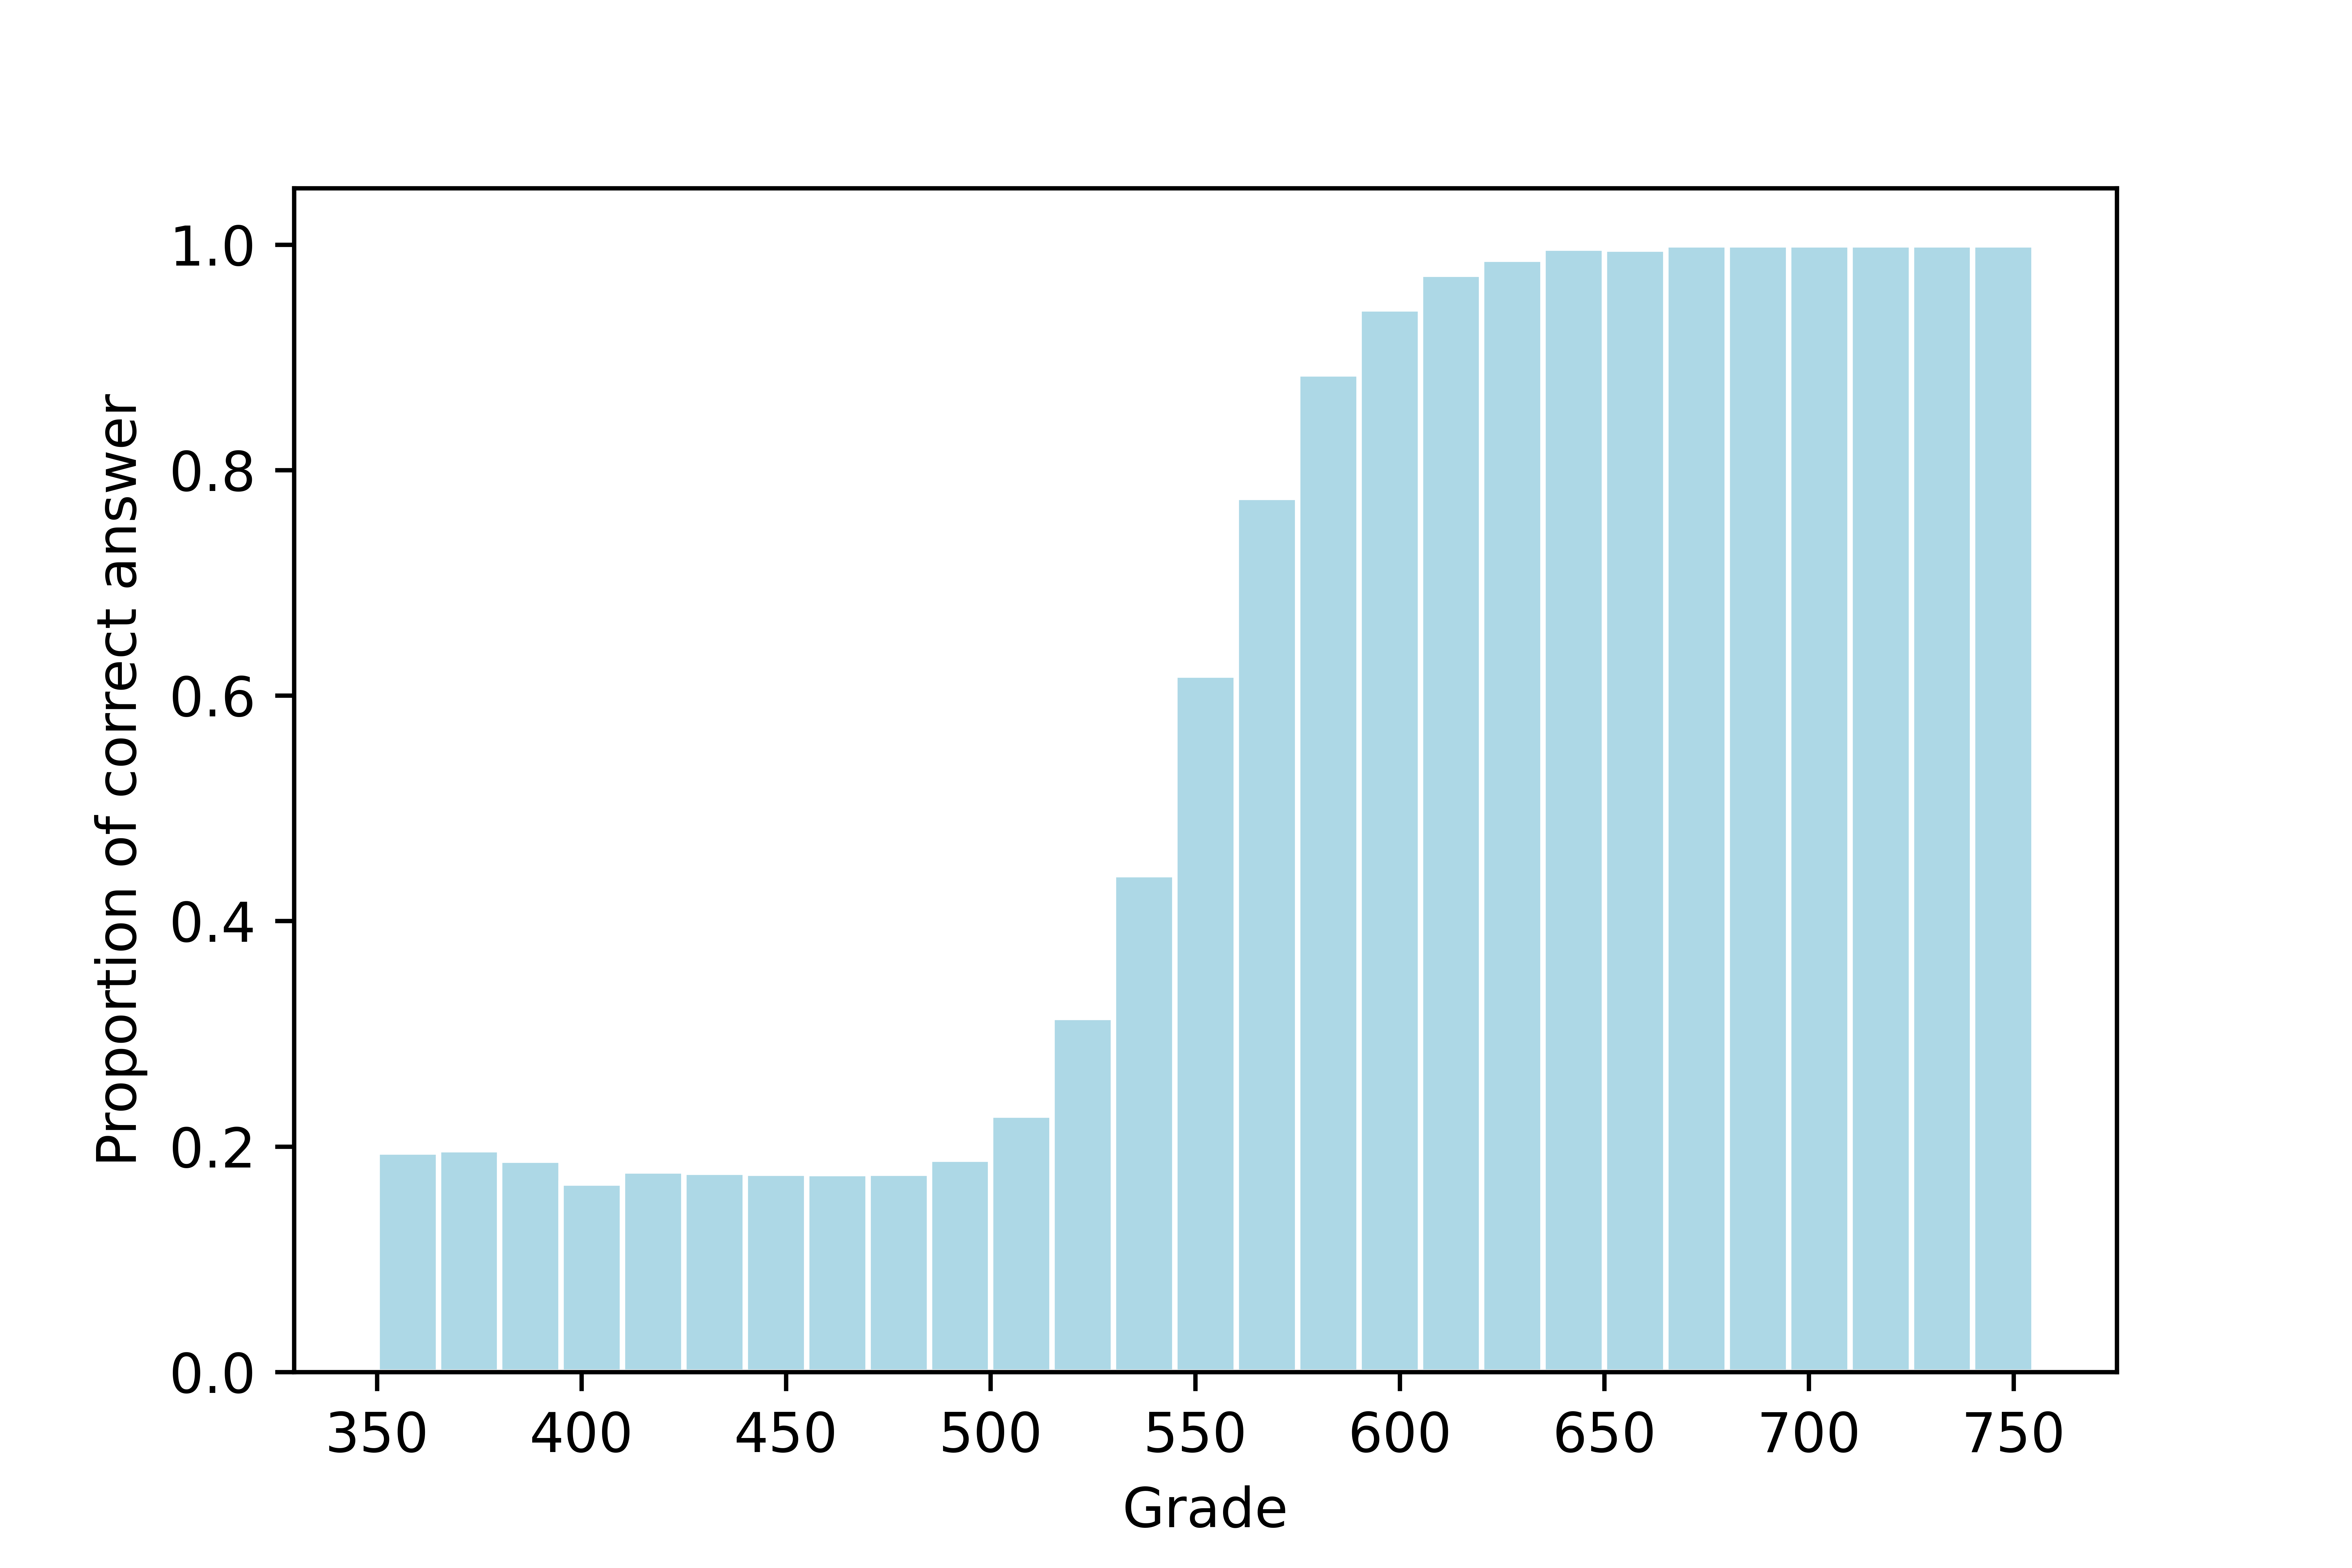
(1)The relationship between and the parameters , , and is called the Item Characteristic Curve (ICC). Figure 1 illustrates an example of this curve.

Both the item parameters and the participants scores are estimated simultaneously using the participants answers. The scores are estimated, given the item parameters, using the Expected a Posteriori (EAP) method with an a priori probability function, which is the same for all participants. The a priori distribution has mean and variance corresponding to the mean and variance of regular graduating participants in 2009, defined as and points, respectively. More information is available in the participant guides [8, 9] and their bibliographic references [1, 3, 7].
Invariance: Item Response Theory starts from the premise that, for a given question, a single function maps an examinee’s ability to his probability of answering it correctly. Therefore, if the model is well specified, all populations’ parameters are the same. This premise implies the property called invariance of item and ability parameters, which is the primary distinction between IRT and classical test theory [7]. Under invariance, we have that the parameters that characterize an item do not depend on the participants’ ability distribution and that the participant ability parameter does not depend on the set of test items.
In practice, invariance does not occur in the strict sense, even when the model is correctly specified [7]. Nevertheless, it is essential to determine the “degree" to which invariance holds. Next, we present how we examine the invariance of the items concerning the subpopulations defined by gender, race, and income.
4. METHODOLOGY
We use the concept of Item Characteristic Curves to compare the performance of each analyzed group in each question. The advantage of such comparison is that it allows us to disregard distinct distributions of scores as we analyze the probability of a correct answer given the participant score. For such, we analyze the observed ICCs, which were constructed considering the proportion of participants who answered the item correctly for different score ranges.
4.1 AUICC Inspection
Under invariance, we expect the relationship between the participants’ scores and the probability of correctly answering a specific question (i.e., the item characteristic curve) to be similar to all groups. Therefore, the area under the item characteristic curve of a specific question should be near equal to all groups. We calculated how different the observed AUICC is for each group of a specific characteristic with the following steps:
1. Observed ICC: For each question and subpopulation, the observed ICC was the proportion of participants who answered correctly given their score range.
2. Item AUICC: To compare the difficulties of each question, we calculated the area under the item characteristic curve for each subpopulation and the total population. The AUICC can be interpreted as: if a group has a higher AUICC for a question, then it has a higher probability of answering it correctly regardless of possible abilities; therefore, the item is less difficult for that group. Figure 2 shows the Item AUICC calculation.
3. AUICC discrepancy: Lastly, we estimated the discrepancy of difficulty for each item and each analyzed characteristic (gender, race, and income) by taking the standard deviation of AUICC for the groups and normalized this value by dividing by the AUICC found for the total population. This normalized value indicates whether inequality seems to hold for this item (small values) or not (bigger values).
4.2 Invariance Checking
The item-by-item AUICC comparison indicates potentially troubling questions. However, to show if there is a consistent difference among the social/gender groups, we performed a non-parametric Friedman ranking test [6, 18] (as implemented in [17]). We performed this test for each exam to see if there are statistical differences among the groups considering a set of items’ AUICCs for each social/gender group. For a fixed exam and characteristic, the test procedure involves ranking the groups’ AUICC for each question and then comparing the ranks obtained for each group. Therefore, if we have questions and groups, the Friedman test determines if any of the groups ranked consistently higher or lower than the others.
For the combination of tests and features whose null hypothesis was rejected by the Friedman test, we determine the one-by-one comparisons through a Finner post-hoc test [5] using the pivot quantities obtained by the previous test. Friedman test checks the hypothesis all groups are equal. If rejected Finner post-hoc test distinguish how each group performs compared to the others.
5. RESULTS
5.1 AUICC Inspection
We performed the Observed ICC analysis to all selected characteristics and the Mathematics (MT), Languages and Codes (LC), Human Sciences (HS), and Natural Sciences (NS) tests. The proportion of corrected answers was calculated for sets of participants’ scores with a bin size of . For the Languages and Codes test (LC), we separated the questions based on the idiom (Portuguese, English, and Spanish). Every participant takes the Portuguese questions but can choose whether to take English or Spanish as the foreign language questions.
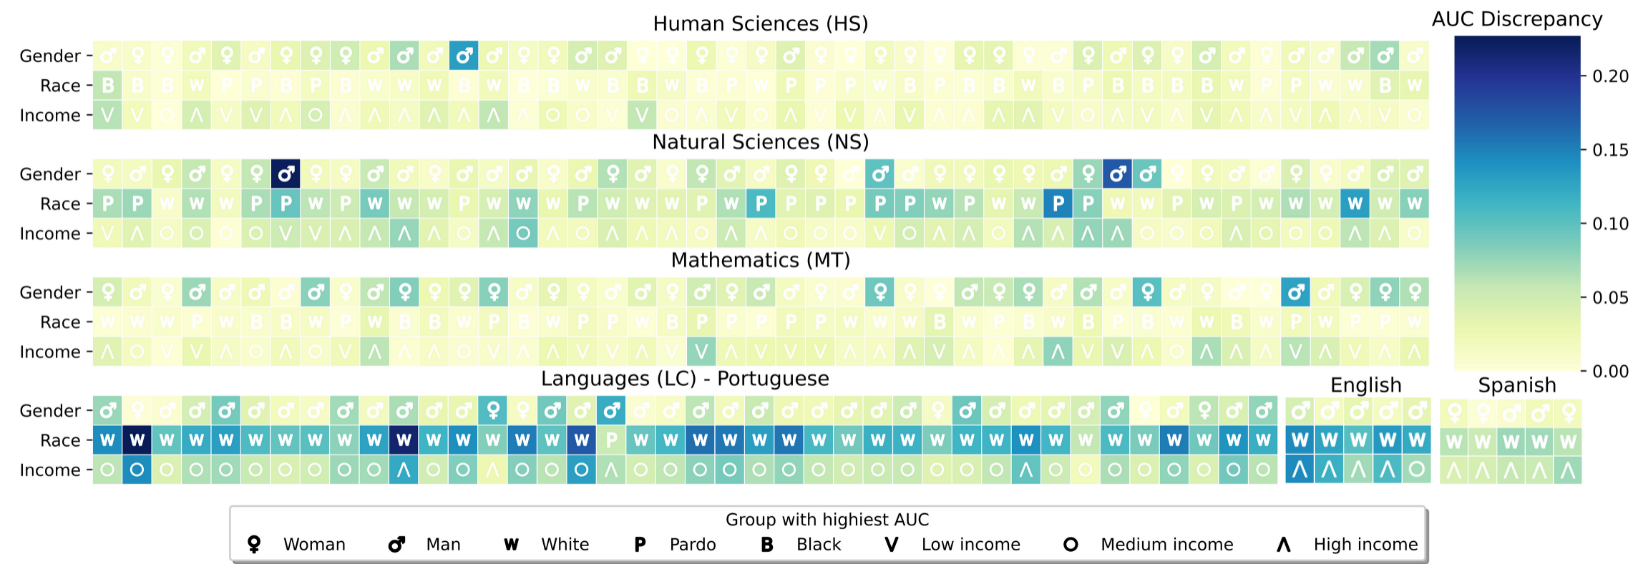
The results are summarized in Figure 3, where for each exam, we have a heatmap where each row of squares indicates which characteristic was analyzed, and the squares in the same columns correspond to the same question. The color of the squares denotes the value of Area discrepancy for that question in the given characteristic, where the darker tons are equivalent to the greater discrepancy, and the symbol indicates which group had the highest area. The color scale is the same for all exams. Therefore, if a particular row contains several dark squares, it indicates that the corresponding exam may be unequal for that given characteristic. If the symbols on the squares are mainly the same, such a given group is more frequently favored in such an exam.
Visually, we can see that a few questions have high difficulty discrepancy for the HS, NS, and MT tests. However, the group with the highest area in such questions varies significantly. For instance, in MT and NS, the most discrepant questions are almost equally divided between man and woman, being the group with the highest area. However, the LC test behaved quite differently. For the race characteristic, almost all of the questions presented high difficulty discrepancy, with the white group being dominant as the race with the highest area. Meanwhile, the income groups did not show a consistent dominance of a specific group for the question in Portuguese. However, they did show a strong dominance of the high income group in the foreign language questions, mainly in English. This result indicates that the first three tests are egalitarian for gender, race, and income, while the LC test, principally the foreign language questions, is not.
5.2 Invariance Checking
To assess whether the behavior observed in the visual comparison is consistent, we performed the Friedman and Finner tests with the AUICCs. Agreeing with the first experiment, the Human Sciences (HS) and Mathematics (MT) tests did not show a consistent favoring or disfavoring for any group, having a p-value greater than in the Friedman test. Meanwhile, the Languages and Codes questions in Portuguese and in English showed a relevant difference among men and women, with women having a lower AUICC rank.
Regarding the Race characteristic, the Natural Sciences (NS) test showed lower AUICC for black participants than white and pardo participants. The Portuguese questions in the LC exam showed similar behavior to the NS test, with the only difference being that the pardo participants had a lower AUICC rank than the white ones. In both foreign languages questions (English and Spanish), the black participants showed a lower AUICC rank than white. Lastly, for the Income characteristic, the low-income group ranked lower than the high-income for NS and also LC in all languages. For the NS test, the low-income also ranked lower in AUICC than the medium-income participants.
6. CONCLUSIONS
This paper investigated whether the 2019 edition of the Brazilian National High School Exam (ENEM) presented any consistent favor or disfavor for groups based on Gender, Race, and Income Level. Our methodology assessed if the invariance property of Item Response Theory (IRT) holds for Item Characteristic Curves (ICC) estimated for each group given its participants’ assigned grades and answers. In our first analysis, we visually compared the overall difficulty of each question and for each group. Then, in our second analysis, we tested if any of the exams were consistently unequal for any group. We found that the Human Sciences and Mathematics questions did not favor or disfavor any group. Meanwhile, the Natural Sciences test was consistently easier for white and pardo participants in detriment of black ones and easier for high- and medium-income in detriment of low-income.
The “Languages and Codes" exam was consistently unequal, with different ICC’s (that assigns questions difficulty) behavior for native and foreign language questions. Portuguese questions were overall harder for women than men, primarily due to the first group having a higher chance of correctly guessing the questions. They were also harder for black and pardo participants than white ones and harder for lower-income than medium- and high-income. Foreign language questions also showed inequality, with the English questions favoring men in detriment to women and both English and Spanish questions favoring white participants in detriment of black and high-income in detriment of low-income.
This research also cataloged means of improving IRT: (1) using the analysis of this work to evaluate and possibly reformulate the exam; (2) using data mining methods called multi-task learning to create particular models for each group; (3) using imbalance-robust data mining methods to avoid ICC’s bias towards favored groups; and (4) using multi-objective optimization to take into consideration multiple goals (fit the data and keep the model fair). We believe this research contributes to reaching fairer IRT-based tests with the analysis and those future directions.
7. REFERENCES
- F. B. Baker and S.-H. Kim. Item response theory: Parameter estimation techniques. CRC Press, 2004.
- A. Birnbaum. Some latent trait models and their use in inferring an examinee’s ability. 1968.
- D. F. de Andrade, H. R. Tavares, and R. da Cunha Valle. Teoria da resposta ao item: conceitos e aplicações. ABE, Sao Paulo, 2000.
- R. F. DeVellis. Classical test theory. Medical care, pages S50–S59, 2006.
- H. Finner. On a monotonicity problem in step-down multiple test procedures. Journal of the American statistical association, 88(423):920–923, 1993.
- M. Friedman. The use of ranks to avoid the assumption of normality implicit in the analysis of variance. Journal of the american statistical association, 32(200):675–701, 1937.
- R. K. Hambleton, H. Swaminathan, and H. J. Rogers. Fundamentals of item response theory, volume 2. Sage, 1991.
- Instituto Nacional de Estudos e Pesquisas Educacionais Anísio Teixeira (Inep). Entenda a sua nota no Enem: guia do participante, 2012.
- Instituto Nacional de Estudos e Pesquisas Educacionais Anísio Teixeira (Inep). Entenda a sua nota no Enem: guia do participante, 2021.
- Instituto Nacional de Estudos e Pesquisas Educacionais Anísio Teixeira (Inep). Exame nacional do ensino médio (enem) - apresentação, 2022.
- Instituto Nacional de Estudos e Pesquisas Educacionais Anísio Teixeira (Inep). Painéis enem, 2022. Last accessed 23 February 2022.
- F. Lord. A theory of test scores. Psychometric monographs, 1952.
- R. O. Melo, A. C. d. Freitas, E. d. R. Francisco, and M. T. Motokane. Impact of socioeconomic variables on enem performance: a spatial and sociologic analysis. Revista de Administração Pública, 55:1271–1294, 2022.
- M. NERI. Covid, classes econômicas e o caminho do meio: Crônica da crise até agosto de 2020. Sumário Executivo), FGV Social, Rio de Janeiro, RJ–Outubro, 2020.
- G. Rasch. Probabilistic models for some intelligence and attainment tests. ERIC, 1993.
- S. P. Reise, K. F. Widaman, and R. H. Pugh. Confirmatory factor analysis and item response theory: two approaches for exploring measurement invariance. Psychological bulletin, 114(3):552, 1993.
- I. Rodríguez-Fdez, A. Canosa, M. Mucientes, and A. Bugarín. STAC: a web platform for the comparison of algorithms using statistical tests. In Proceedings of the 2015 IEEE International Conference on Fuzzy Systems (FUZZ-IEEE), 2015.
- D. J. Sheskin. Handbook of parametric and nonparametric statistical procedures. Chapman and Hall/CRC, 2003.
- R. Travitzki, M. E. Ferrão, and A. P. Couto. Desigualdades educacionais e socioeconômicas na população brasileira pré-universitária: Uma visão a partir da análise de dados do enem. Education Policy Analysis Archives/Archivos Analíticos de Políticas Educativas, 24:1–32, 2016.
- R. R. Valente. The vicious circle: effects of race and class on university entrance in brazil. Race ethnicity and education, 20(6):851–864, 2017.
© 2022 Copyright is held by the author(s). This work is distributed under the Creative Commons Attribution-NonCommercial-NoDerivatives 4.0 International (CC BY-NC-ND 4.0) license.