ABSTRACT
Depicting causal relationships using Directed Acyclic Graphs (DAGs) has been recognized as an interesting and important methodology from multiple perspectives in Educational Data Mining (EDM). Being able to work with DAGs allows us to gain actionable insights to provide better learning environments and outcomes for students; it allows us to notice and judge algorithmic bias and can even serve as a feature selection tool. Yet, DAGs are often not well known among researchers in EDM. We propose a half-day tutorial aimed at researchers and PhD students with no or only theoretical knowledge of causality and DAGs. The tutorial will consist of a glimpse into the theoretical foundation of causality and DAGs, a practical part on constructing and learning from DAGs using the tool DAGitty, and a theoretical and practical part on learning DAGs from data using the R package bnlearn.
Keywords
1. INTRODUCTION AND MOTIVATION
Predictive models are almost ubiquitous in Educational Data
Mining (EDM) [1]. These models can answer questions such as
“Who is likely to fail a course?”, “Who is likely to drop out of
school?”, or “Is a specific student likely to be able to answer a
question correctly?”. Although predictive models can be very
helpful, we are often interested in more information than they
can provide. As our ultimate goal is to increase students’
learning outcomes and experiences, we also want answers to
questions such as “What can a certain student do to increase
their chances of passing?”, “Why is a student likely to
drop out?”, or “Would the chances of correctly answering
the question be higher if they had done another question
first?”.
In other words, we aim to receive actionable insights, and in
recent years, increasingly more research has stressed the
importance of such insights [9, 2, 11]. A prominent approach to
answering the above questions is to use post-hoc Explainable
Artificial Intelligence (XAI) methods, such as LIME, SHAP, or
DiCE, which are capable of returning information regarding
which variables are relevant for predictions and whether the
prediction would change if certain values were different [9, 2].
Although this is very interesting and important in its own right,
using these insights to inform our interventions to increase
learning outcomes is potentially problematic.
Machine Learning models use correlations between variables,
and post-hoc XAI methods likewise return the information that
correlated features are important for the prediction. While it is
important to know which variables matter for predictions from
an explainability point of view, the questions we want to answer are not questions that refer to the prediction of a variable but to
real-life relationships; they are not questions on correlation but
on causation.
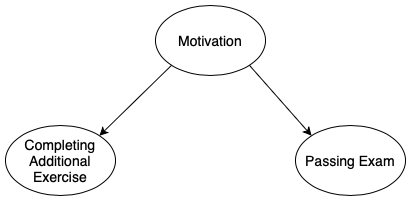
To highlight the distinction, consider the very small example
depicted in Figure 1. It shows the true causal relationships
between three variables. Suppose we want to predict whether a
student will pass an exam. In that case, a Machine Learning
model is likely to use the variable Completing Additional
Exercise as the two variables are correlated due to their mutual
confounder Motivation. An XAI or feature importance method
will, therefore, indicate that this is an important variable for the
prediction, and we might draw the conclusion that we should
recommend the additional exercise to students. From a causal
perspective, this would be poor advice, though, as it would not
help the students to pass the exam because we are not
influencing the real cause, motivation. This example shows that,
to gain valuable and actionable insights, it is important to think
about causality.
Causality can be seen as a relationship between two variables
where one causes the other [7]. We can only then certainly
speak of causality when we actively change the value of one
variable, and this changes the value of another variable [7].
In EDM, we usually have settings with many variables
that are connected to each other in a variety of ways. By
knowing which variables can influence, e.g., learning outcome,
dropping out, or class failure, we can intervene in a way
that leads to a better outcome. But for this, we need to
know about the causal relationships underlying the data
[11].
The causal relationships among variables are often expressed in a Directed Acyclic Graph (DAG) – as is also the case in Figure 1. DAGs are graphs with nodes representing variables and oriented edges representing causal relationships [7]. DAGs are helpful in many ways and on many different levels because they provide us with an understanding of the data-generating mechanisms. Most importantly, and as already stressed, they allow us to gain actionable insights, making it possible for us to intervene [11, 5]. Moreover, DAGs can also inform us on other important aspects:
- We can understand in which way sensitive variables impact the target, which allows us to detect potential fairness problems Machine Learning models trained on observational data may have [3].
- We know which variables to control for if we want to estimate the effects of variables on a target using observational data [10, 6]. If we, for example, want to know the effect of taking a mental health class on well-being, we know what variables we need to control for when estimating the effect.
- We can select only those variables for predictive models that should have a causal influence on the target, therefore, using DAGs for feature selection [12]. This might not only lead to better and more efficient models but also models with influences we know and can explain. This, in turn, leads to better explainability and generates trust.
All of these aspects require us to work with DAGs. To be precise, we need to understand two important points:
- How do we “read” DAGs? Which variables are independent of each other given what other variables? What are confounders and colliders? What do we need to control for if we want to estimate the effect of a certain variable on other variables?
- How can we construct DAGs?
We want to provide a hands-on tutorial on these two points. In our experience, most researchers and students in the EDM community have no or only theoretical knowledge of DAGs and causality. With our tutorial, we aim to make DAGs accessible to the broader research community.
2. TAUGHT TOPICS
Our tutorial is aimed at researchers and PhD students who have
no or only limited theoretical knowledge of causality and
working with DAGs. The tutorial will cover the basics of
causality and include hands-on practical parts that are also
interesting for those who do know something about causality
but have little practical experience with DAGs. It cannot
provide a deep dive into causality but will serve as a hands-on
starting point.
We start with a theoretical introduction to causality, DAGs, and
important concepts regarding this. This will include a
brief recap of conditional independence, an explanation of
confounders, colliders, and d-separation [7].
Afterward, we introduce DAGitty, a tool that allows us to model
DAGs and that helps us in analyzing them. For example,
DAGitty tells the user which variables to control for when we
are interested in estimating the effect one variable has on
another [10].
Finally, we will introduce the R package bnlearn and show how
to learn DAGs from observational data using different structure
learning methods [8]. We will discuss the strengths and
weaknesses of the methods.
Throughout the tutorial, we will continuously work with
the same example setting, showcasing the need for causal
thinking.
2.1 Participants and Materials
The tutorial will be taught in a hybrid setting. To support
online participation, one person from the teaching team will
attend online and will provide technical assistance as well as
manage the break-out rooms there. We can support a maximum
of 25-30 participants in total; the distribution of online and
in-person participation is not fixed.
We require a projector. Ideally, we also have access to a set-up
that makes hybrid participation easier (such as a room
microphone and a room camera). Participants need a computer
and are required to have R and RStudio installed. We will help
with technical problems.
We will provide code in the form of an RScript and a small
dataset to support the practical parts of the tutorial. Ideally, we
have access to some kind of cloud-based system that allows us
to upload the materials and that allows the participants to
download them.
3. TENTATIVE TIMELINE
Currently, our schedule looks like this:
- 9:00-9:45: Theoretical introduction to causality and DAGs. This will be done in the form of a presentation.
- 9:45-10:00: Introduction to DAGitty.
- 10:00-10:20: Break.
- 10:20-11:00: Participants get together in groups of three or four and construct a DAG using DAGitty. A specific setting will be provided to the participants for which they should attempt to both model the DAG and extract specific information. One person will help online and one in person. The online participants will be put in break-out rooms.
- 11:00-11:45: We will theoretically discuss how we can learn DAGs from data using structure learning algorithms. We will highlight strengths and weaknesses of the different approaches.
- 11:45-12:00: Break.
- 12:00-12:30: The participants get together in groups of three or four and receive a dataset (fitting to the setting previously provided) as well as a prepared RScript that uses the R package bnlearn. They can experiment with different structure learning algorithms and settings and compare the results to their modeled DAG in the previous phase. One person will help online and one in person. The online participants will be put in break-out rooms.
- 12:30-12:45: Concluding remarks.
Hence, the tutorial takes about 3 hours and 45 minutes, which includes breaks.
4. BIOGRAPHY
Lea Cohausz is a PhD candidate in computer science at the
University of Mannheim. She has published several papers in
the realm of causal modeling [4, 2, 3]. In the past two editions
of the EDM conference, she received a Best Student Short
Paper award (2022) and a Best Student Full Paper award
(2023). She holds two Master’s degrees, one in Data Science and
one in Sociology. The combination of these two disciplines
allows her to view causal modeling from multiple perspectives.
Additionally, she has experience with teaching Bayesian
Networks and DAGs in a Master level course at the University
of Mannheim.
During the tutorial, Lea will be supported by at least one qualified person from her work group at the University of Mannheim. This person will assist in the online organization and moderation.
5. REFERENCES
- S. Alturki, I. Hulpu, and H. Stuckenschmidt. Predicting academic outcomes: A survey from 2007 till 2018. Technology, Knowledge and Learning, 27(1):275–307, 2022.
- L. Cohausz. Towards real interpretability of student success prediction combining methods of xai and social science. International Educational Data Mining Society, 2022.
- L. Cohausz, J. Kappenberger, and H. Stuckenschmidt. What fairness metrics can really tell you: A case study in the educational domain. 2024.
- L. Cohausz, A. Tschalzev, C. Bartelt, and H. Stuckenschmidt. Investigating the importance of demographic features for edm-predictions. International Educational Data Mining Society, 2023.
- B. Hicks, K. Kitto, L. Payne, and S. Buckingham Shum. Thinking with causal models: A visual formalism for collaboratively crafting assumptions. In LAK22: 12th International Learning Analytics and Knowledge Conference, pages 250–259, 2022.
- H. Kincaid. Mechanisms, causal modeling, and the limitations of traditional multiple regression. The Oxford handbook of philosophy of social science, pages 46–64, 2012.
- J. Pearl. Causality. Cambridge university press, 2009.
- M. Scutari. Package ‘bnlearn’. Bayesian network structure learning, parameter learning and inference, R package version, 4(1), 2019.
- V. Swamy, B. Radmehr, N. Krco, M. Marras, and T. Käser. Evaluating the explainers: black-box explainable machine learning for student success prediction in moocs. arXiv preprint arXiv:2207.00551, 2022.
- J. Textor, J. Hardt, and S. Knüppel. Dagitty: a graphical tool for analyzing causal diagrams. Epidemiology, 22(5):745, 2011.
- J. Weidlich, D. Gaševic, and H. Drachsler. Causal inference and bias in learning analytics: A primer on pitfalls using directed acyclic graphs. Journal of Learning Analytics, 9(3):183–199, 2022.
- K. Yu, X. Guo, L. Liu, J. Li, H. Wang, Z. Ling, and X. Wu. Causality-based feature selection: Methods and evaluations. ACM Computing Surveys (CSUR), 53(5):1–36, 2020.