ABSTRACT
With the support of digital learning platforms, synchronous and collaborative learning has become a prominent learning paradigm in mathematics education. Computer-Supported Collaborative Learning (CSCL) has emerged as a valuable tool for enhancing mathematical discourse, problem solving, and ultimately learning outcomes. This paper presents an innovative examination of Graspable Math (GM), a dynamic mathematic notation and learning online platform, to enable synchronous, collaborative learning between pairs of students. Through analyzing students’ online log data, we adopt a data-driven method to better understand the intricate dynamics of collaborative learning in mathematics as it happens. Specifically, we apply frequency distributions, cluster analysis to present students’ dynamic interaction patterns and identify distinctive profiles of collaboration. Our findings reveal several collaboration profiles that emerge through these analyses. This research not only bridges the gap in current CSCL tools for mathematics, but also provides empirical insights into the effective design and implementation of such tools. The insights gained from this research offer implications for the design of digital learning tools that support effective and engaging collaborative learning experiences.
Keywords
1. INTRODUCTION
Collaborative Learning (CL) is an instructional approach in which a group of students works together to complete a task or solve a problem [27]. Studies have shown that students can benefit greatly from CL opportunities; it helps them improve social and communication skills, positive attitude towards learning, motivation, and academic performance [27, 49]. With the advancement of technologies and increased demand for online learning, CSCL tools play an important role in many different academic subjects [23]. For example, in writing-based subjects, existing collaborative solutions such as Google Docs enable real-time student collaboration; students can synchronously work on the same content or tasks together, communicate with each other, and teachers can immediately access students’ work and provide feedback.
However, there is a lack of similar strong CSCL tools for mathematics learning, especially for algebra. Although a large number of digital math learning applications (e.g., IXL, ASSISTments, DeltaMath, GeoGebra) and whiteboard tools (e.g., MathSpace, FluidityMath) are widely used to improve algebraic learning, few provide opportunities for students to collaborate directly with their peers in real-time. Further, many digital math learning tools overlook the crucial role of mathematical discourse, collaboration, and interactions among learners, as well as with their teachers. Students often engage in a series of mathematical tasks individually, working in isolation from their peers. Consequently, most studies in the field have focused on investigating individual students’ behavioral patterns in math learning tools and their correlation with learning outcomes [52, 29, 42, 24]. Few studies have delved deeper into how a group of students behave or interact with each other during math collaborative learning activities, particularly within math CSCL tools. This calls for further investigation.
A prototype of a collaborative whiteboard specifically designed for mathematics learning, known as Graspable Math (GM) Collaborative Whiteboard, allows students to work on the same math problems or content in real-time and interact with their peers simultaneously on a digital whiteboard. Previous work has explored how students’ different behavioral patterns in a gamified version of GM are related to students’ mathematical knowledge and efficiency. The findings indicated that some in-app behaviors provided meaningful information to students’ algebraic understanding and learning [29, 30]. However, these analyses were limited to individual students’ problem-solving.
In this study, we utilize log data recorded as students collaboratively solve math problems in pairs using GM’s Collaborative Whiteboard and explore different interaction patterns that emerge in these activities. Specifically, we apply novel visualizations and clustering techniques to present students’ interaction patterns to identify distinctive collaboration profiles. Further, we investigate how these visualizations provide meaningful and comprehensive information to support collaborative learning in math. Given this backdrop, our study is guided by the following research questions:
- What are the various frequency patterns of student interactions within collaborative mathematics activities?
- What collaboration profiles emerge among pairs of students in these activities?
- What are the different patterns of actions that students take within the emerging profiles?
2. BACKGROUND
2.1 Collaborative Learning in Education
Collaborative Learning (CL) is a situation in which two or more learners work together to solve a problem and attempt to learn something together [19]. It is drawn from Vygotsky’s zone of proximal development theory, which suggests that cognitive development is shaped by social interaction and collaboration with others [51]. In such a learning paradigm, learners collectively engage in identifying problems, reading instructions, exchanging ideas, building mutual understanding, and jointly developing solutions. In the past decades, CL has benefited learners with different levels of knowledge and experience in different scenarios [26, 39]. For example, [27] summarized Panitz’s work [39] on the benefits of CL and synthesized them into four categories: 1) social benefits, (e.g., building diverse understanding); 2) psychological benefits (e.g., reducing anxiety); 3) academic benefits (e.g., improving learning outcomes); 4) alternating students and teacher assessment techniques. In addition, empirical evidence from recent studies has also supported the benefits of CL activities for students from different age groups, such as improving students’ critical thinking ability [33]; self-efficacy, and social skills [28]; perception of collaboration [47]; learning outcomes [12, 47].
2.2 CSCL Across Disciplines
With the advancement of technology, more research focuses on the effects of learning in CSCL settings [53], where collaborative learning is facilitated through the use of computers and other digital technologies. CSCL may happen in different learning environments, such as face-to-face, synchronous, or asynchronous online education or blended learning settings [15]. As the number of empirical studies around CSCL increased [20, 22, 45], researchers have conducted reviews to understand its overall effect on different domains. For example, a previous meta-analysis found a relatively notable effect size of CSCL in STEM education [25]. Similarly, a positive and moderate effect has been found on academic achievement [48]. Furthermore, in a more recent systematic review, the researcher demonstrated the adaptability of CSCL across academic disciplines. They found that CSCL has a significant impact on subjects ranging from STEM to humanities, particularly improving outcomes in foreign language education [50]. Collectively, these studies support CSCL’s growing adoption and effectiveness across different disciplines with different populations.
2.3 CSCL in Mathematics
A growing number of learning technologies made strides to improve math learning through formative assessment and a focus on encouraging students to articulate their knowledge through open-ended prompts (e.g., ASSISTments) [7, 8, 11]. Few opportunities, however, are provided for students to learn math in collaboration with their peers. Literature in math education points to the importance of allowing students to engage in a rich conversation on math [44]. When students work in pairs or groups, they learn to not only explain their conceptual understanding but also e to disentangle the discrepancies underlying each other’s structure of knowledge. Studies have also shown that students learn math better when they verbalize their mathematical knowledge [37, 40]. Moreover, collaborating with peers to solve a math problem together also helps students engage more actively with their learning [32]. In recent years, a growing body of work leveraged the use of classroom technologies (i.e., handheld dashboard) to promote collaboration among students and support teachers’ real-time orchestration [34]. However, it remains largely unclear as to what ways the content of speech and patterns of collocated collaboration jointly characterize quality learning experience in math. Hence, it is necessary to conduct research in order to enhance the comprehension of mathematical communication among students as they engage in collaborative tasks. To design a successful collaborative learning experience in math, it is critical to coordinate with students and teachers.
2.4 Behavior Profiles from Clickstream Data
In synchronous online learning landscapes, the clickstream data left by learners encapsulate a wealth of information pivotal for deciphering and profiling learner behaviors. The analysis of such data is increasingly recognized for its capacity to shed light on user engagement and interaction patterns within digital learning platforms [3]. The classification of these intricate digital footprints enables the construction of detailed learner profiles, critical for tailoring educational experiences and enhancing learning outcomes [6].
Prior work by Amnueypornsakul et al. [4] utilized clickstream data to forecast student attrition, offering educators a valuable tool for identifying and assisting at-risk students. In a similar vein, the application of generative adversarial networks (GANs) by Cao et al. [13] highlights the potential of advanced machine learning techniques to extract significant patterns from complex behavioral data, enriching the granularity of learner engagement analysis. The endeavor by Belarbi et al. [9] to create structured user profiles from video clickstream analysis in online courses demonstrates the power of Bayesian methods and K-Means clustering. This methodology effectively identifies distinct learner personas based on their interaction with video content, showcasing the versatility of clustering algorithms in educational data analysis. Furthermore, the adoption of a dynamical systems perspective by Poquet et al. [41] reveals the fluid nature of learner behaviors. Their research, utilizing entropy measures in behavior recurrence, uncovers profiles of change in student study habits, providing insights into the dynamic engagement of learners and the efficacy of interventions.
This subsection seeks to bridge the existing gap in the literature by concentrating on the delineation of learner profiles through the analysis of clickstream-level data in collaborative learning settings. By harnessing sophisticated data analytics, this study aims to unravel the latent structures within learner interactions, offering a detailed perspective on the digital learning journey. The findings from this analysis are expected to inform the development and implementation of future digital learning tools, ultimately enhancing the personalization and effectiveness of online education.
3. CONTEXT: GRASPABLE MATH (GM)
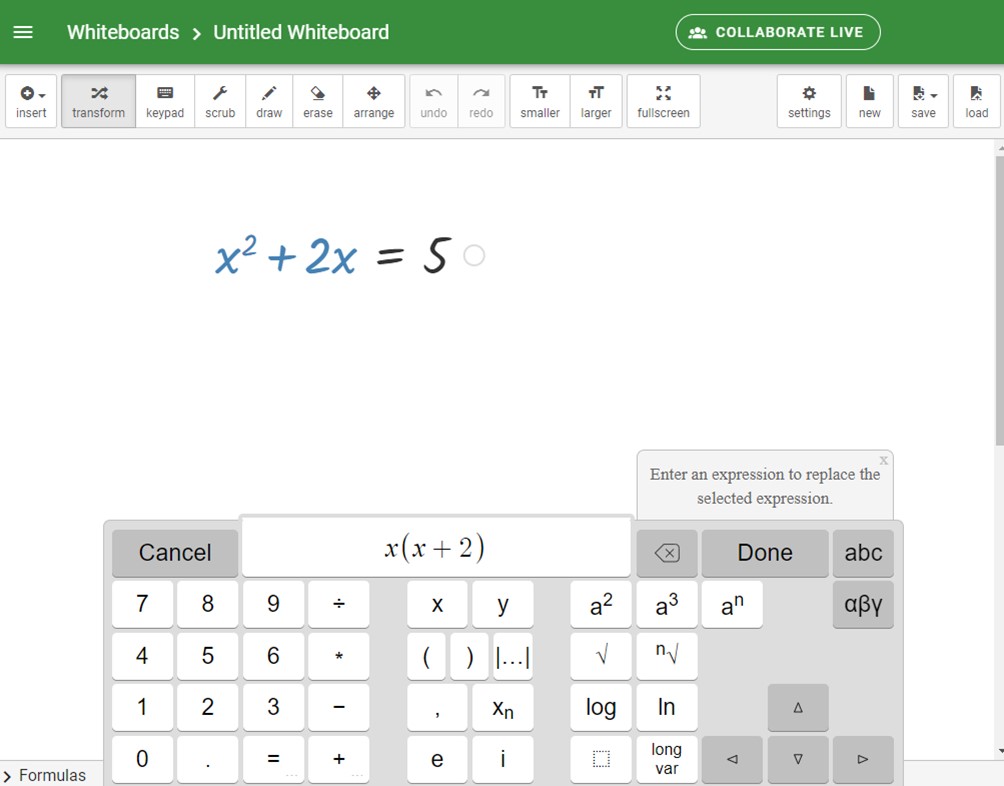
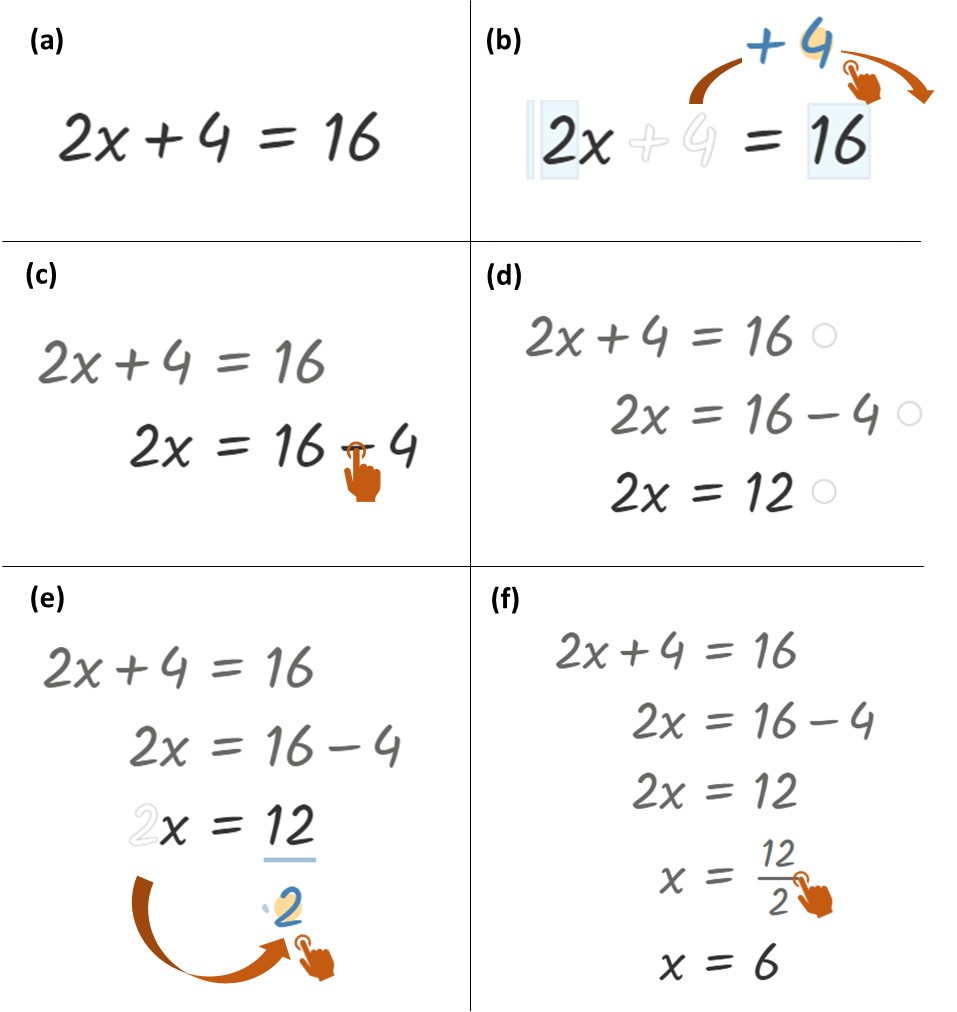
Graspable Math1 (GM; Figure 1a) is a dynamic mathematics notation tool that was developed based on theories of perceptual learning and embodied cognition to support students’ mathematics learning [38]. GM treats mathematical symbols as tactile objects, which allows students to physically interact with numbers and symbols on a digital whiteboard and manipulate them via touch or mouse-based gestures (Figure 1b). By treating mathematical notations like objects on a screen, students can solve mathematical problems (e.g., 2x+4=16 in Figure 1b-a) by moving symbols to transform expressions or equations, resulting in tangible learning experiences (Figure 1b-b through f).
GM also provides a fluid visualization that allows students to see the entire transformation process of algebraic expressions to solve a problem. The fluid visualizations of the problem-solving process can help reduce students’ cognitive loads and direct students’ attention to the structure of algebraic notations, which, in turn, shifts their focus to the problem-solving process as a whole. In this way, students can quickly identify algebraic structures, think more flexibly, and realize that mathematical transformations are more dynamic than a static re-copying of lines. The positive effects of GM on student mathematics learning have been established in several empirical studies (e.g., [14]), most notably in a randomized control trial with 1,850 7th grade students [18]. The study found that the students in a gamified version of the GM condition significantly outperformed their counterparts in the traditional online math learning platform.
GM recently released a prototype of a collaborative whiteboard that operates with a standalone link and can be integrated into a classroom-based real-time teacher dashboard. In particular, the collaborative whiteboard in GM provides functionality for assigning students into small groups and allows students to work on the same math problems or content and interact with their peers simultaneously, like Google Docs. In addition, it provides a teacher-facing dashboard that allows teachers to review student work and provide real-time feedback. Our current work focuses on examining student collaboration patterns that emerged from student interactions with collaborative whiteboards in GM.
4. DATASET
The dataset underpinning our analysis originates from the GM, which records detailed log data of student interactions during mathematical problem solving activities. Each student action within the platform generates a discrete data point that encapsulates the specifics of their engagement with the digital whiteboard environment. To uphold privacy standards and ethical considerations, all data have undergone rigorous anonymization processes, ensuring the confidentiality of participant identities. The dataset is derived from GM’s typical user base, which primarily consists of middle and high school students and their teachers, along with a smaller number of elementary and post-secondary students. The user base is international in nature, with approximately half of the users residing in the United States, while the majority of the remaining users are from South America and Europe.
The GM data set is characterized by its granular detail, which captures a myriad of student actions within the collaborative whiteboard space. Each record within the dataset is structured as a nested JSON object, reflecting the complexity and depth of student interactions. These records contain comprehensive details about each action, including, the spatial coordinates, the nature of the action (e.g., creation of mathematical expressions), and the sequential index of the action, providing insights into the temporal order of events. A key feature of the dataset is the representation of collaborative activities, where each whiteboard session can involve one or more students. The data set meticulously records the collaborative dynamics, each action tagged with individual student identifiers within a shared whiteboard session. This allows the reconstruction of collaborative problem-solving processes, offering a lens into the interactive patterns that emerge when students engage in mathematics collaboratively.
The dataset comprises a total of 448,025 entries, with data collection ending on September 27, 2023. This extensive collection encapsulates real-world usage scenarios of the GM, providing a rich foundation for our exploratory data analysis. The breadth and depth of the dataset enable a comprehensive examination of student behaviors, interaction styles, and collaborative problem solving strategies within the context of digital math learning environments. For the benefit of the broader research community, our team has committed to transparency and accessibility by providing the analytical code2 associated with this study on the Open Science Framework (OSF). Although direct access to the dataset is not provided to safeguard participant privacy, interested researchers may request access through our OSF page.
5. METHODS
5.1 Analysis 1: Normalized Time Distribution Visualization Analysis
Our research initiated an extensive overview and analytical examination of students’ engagement in the GM’s whiteboard environment, and our focus on pairwise student collaboration in light of our research questions led us to scrutinize the 237,945 data points in the relevant full dataset, which contains only cases where there are two students in a whiteboard. Specifically, we focus on the distribution and participation trends on 504 different whiteboards that involve 736 students. Furthermore, we analyzed the students’ time spent on whiteboards, dividing the data into time segments from 0.0 to 23.5 hours and conducting a detailed statistical breakdown for each segment. This fine-grained analysis revealed distinct usage patterns across various timeframes. In the next step, we focused on one-hour interactions, analyzing a subset of 70,517 data points. This decision was driven by our anticipation that collaborative mathematics activities would primarily involve pairs of students working together for relatively short periods. By concentrating on interactions lasting up to one hour, we were able to align our main research dataset with the typical context of collaborative problem-solving in classroom settings. This detailed segment, which encompassed 368 unique whiteboards and 606 students, allowed for an in-depth analysis of short-term participation and its potential impact on learning behaviors. Subsequently, we applied Dynamic Time Warping (DTW) analysis to investigate the temporal interaction patterns of students on the whiteboards. DTW is a statistical technique that aligns sequences in time, allowing for the measurement of their similarity even when they vary in speed, making it particularly useful for analyzing temporal patterns in educational data [10]. We analyze instances within one-hour periods, using 5-minute intervals to discern potential behavioral patterns.
We have made some modifications and enhancements to the existing methods that utilize DTW for monitoring temporal changes. These adjustments are specifically designed to cater to the unique characteristics of collaborative learning among paired students in CSCL environments. To simplify matters, we refer to this as “Normalized Time Distribution Visualization” (NTDV). Our solution involves standardizing the duration of whiteboard sessions to a consistent x-axis length and dividing this standardized timeline into 12 equal segments. Unlike conventional approaches that treat time segments uniformly, NTDV adjusts the duration of each segment proportionally to the total session length, ensuring a uniform distribution across the standardized timeline. The practice of normalizing and segmenting time series data for analysis is widely employed in various fields [5, 1]. To facilitate comprehension and comparison across different session lengths, we transformed raw activity counts into a more accessible format within each segment. By visualizing the distribution and frequency of student interactions within these standardized temporal segments, we were able to discern patterns of engagement, turn-taking, and collaboration intensity, shedding light on the collaborative strategies employed by students. This innovative approach not only enhanced our understanding of student dynamics on the GM platform but also provided a scalable framework for analyzing collaborative learning activities in digital environments.
5.2 Analysis 2: Cluster analysis and Collaborative patterns
In Analysis 2, we started by combining actions for each student across 12 predefined time intervals to capture the distribution of activities during a session. Using the tsfresh Python package, we extracted a wide range of features (more than 785) from these time intervals, including various statistical properties and characteristics of the time-series data. This comprehensive set of features aimed to capture the diverse nature of student interactions in the collaborative environment. Since the feature space was high-dimensional, we used Principal Component Analysis (PCA) to reduce the complexity while preserving 75% of the variance in the data. This dimensionality reduction resulted in a more manageable set of 20 features that still captured the essential information and dynamics of the original dataset. These condensed features formed the basis for our subsequent analysis of the K-means cluster. We explored different cluster configurations, starting with k = 3 and increasing to assess the coherence and distinctiveness of the resulting clusters. This iterative process was guided by an examination of cluster centroids and the distribution of data points around them. To visualize the collaborative patterns emerging from these clusters, we selected whiteboards that were proximal to the cluster centroids and constructed a frequency plot. These visualizations facilitated a granular examination of the collaborative dynamics, highlighting the temporal sequencing and overlap of actions between students.
Continuing from the initial exploration of individual-level clustering, we recognized the need to understand the collaborative behaviors manifesting on each whiteboard more holistically. To encapsulate the interactions between pairs of students within the same collaborative whiteboard, we transitioned our analysis to a whiteboard-level perspective. This approach aggregates the actions of two students on a collaborative whiteboard, linking the behaviors of the pair of collaborating students. It constructs a 24-feature vector comprised of the combined number of actions of each student in 12 equal-duration time windows on the whiteboard. This whiteboard-level clustering aimed to capture the collective behavior of student pairs, offering insights into how dyads synergize and coalesce their efforts toward problem solving. To enhance the granularity of our analysis, we incorporated additional features that accounted for peak and off-peak activity periods, as well as direct interactions, where students concurrently engaged with the same object within the digital environment. These refinements aimed to capture the ebb and flow of collaborative intensity and the focal points of joint attention, which are essential in understanding the dynamics of real-time collaboration.
Given the significant variance in the duration of the collaborative whiteboard, it became imperative to discern how collaborative patterns varied between different session lengths. To address this, we segmented our dataset into four distinct groups based on the duration of whiteboard usage: under 5 minutes, between 5 and 10 minutes, between 10 and 20 minutes, and over 20 minutes. This categorization allowed us to tailor our analysis to the unique dynamics and potential constraints presented by each time frame. Within each duration-based group, we applied K-means clustering, leveraging the composite 24-feature vectors that represented the concatenated actions of both students on a whiteboard. This method was designed to uncover different clusters of collaborative behavior that were characteristic of each duration group. The choice of the number of clusters (k) for each group was informed by methods such as the arrow method, ensuring that the selected k-value struck a balance between cluster coherence and the granularity of the segmentation. To elucidate the characteristics of each cluster, we employed 95% confidence interval plots to examine variations in action frequencies between pairs of students in different clusters. This statistical visualization provided insight into the prevailing collaborative patterns within each group, shedding light on how the frequency and types of actions varied between distinct collaborative modalities.
6. RESULTS
6.1 Analysis 1: Student Interaction Dynamics
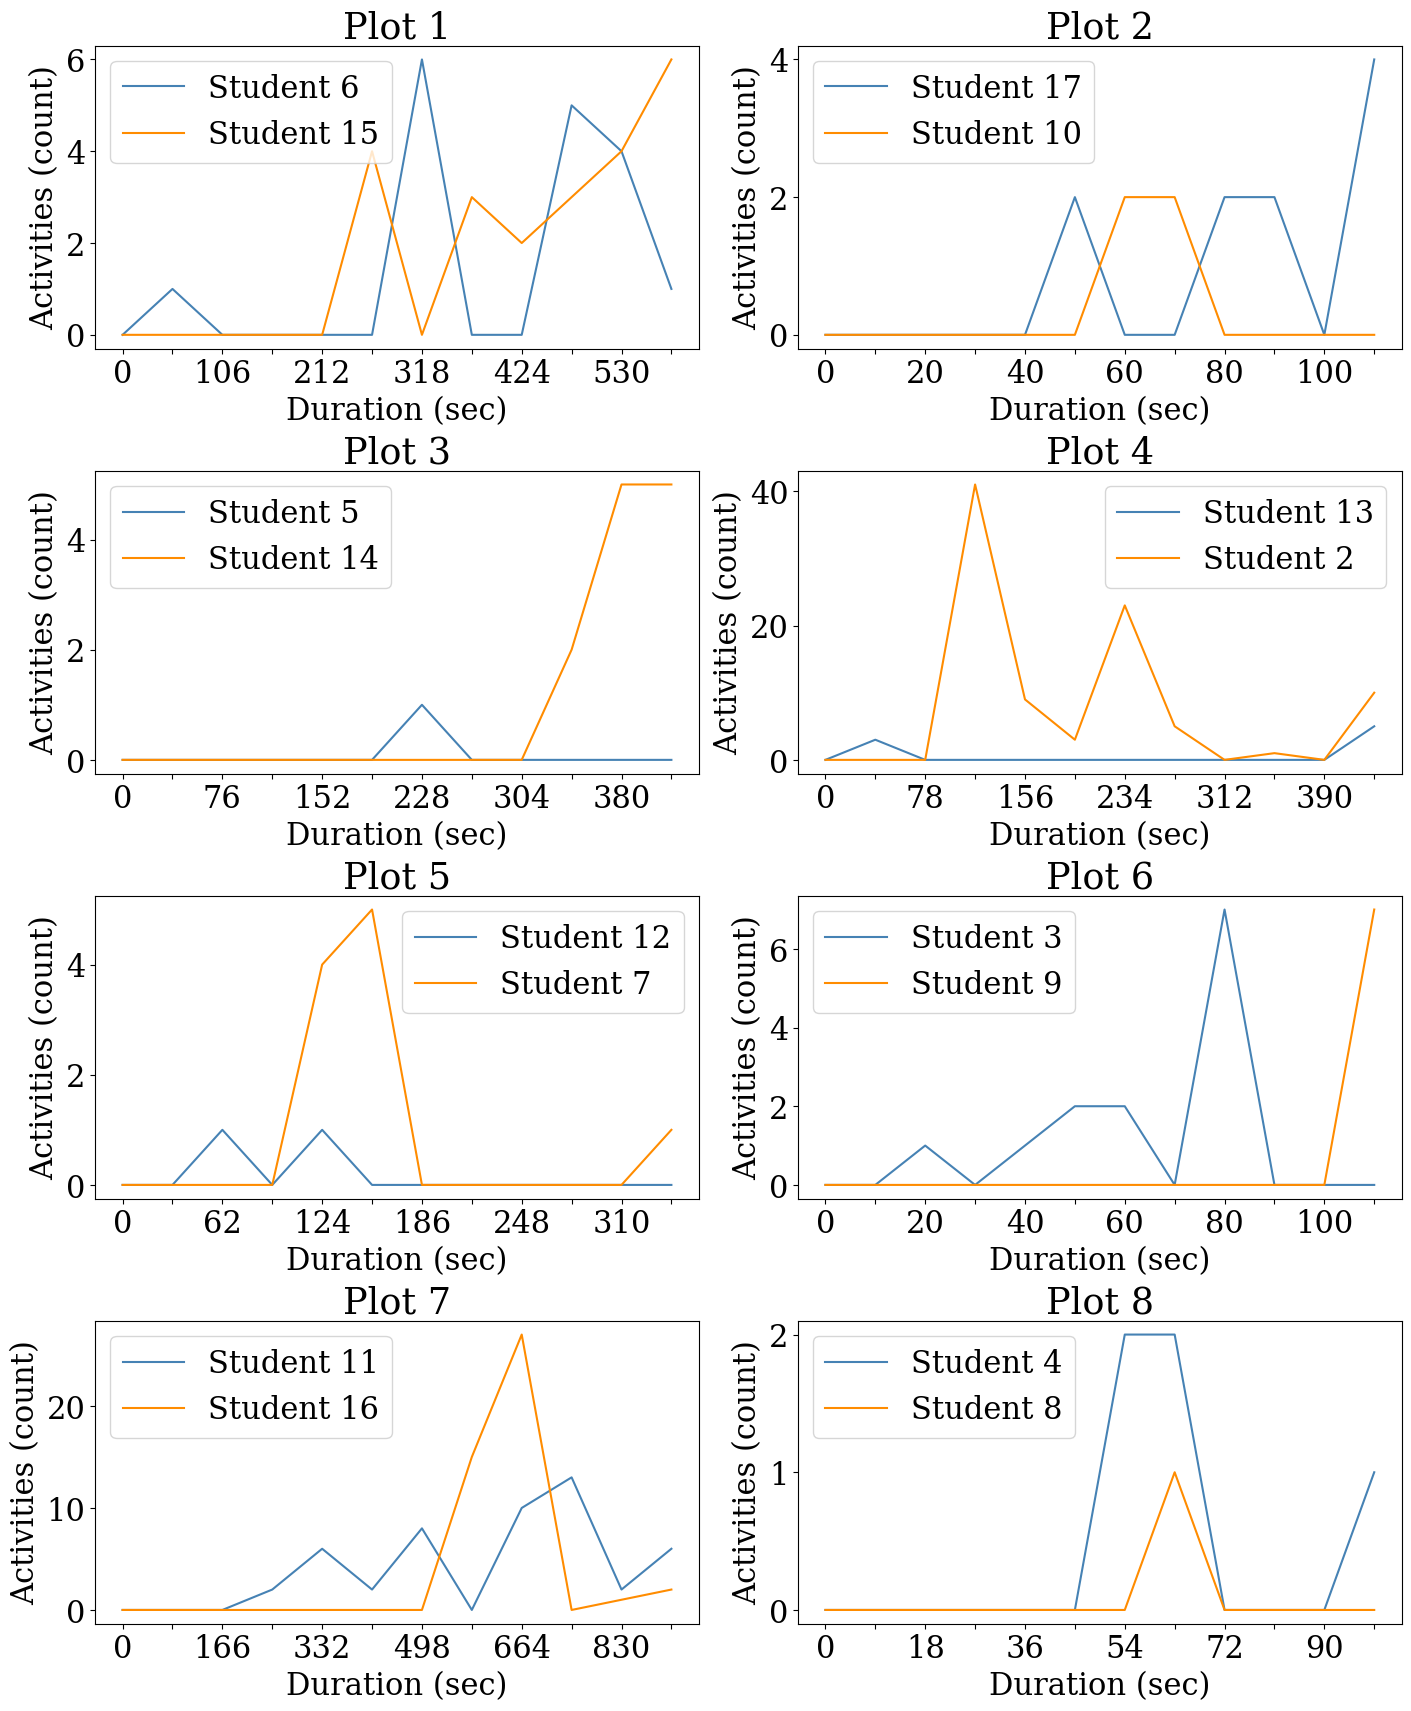
We used NTDV to display the frequency of student actions. This approach overcame the limitations of the original DTW method, such as the short duration of whiteboard sessions and the uneven distribution of student actions, which previously resulted in sparse data. Meanwhile, NTDV provided a clearer representation of student engagement over time. We utilized this method to generate random images consisting of 16 plots, to observe the changes in frequency of paired students’ actions on the same whiteboard. Figure 2 is based on the frequency distribution of student activities within different time windows. By visualizing the data on a dynamic axis, we were able to examine the levels of participation of students on each whiteboard and analyze the collaborative patterns that emerged during their interaction within the GM. In Figure 2, we used two parts, (a) and (b), to present the information more clearly and to indicate specific plots. These labels are solely for the purpose of identification and do not imply any division into separate categories.
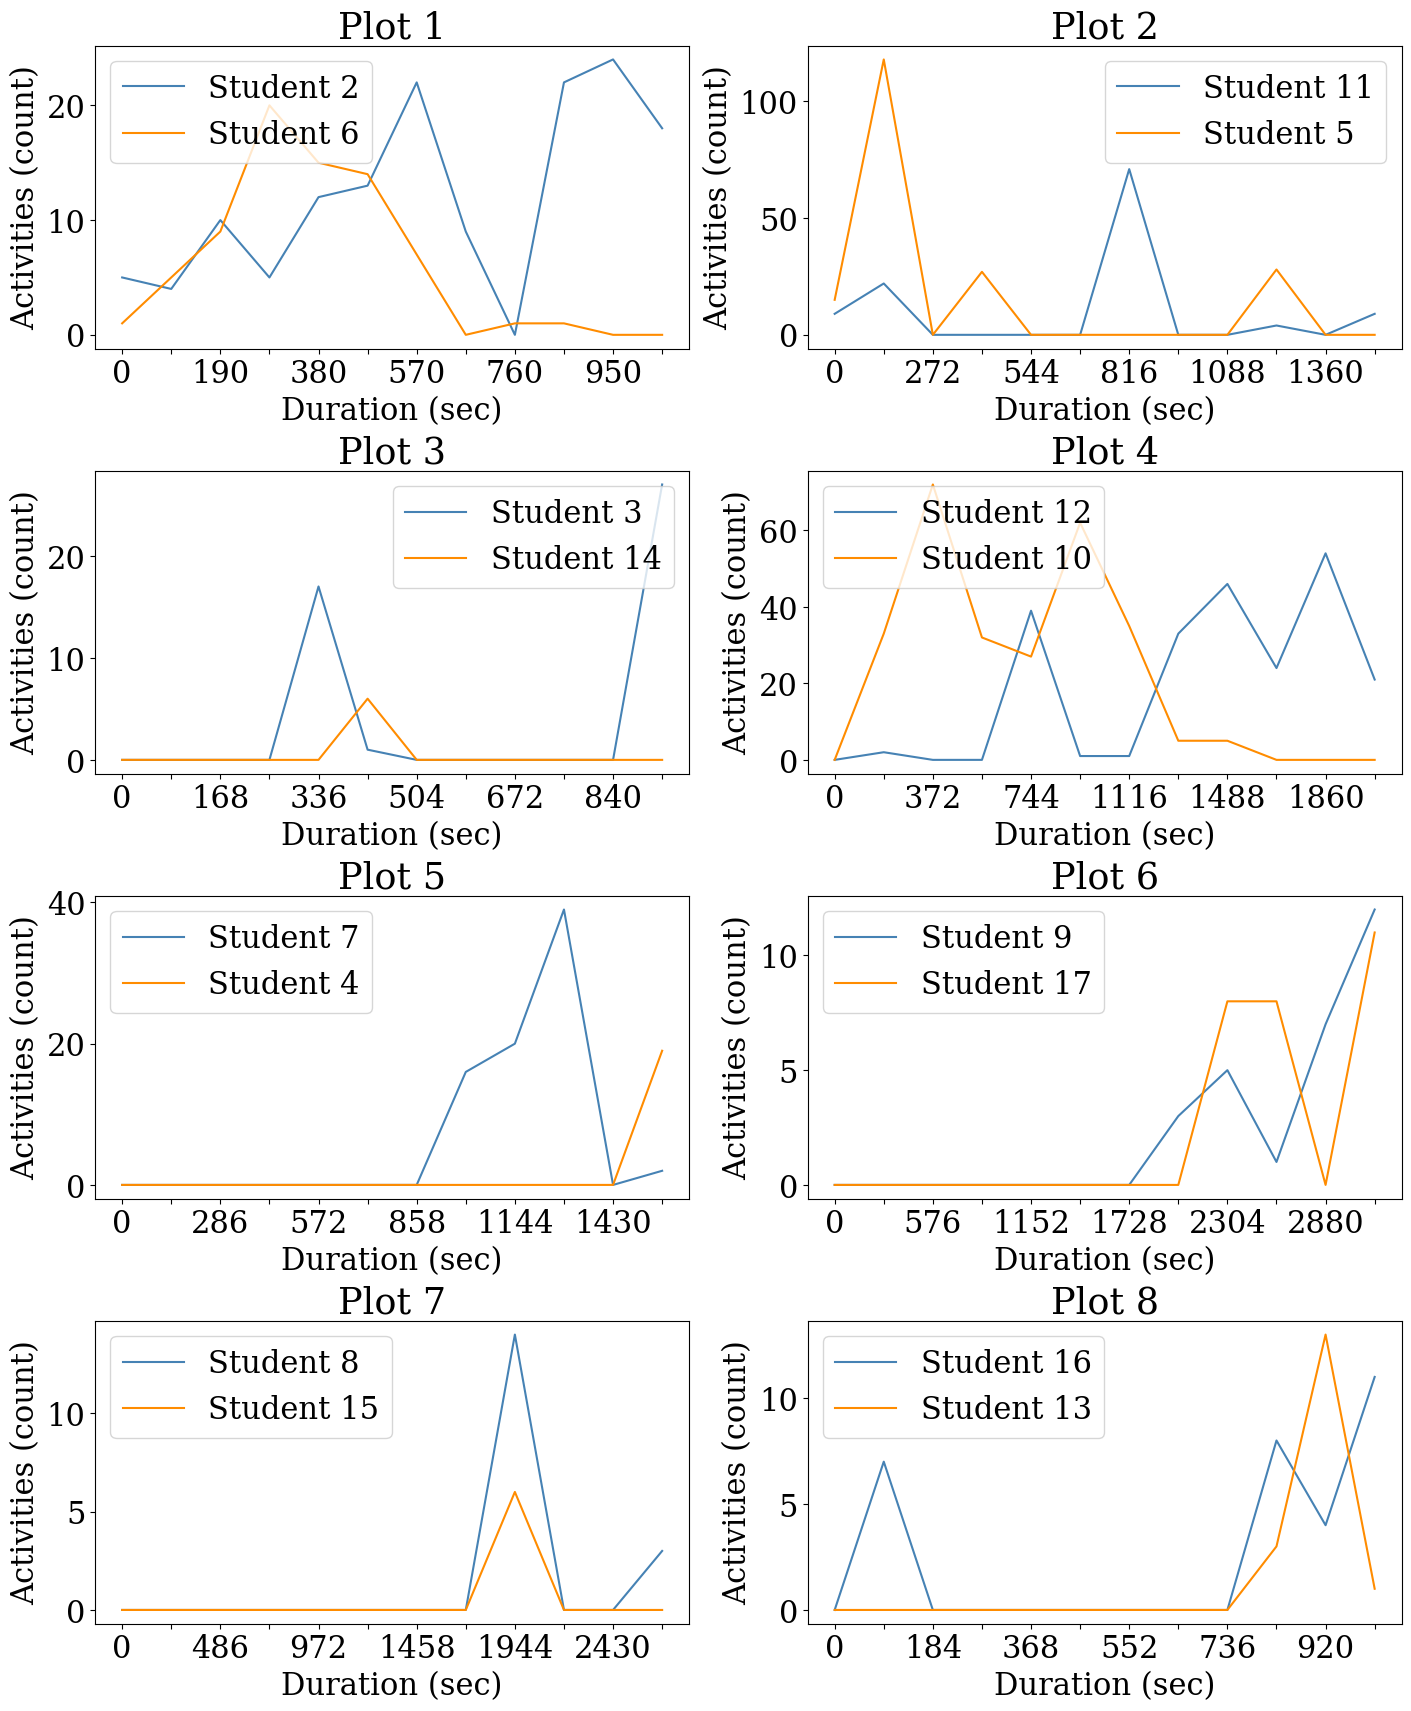
Several notable trends emerged from the frequency graphs derived from our dataset. Specifically, student activity levels varied significantly across the whiteboard sessions, with some pairs of students demonstrating high levels of engagement throughout their session while others showed sporadic bursts of activity. For example, in the whiteboards of Figure 2 (b) examined, Student 2 and Student 6 displayed complementary activity patterns, with one student’s activity peaking when the other’s dipped, suggesting a possible turn-taking approach to collaboration. On another whiteboard shown in Figure 2(b) Plot 2, Student 11 and Student 5 exhibited contrasting behaviors, where one student’s activities were densely clustered at specific time intervals, possibly indicating focused periods of problem-solving or discussion.
Some students maintained a steady pace of interaction throughout their session, as seen in the activity lines of Students 12 and 10 in Figure 2(b) Plot 4, which could imply a consistent and sustained collaborative effort. Conversely, the interaction patterns of Students 8 and 15 in Figure 2(b) Plot 7 were characterized by sharp peaks and troughs, hinting at intermittent collaboration or independent work followed by joint discussions.
The frequency graphs also allowed for the identification of dominant and passive roles within the student pairs. For example, in Figure 2(a) Plot 4, Student 13’s consistently high activity across the session, as opposed to Student 2’s sporadic contributions, might indicate a more dominant role in driving the collaborative effort.
6.2 Analysis 2: Collaboration Profiles
As initially described in our methods section about Analysis 2, we embarked on a detailed examination of both individual-level and whiteboard-level data through k-means clustering analysis. To this end, we identified points closest to the cluster centroids and employed the NTDV method to depict the frequency of paired student actions on each whiteboard. However, the potential influence of noise in the data presented challenges in deriving meaningful insights from the clusters at an individual and whiteboard level. This limitation highlighted the need for more data and further investigation in this direction, which could potentially address these challenges in future research endeavors. As a result, we shifted our focus to a segmented analysis based on the duration of whiteboard sessions, categorizing them into four distinct groups. This segmentation allowed us to perform k-means clustering within each group, aiming to uncover more discernible and meaningful patterns of collaboration.
Table 1 provides a summary of the clustering of k-means in different duration groups to contextualize the distribution of the clusters. In particular, each duration group displayed noise in the form of clusters with minimal member counts. Therefore, for a more representative analysis, we focused on clusters with an \( n \geq 10 \).
|
Duration Group |
Values of k | Cluster Sizes (n)
| ||||||
|---|---|---|---|---|---|---|---|---|
| 0 | 1 | 2 | 3 | 4 | 5 | 6 | ||
| Under 5-Min | 6 | 58 | 1 | 2 | 1 | 4 | 16 | N/A |
| Between 5 and 10 Min | 7 | 36 | 1 | 1 | 6 | 10 | 1 | 4 |
| Between 10 and 20 Min | 7 | 79 | 3 | 2 | 4 | 1 | 1 | 11 |
| Over 20 Min | 4 | 13 | 1 | 8 | 81 | N/A | N/A | N/A |
For each duration of the session, two main groups were determined and the patterns of their collaborative interactions were clarified using Confidence Interval (CI) plots as shown below in Figure 3.
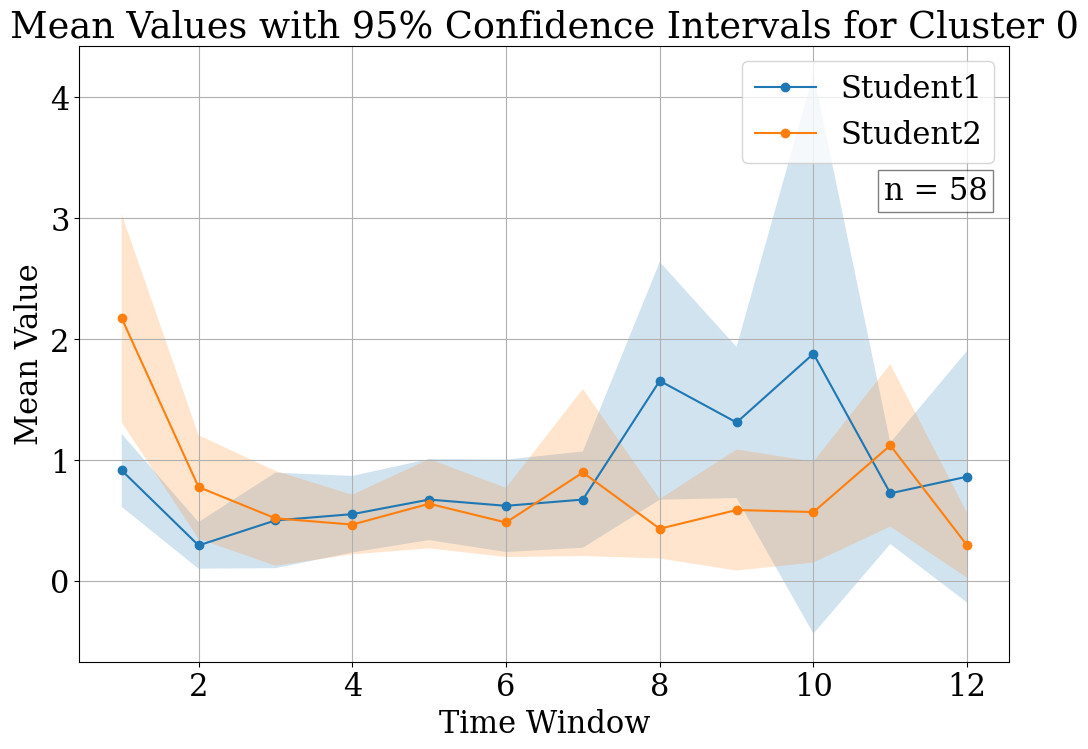
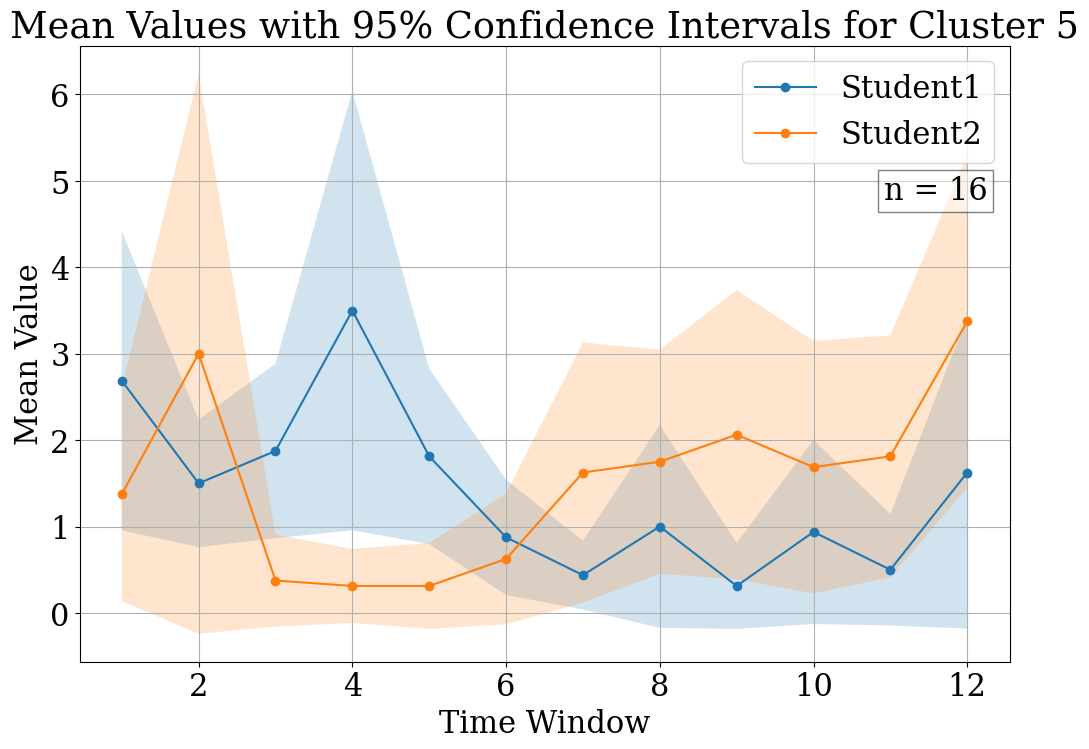
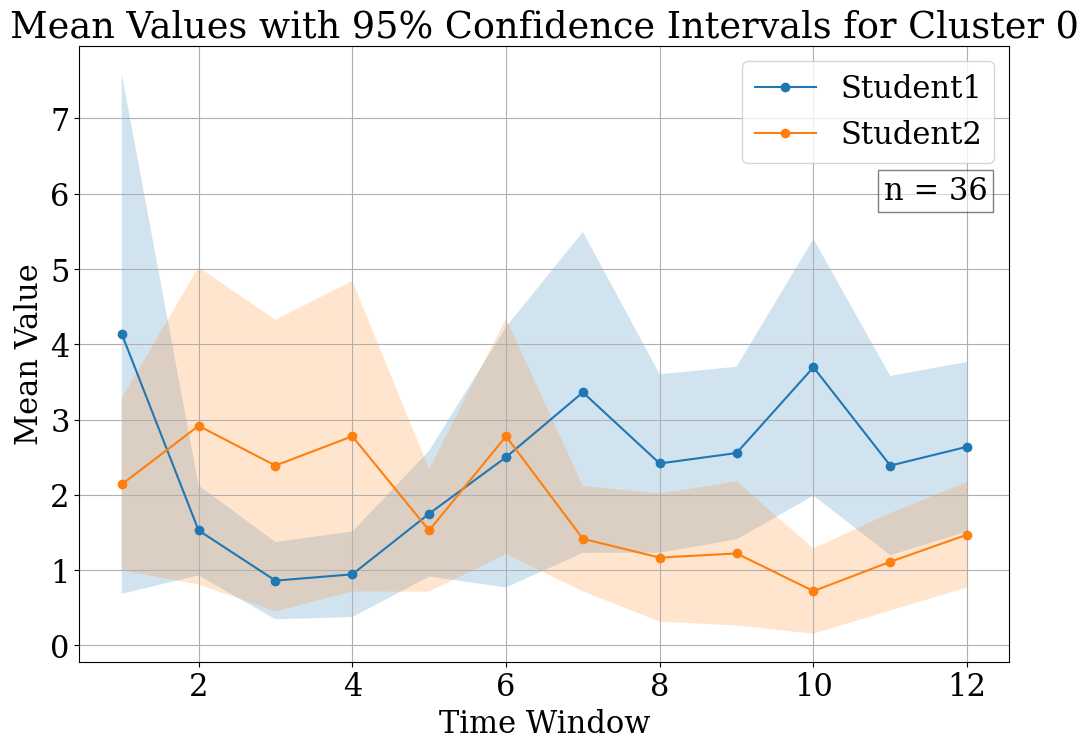
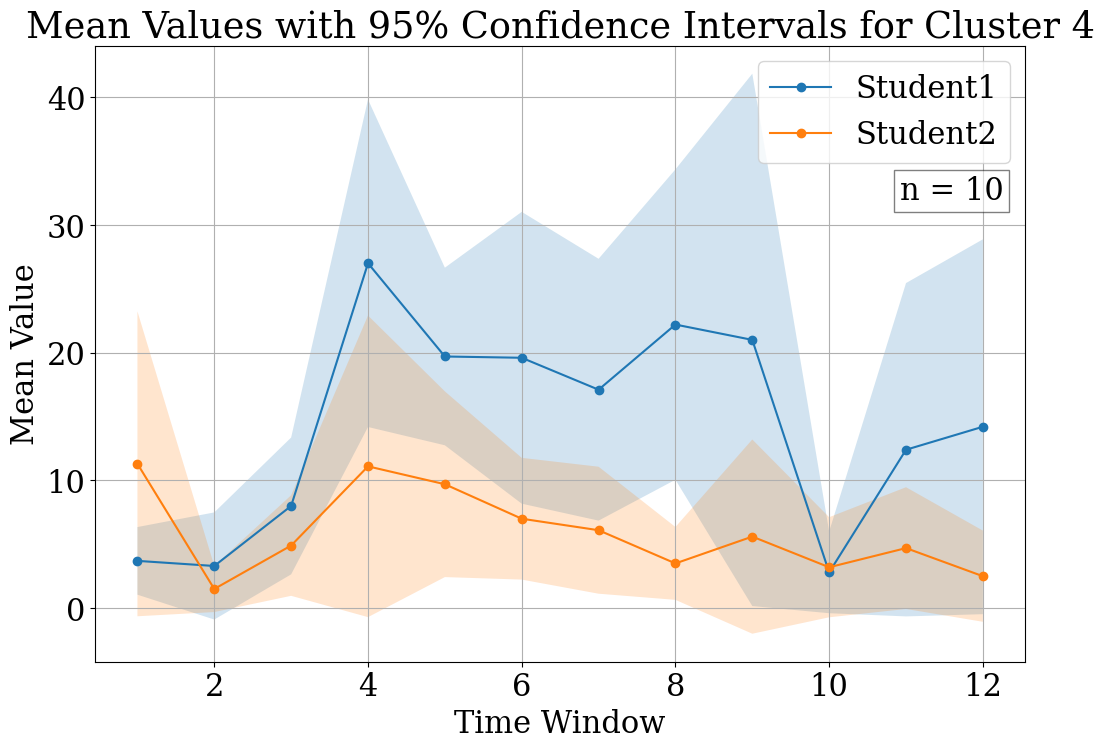
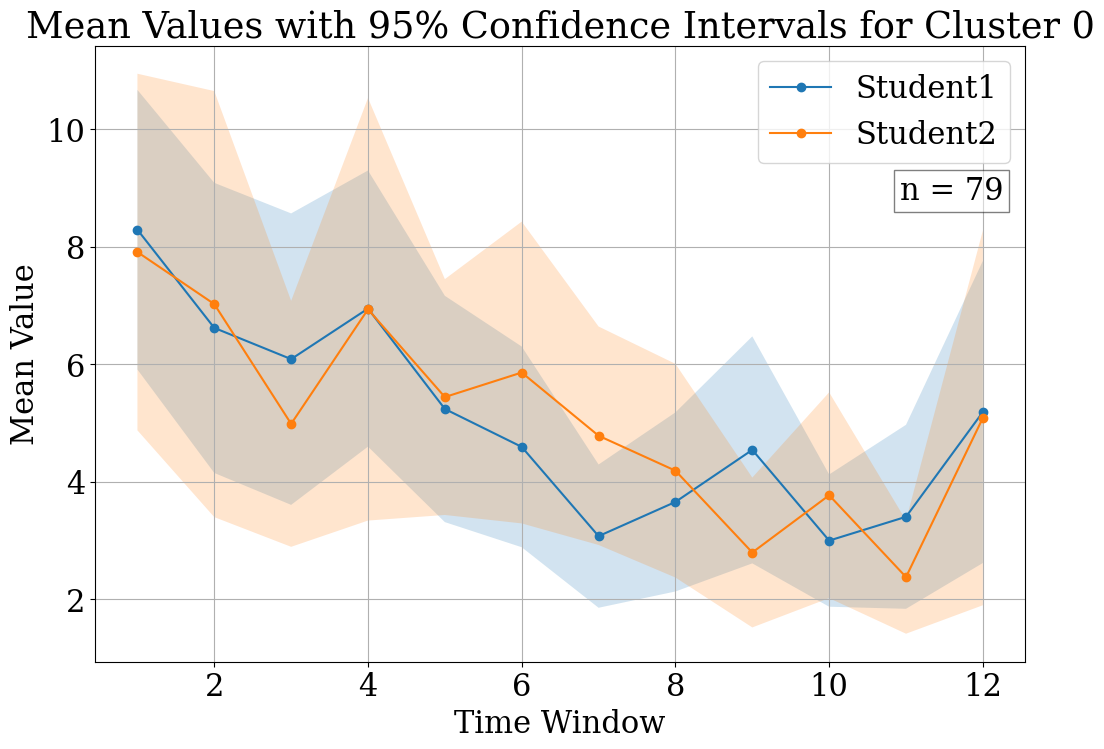

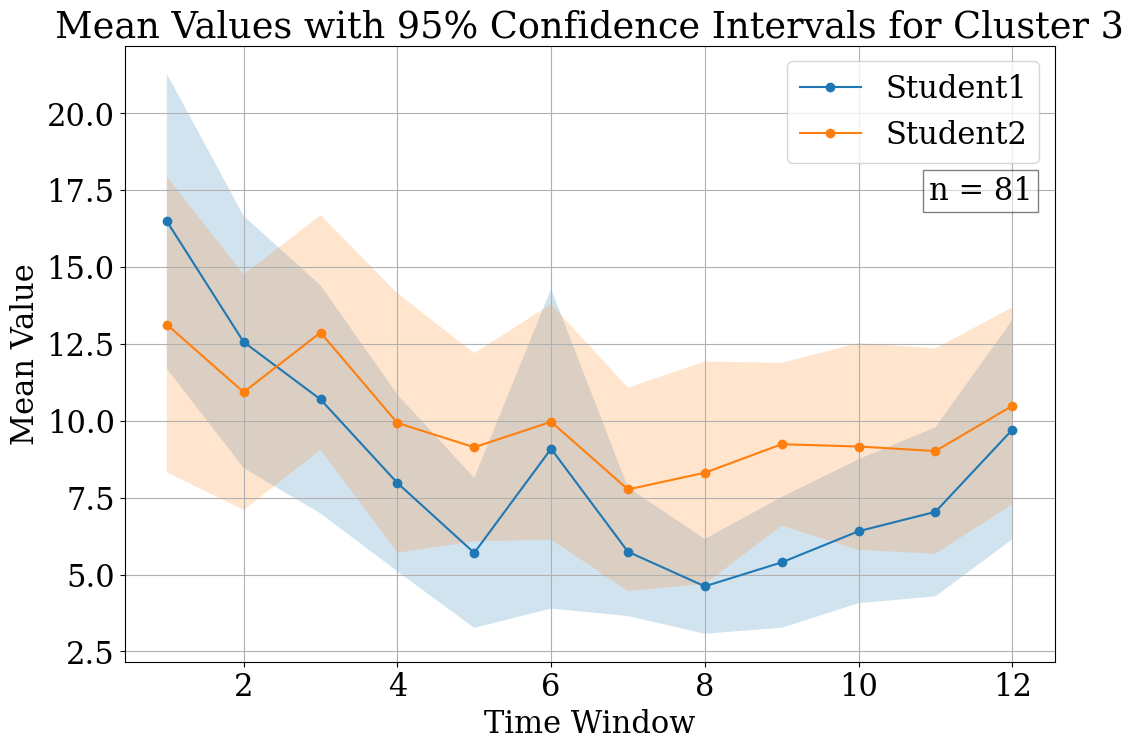
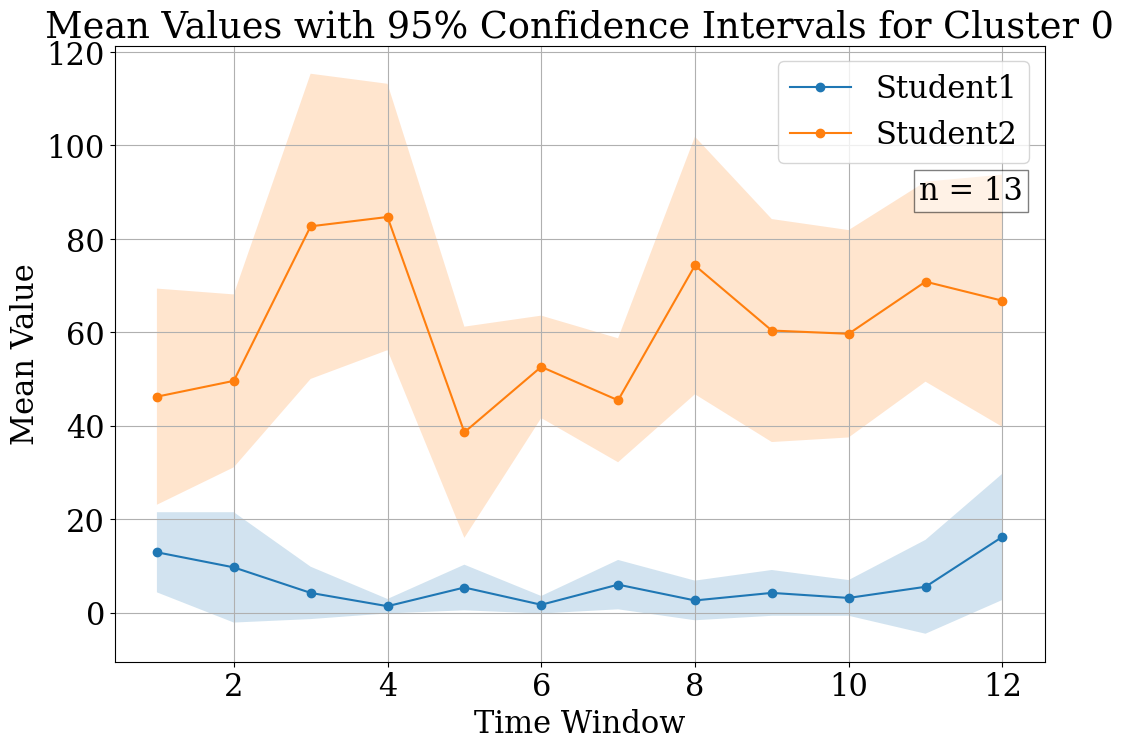
In the first duration group, Figure 3(a) represents the first cluster, revealing a delayed peak in student activity, indicating a gradual build-up to collaboration. Conversely, Figure 3(b) illustrates an early peak, suggesting a swift engagement from the outset. For the second duration group depict an interaction crossover between students and a dominance by Student1, respectively. In Figure 3(c), Student1 starts with less activity, which increases over time, while Student2’s activity decreases, hinting at a collaborative mode where roles evolve throughout the session. Figure 3(d) shows Student1’s clear predominance in activity levels, suggesting a leading role in the collaborative process. The third group’s cluster plots present contrasting interaction patterns. Figure 3(e) shows closely aligned CI between students, implying synchronous collaboration. In contrast, Figure 3(f) shows a distinct separation between the students’ CI, with Student1 taking a less active role, suggesting an asymmetric collaborative dynamic in which one student predominantly leads the interaction. Finally, in the fourth duration group, Figures 3(g) and 3(h) also reflect divergent collaborative patterns. Figure 3(g) mirrors the third group’s first cluster with overlapping CI, while Figure 3(h) displays no overlap, indicating a more independent work dynamic, with Student1 engaging significantly less than Student2.
These visualizations for the most representative clusters underscore the variability of real-time collaboration on the GM. The data suggest different collaborative models: some hinting at balanced interactions, others at dynamic role shifts, and some at a more leader-follower dynamic.
7. DISCUSSION
This study aims to explore and understand the intricate dynamics of collaborative learning within a math CSCL tool by analyzing students’ log data. We first identify different collaborative patterns by observing the frequency of actions of students within GM. We then build learners’ collaborative profiles using clustering techniques. Leveraging a series of data analytics techniques, our study provides a nuanced understanding of how students engage with each other and with mathematical content in CSCL.
Having outlined the key aspects of our collaborative learning analysis, we now delve into the findings at each step. The variability in student interaction dynamics suggests that collaborative learning in digital environments is not monolithic but rather characterized by a diverse array of engagement strategies. This diversity, which encompasses everything from synchronized turn-taking to independent parallel processing, underscores the need for CSCL tools to offer flexible and adaptable interfaces that cater to varying pedagogical needs and learning styles. For example, the observed complementary and divergent interaction rhythms could inform the development of features within GM that dynamically adjust to facilitate or moderate student interactions based on emerging collaborative patterns. This finding is particularly important considering that previous research often lacked a comprehensive understanding of these dynamic interaction patterns, focusing on more static models of collaborative learning [36, 2, 35, 31, 46]. Our research addresses this gap by providing multifaceted and dynamic collaboration patterns among students in digital environments, showcasing a spectrum from highly synchronized activities to distinct, independent task engagements.
Cluster analysis revealed distinct patterns in the increasing duration of collaborative learning for different pairs of students. Specifically, we segment collaborative whiteboard sessions into four groups based on their duration to explore how the length of collaboration affects the dynamics of student interaction. Our findings from the cluster analysis revealed two distinct patterns of collaboration. Intriguingly, as the duration of collaboration extended, the contrast between these two patterns within each group became more stark, one pattern showed the continuous close interaction between two students, whereas the other pattern increasingly exhibited a scenario where one student takes the leadership role. This approach not only highlights the nuanced nature of student collaborations but also addresses gaps in previous research, which often focused on individual learning behaviors or lacked the granularity to capture the fluidity of real-time student collaborative interactions. For example, some recent studies have utilized clustering to reveal individual student learning patterns through the analysis of log data on different topics [29, 16, 21, 17, 6]. Furthermore, techniques such as cluster analysis and decision tree model have proven effective in discovering hidden patterns within educational data [43]. None of these studies used clustering analysis to examine students’ interactions in the collaborative learning environment.
8. LIMITATIONS AND FUTURE WORK
This exploratory study has some limitations. Firstly, it relies solely on log data. While it provides rich interaction among students in detail, it may not capture the full spectrum of collaborative dynamics. Moreover, the findings are descriptive rather than causal, only offering insights into patterns of collaboration without delving into the underlying mechanisms or the impact on learning outcomes. Recognizing these limitations, we aim to expand our current work to include other data sources and consider contextual information to promote a nuanced understanding of students’ collaboration. Specifically, we plan to recruit teachers and students to participate in structured experiments that provide collaborative whiteboards for paired student activities and incorporate multimodal data to capture the richness of students’ collaborative activities. The inclusion of multimodal data will enable us to analyze not just the what of student actions but also the how and why of their collaborative strategies, providing a more holistic view of the cognitive and social processes in CSCL.
9. CONTRIBUTIONS
This study explored ways we can understand students’ real-time collaboration within the context of GM. Our work identified intricate patterns of interaction and distinctive collaboration profiles based on different types of student engagement and problem-solving approaches. Using novel methods such as NTDV allowed us to assess the granular levels of student-level interaction across different time intervals with enhanced precision, revealing complex patterns of engagement that traditional methods may overlook. Coupled with more traditional methods, our work provides a comprehensive view of students’ diverse strategies and contributes to a nuanced understanding of collaborative behaviors in a CSCL environment.
Despite the in-the-wild nature of the study, our work has significant potential to inform different stakeholders on the design of new interventions through a real-time analysis of student collaboration. For educators, the different profiles of collaboration present an opportunity to employ targeted strategies and provide effective feedback that aligns with the specific needs of each collaborative profile. These patterns can also inform researchers and developers with the development of algorithms to detect shifts in collaboration patterns to support timely monitoring and foster a more engaging learning experience. In summary, our contributions offer practical implications for designing and implementing responsive and effective educational technologies.
10. ACKNOWLEDGMENTS
We would like to thank NSF (e.g., 2331379, 1903304, 1822830, 1724889), as well as IES (R305B230007), Schmidt Futures, MathNet, and OpenAI.
11. REFERENCES
- W. Aigner, S. Miksch, W. Müller, H. Schumann, and C. Tominski. Visual methods for analyzing time-oriented data. IEEE Transactions on Visualization and Computer Graphics, 14(1):47–60, 2008.
- M. Allaymoun. Analysis of cscl chats for cognitive assessment and individual participations. International Journal of Computing and Digital Systems, 10:181–190, 2021.
- W. Alswiti, J. Alqatawna, B. Al-Shboul, H. Faris, and H. Hakh. Users profiling using clickstream data analysis and classification. In 2016 Cybersecurity and Cyberforensics Conference (CCC). IEEE, 2016.
- B. Amnueypornsakul, S. Bhat, and P. Chinprutthiwong. Predicting attrition along the way: The uiuc model. In Proceedings of the EMNLP 2014 Workshop on Analysis of Large Scale Social Interaction in MOOCs, pages 55–59, 2014.
- G. Andrienko and N. Andrienko. Visual exploration of the spatial distribution of temporal behaviors. In Ninth International Conference on Information Visualisation (IV’05), pages 799–806. IEEE, 2005.
- R. Baker, D. Xu, J. Park, R. Yu, Q. Li, B. Cung, C. Fischer, F. Rodriguez, M. Warschauer, and P. Smyth. The benefits and caveats of using clickstream data to understand student self-regulatory behaviors: opening the black box of learning processes. International Journal of Educational Technology in Higher Education, 17(1):1–24, 2020.
- S. Baral, A. F. Botelho, J. A. Erickson, P. Benachamardi, and N. T. Heffernan. Improving automated scoring of student open responses in mathematics. International Educational Data Mining Society, 2021.
- S. Baral, K. Seetharaman, A. F. Botelho, A. Wang, G. Heineman, and N. T. Heffernan. Enhancing auto-scoring of student open responses in the presence of mathematical terms and expressions. In International Conference on Artificial Intelligence in Education, pages 685–690. Springer, 2022.
- N. Belarbi, N. Chafiq, M. Talbi, A. Namir, and E. Benlahmar. User profiling in a spoc: A method based on user video clickstream analysis. International Journal of Emerging Technologies in Learning (Online), 14(1):110, 2019.
- D. J. Berndt and J. Clifford. Using dynamic time warping to find patterns in time series. AAAI workshop on knowledge discovery in databases, 10:359–370, 1994.
- A. F. Botelho, S. Baral, J. A. Erickson, P. Benachamardi, and N. T. Heffernan. Leveraging natural language processing to support automated assessment and feedback for student open responses in mathematics. Journal of Computer Assisted Learning, 2023.
- A. F. Cabrera, J. L. Crissman, E. M. Bernal, A. Nora, P. T. Terenzini, and E. T. Pascarella. Collaborative learning: Its impact on college students’ development and diversity. Journal of College Student Development, 43(1):20–34, 2002.
- D. Cao, A. S. Lan, W. Chen, C. G. Brinton, and M. Chiang. Learner behavioral feature refinement and augmentation using gans. In Artificial Intelligence in Education: 19th International Conference, AIED 2018, London, UK, June 27–30, 2018, Proceedings, Part II 19, pages 41–46. Springer, 2018.
- J. Y.-C. Chan, J. E. Lee, C. A. Mason, K. Sawrey, and E. Ottmar. From here to there! a dynamic algebraic notation system improves understanding of equivalence in middle-school students. Journal of Educational Psychology, 114(1):56, 2022.
- J. Chen, M. Wang, P. A. Kirschner, and C.-C. Tsai. The role of collaboration, computer use, learning environments, and supporting strategies in cscl: A meta-analysis. Review of Educational Research, 88(6):799–843, 2018.
- S. A. Crossley, S. Karumbaiah, J. Ocumpaugh, M. J. Labrum, and R. S. Baker. Predicting math identity through language and click-stream patterns in a blended learning mathematics program for elementary students. Journal of Learning Analytics, 7(1):19–37, 2020.
- A. Dani et al. Cluster analysis of data logs generated by intelligent tutor to determine students’ learning profiles. Journal Name, Volume Number(Issue Number):Page Range, 2020.
- L. E. Decker-Woodrow, C. A. Mason, J. E. Lee, J. Y.-C. Chan, A. Sales, A. Liu, and S. Tu. The impacts of three educational technologies on algebraic understanding in the context of covid-19. AERA open, 9:23328584231165919, 2023.
- P. Dillenbourg. What do you mean by collaborative learning?, 1999.
- P. Dillenbourg. Design for classroom orchestration. Computers & education, 69:485–492, 2013.
- J. P. Dorman. The effect of clustering on statistical tests: an illustration using classroom environment data. Journal Name, Volume Number(Issue Number):Page Range, 2019.
- M. Erkens, D. Bodemer, and H. U. Hoppe. Improving collaborative learning in the classroom: Text mining based grouping and representing. International Journal of Computer-Supported Collaborative Learning, 11:387–415, 2016.
- Q.-K. Fu and G.-J. Hwang. Trends in mobile technology-supported collaborative learning: A systematic review of journal publications from 2007 to 2016. Computers & Education, 119:129–143, 2018.
- B. A. Hany and N. Setyaningsih. The influence of learning media, learning motivation and mathematics communication on mathematics learning outcomes. Journal of Mathematics and Mathematics Education, 12(1):44–51, 2021.
- H. Jeong, C. E. Hmelo-Silver, and K. Jo. Ten years of computer-supported collaborative learning: A meta-analysis of cscl in stem education during 2005–2014. Educational research review, 28:100284, 2019.
- D. W. Johnson and R. T. Johnson. Cooperation and competition: Theory and research. Interaction Book Company, 1989.
- M. Laal and S. M. Ghodsi. Benefits of collaborative learning. Procedia-social and behavioral sciences, 31:486–490, 2012.
- Q. Law, H. So, and J. Chung. Effect of collaborative learning on enhancement of students’ self-efficacy, social skills and knowledge towards mobile apps development. American Journal of Educational Research, 5(1):25–29, 2017.
- J. E. Lee, J. Y.-C. Chan, A. F. Botelho, and E. Ottmar. Does slow and steady win the race?: Clustering patterns of students’ behaviors in an interactive online mathematics game. Educational technology research and development, 70(5):1575–1599, 2022.
- J. E. Lee, A. Jindal, S. N. Patki, A. Gurung, R. Norum, and E. Ottmar. A comparison of machine learning algorithms for predicting student performance in an online mathematics game. Interactive Learning Environments, pages 1–15, 2023.
- H. Li and H. Zhao. Applying an online learning platform to enhance students’ online education classroom learning experience during covid-19. In 2022 8th International Conference on Humanities and Social Science Research (ICHSSR 2022), pages 2837–2842. Atlantis Press, 2022.
- J. Lithner. Principles for designing mathematical tasks that enhance imitative and creative reasoning. Zdm, 49(6):937–949, 2017.
- C. N. Loes and E. T. Pascarella. Collaborative learning and critical thinking: Testing the link. The Journal of Higher Education, 88(5):726–753, 2017.
- R. Martinez-Maldonado. A handheld classroom dashboard: Teachers’ perspectives on the use of real-time collaborative learning analytics. International Journal of Computer-Supported Collaborative Learning, 14:383–411, 2019.
- L. Martínez-Venegas. Towards a collaborative learning framework for d-learning based on improving the teamwork skills of adolescents. Avances en Interacción Humano-Computadora, 2022.
- A. Mawasi, I. Ahmed, E. Walker, S. Wang, Z. Marasli, A. Whitehurst, and R. Wylie. Using design-based research to improve peer help-giving in a middle school math classroom. pages 1189–1196, 2020.
- M. Mueller, D. Yankelewitz, and C. Maher. A framework for analyzing the collaborative construction of arguments and its interplay with agency. Educational Studies in Mathematics, 80:369–387, 2012.
- E. Ottmar, D. Landy, E. Weitnauer, and R. Goldstone. Graspable mathematics: Using perceptual learning technology to discover algebraic notation. In Integrating touch-enabled and mobile devices into contemporary mathematics education, pages 24–48. IGI Global, 2015.
- T. Panitz. Benefits of cooperative learning in relation to student motivation. In YourEditor’sName, editor, Motivation from Within: Approaches for Encouraging Faculty and Students to Excel, New Directions for Teaching and Learning. Jossey-Bass, San Francisco, CA, 1999.
- P. Peng, X. Lin, Z. E. Ünal, K. Lee, J. Namkung, J. Chow, and A. Sales. Examining the mutual relations between language and mathematics: A meta-analysis. Psychological Bulletin, 146(7):595, 2020.
- O. Poquet, J. Jovanovic, and A. Pardo. Student profiles of change in a university course: A complex dynamical systems perspective. In LAK23: 13th International Learning Analytics and Knowledge Conference, pages 197–207, 2023.
- J. Rhim and G. Gweon. Understanding the relationship between students’ learning outcome and behavioral patterns using touch trajectories. In Proceedings of the Ninth ACM Conference on Learning@ Scale, pages 441–445, 2022.
- S. N. Safitri, H. Setiadi, and E. Suryani. Educational data mining using cluster analysis methods and decision trees based on log mining. Journal Name, Volume Number(Issue Number):Page Range, 2022.
- A. H. Schoenfeld. Classroom observations in theory and practice. ZDM, 45:607–621, 2013.
- B. B. Schwarz, N. Prusak, O. Swidan, A. Livny, K. Gal, and A. Segal. Orchestrating the emergence of conceptual learning: A case study in a geometry class. International Journal of Computer-Supported Collaborative Learning, 13:189–211, 2018.
- J. Scianna, M. Woodard, B. Galarza, S. Lee, R. Kaliisa, and H. V. Quesada. Community at a distance: Understanding student interactions in course-based online discussion forums. In International Conference on Quantitative Ethnography, pages 270–284. Springer, 2022.
- D. F. Shell, J. Husman, J. E. Turner, D. M. Cliffel, I. Nath, and N. Sweany. The impact of computer supported collaborative learning communities on high school students’ knowledge building, strategic learning, and perceptions of the classroom. Journal of Educational Computing Research, 33(3):327–349, 2005.
- T. Talan. The effect of computer-supported collaborative learning on academic achievement: A meta-analysis study. International Journal of Education in Mathematics, Science and Technology, 9(3):426–448, 2021.
- Q. Tian and X. Zheng. Effectiveness of online collaborative problem-solving method on students’ learning performance: A meta-analysis. Journal of Computer Assisted Learning, 40(1):326–341, 2024.
- K. J. Topping, W. Douglas, D. Robertson, and N. Ferguson. Effectiveness of online and blended learning from schools: A systematic review. Review of Education, 10(2):e3353, 2022.
- L. S. Vygotsky and M. Cole. Mind in society: Development of higher psychological processes. Harvard university press, 1978.
- J. Zhang, J. M. A. L. Andres, S. Hutt, R. S. Baker, J. Ocumpaugh, C. Mills, J. Brooks, S. Sethuraman, and T. Young. Detecting SMART model cognitive operations in mathematical problem-solving process. In A. Mitrovic and N. Bosch, editors, Proceedings of the 15th International Conference on Educational Data Mining, pages 75–85. International Educational Data Mining Society, July 2022.
- C. Zhu. Student satisfaction, performance, and knowledge construction in online collaborative learning. Journal of Educational Technology & Society, 15(1):127–136, 2012.