ABSTRACT
Open-ended learning environments (OELEs) support constructivist approaches to STEM learning. This promotes student engagement and facilitates a deeper understanding of STEM topics. Despite their benefits, OELEs can present significant challenges for novice learners. Recent studies have revealed the complex relationship between students’ affective states, cognitive processes, and performance in OELEs. Yet, a relatively unexplored domain is the relation between students’ use of effective cognitive processes represented by coherence measures and their affective states. In this paper, we used multimodal approach to analyze the interaction log data and affective states from 33 middle school students constructing causal maps using an OELE named Betty’s Brain. Deep learning methods were employed for emotion recognition, focusing on learning-centered emotions: engagement, delight, boredom, confusion, and frustration. Our findings reveal significant differences in the coherence of actions between high and low performers, impacting their affective states. Results indicate that high performers demonstrated greater coherence in their actions, which correlates with more positive affective states. This underscores the need for adaptive scaffolds in OELEs to improve student engagement and learning outcomes by focusing on the interplay between cognitive and affective states.
Keywords
1. INTRODUCTION
Open-ended learning environments (OELEs) are designed to provide authentic inquiry-based learning and problem-solving experiences. They have been shown to promote active learning, which deepens student engagement and understanding of STEM subjects [5]. Despite these benefits, OELEs also pose significant challenges because the complexity of the learning and problem-solving tasks requires students to develop Self Regulated Learning (SRL) strategies to navigate and learn within these contexts effectively [14].
Several studies have demonstrated the relations between cognition, metacognition, and affect in the context of SRL and problem-solving. Understanding the interplay between students’ affective states and cognitive processes within OELEs is important because emotions can have a significant impact on students’ learning behaviors and performance [21]. The ability to regulate emotions and sustain engagement is vital for maximizing the educational benefits of OELEs, making the creation of adaptive, affect-sensitive systems a critical objective to improve learning experiences and outcomes [7].
Recent advances in technology and deep learning algorithms have facilitated the online analysis of students’ affective states using face tracking algorithms [8, 1, 18]. While these initiatives show promise in enhancing learning through empathetic and motivational support, they often do not fully encapsulate the dynamic interaction between emotions and cognitive processes. Typically, the focus is on isolated elements rather than the holistic learning experience that includes measures of their understanding over time. Additionally, the interplay of coherence of students’ effective cognitive processes, defined as the degree to which initial activities generate information that is used to perform subsequent actions in the learning environment and emotion, remains an unexplored topic in the current literature [14].
In this paper, we take a deeper dive into investigating these relations and specifically study the correlations between students’ cognitive processes, coherence, and their affective states. We do this in the context of middle school students learning about scientific processes by constructing causal models in the Betty’s Brain OELE [5]. In this environment, students’ cognitive processes and strategies are typically linked to their acquiring information by reading a science book [Read], translating what they read into relevant concepts and links between these concepts, to construct a causal model of a scientific process [Build], and then periodically taking quizzes to check the correctness and completeness of their evolving model [Quiz]. In previous work, we have shown that students with more coherent activity sequences are more successful in their learning and model-building tasks [19]. Since coherence leads to effective performance, we investigate the relationship between the coherence of students’ actions and their affective states when they perform such actions. Using this framework, we examine the relationship between students’ affective states and their performance as they work in the Betty’s Brain environment.
Overall, this research aims to study how students’ emotional experiences vary depending on the coherence of their read, build, and quiz action sequences. We use students’ logged activities in the Betty’s Brain environment to derive coherence between paired action sequences that can be interpreted as cognitive strategies [5]. Simultaneously, we track their affective states using face-tracking algorithms applied to webcam videos to study the following research questions:
- Is there a difference in the percentage of coherent read-to-build, quiz-to-build, and quiz-to-read action pairs between the high and low performing students?
- Are there significant differences in aggregated affective states exhibited by high and low performers when working in the Betty’s Brain environment?
- What are the differences in emotional experiences between high and low performers when involved in coherent versus incoherent action sequences?
- Are there emotional differences between high and low performers in their quiz-to-build action pairs when they are coherent versus not coherent?
The rest of this paper is organized as follows. The next section discusses the literature review. In the following section, we provide a generalized definition of coherence when analyzing students’ cognitive strategies as they work in the Betty’s Brain environment. We also discuss our method for identifying students’ academic affective states. Next, we report our findings to answer the three RQs presented above. We address the significance of our findings for developing OELEs that promote effective learning processes and emotional regulation. Finally, we summarize our contributions and offer suggestions for further research.
2. RELATED WORK
OELEs promote constructivist STEM learning processes through problem-solving and inquiry-based experiences [5, 6]. The open-ended nature of these environments demand high levels of cognitive and metacognitive involvement, as learners are expected to set goals and formulate plans to learn and apply new information, formulate and verify hypotheses, and engage in monitoring and reflection activities to ensure progress toward their goals [12, 25].
Novice learners often need help in these environments because they struggle to acquire knowledge and effectively regulate their learning and problem-solving tasks simultaneously. Therefore, these environments must scaffold students’ learning and use self-regulation strategies to help them advance in their learning tasks [3, 13]. To address these challenges, it is imperative to consider the multifaceted nature of self-regulated learning. Beyond the acquisition of knowledge, successful self-regulation involves a nuanced interplay of students’ affective experiences, cognitive processes, and metacognitive strategies. Recognizing the influence of emotions, cognitive engagement, and metacognitive awareness is pivotal in creating a comprehensive understanding of how students navigate and succeed in complex learning environments. This holistic perspective sets the stage for exploring the intricate connections between affect, cognition, and metacognition in the context of self-regulated learning [15].
Identifying learning-centered emotions, encompassing states like confusion, boredom, frustration, engagement, and delight, plays a pivotal role in comprehending learner behaviors and performance dynamics [15, 2, 11]. Despite the success of state-of-the-art computer vision methods in recognizing basic emotions, their application within Open-Ended Learning Environments (OELE) introduces distinctive challenges [23, 1]. Existing techniques notably lack training with K-12 student data, and, specifically, on learning-centered emotions derived from OELE datasets. Therefore, an effective approach necessitates developing methods that are pre-trained on K-12 student data focusing on academic emotions.
While some architectures are trained on extensive datasets, including children’s data, they primarily target continuous emotions like valence and arousal. Russell’s circumplex model guides the conversion of continuous emotions into discrete categories. However, the challenge remains in transforming them into distinct learning-centered emotions, revealing a gap in OELE learning environments.
However, none of the existing literature tries to understand the interplay between the coherence of cognitive processes and affective states during learning and problem-solving activities. In this study, we aim to fill this gap and explore the intricate relationship between the coherence of cognitive processes and affective states to understand the learning experience better.
3. METHODS
The Betty’s Brain Environment: Betty’s Brain, an OELE designed for middle school students, uses a learning- by-teaching approach to help students learn their science by building a causal model of a scientific process, and, at the same time, by developing their cognitive and metacognitive abilities to become better learners.
Betty’s Brain system interface provides learners with a variety of resources and tools for knowledge acquisition, model construction, and model evaluation. The system components include a science book, which is a collection of hypermedia resource pages that provide the subject knowledge for constructing the causal model. Learners read relevant pages of the science book to learn about relevant science concepts and the causal (cause-and-effect) relationships between these concepts. Students then teach their agent by using a visual causal map construction and viewing tool.
The system provides additional tools to assess the causal map’s correctness using the query and quiz features. Quiz results help students check the correctness of their causal maps by uncovering errors and omissions in their current causal map. Proficient learners use this feedback to find and correct the errors, but other students often have difficulties in translating their quiz results into productive actionable information [12]. Students may also choose to find pages in the science book that help them review the knowledge corresponding to incorrect or incomplete answers before they continue to build their causal map. In essence, the quizzes allow students to track their learning progress, and, therefore, their understanding of the required science knowledge.
Study: We analyzed the cognitive processes of students learning about climate change topics in our study from their interactive log data extracted from Betty’s Brain in CSV format. Though the study included more than 80 students who had consented to the data collection, our inclusion criteria, e.g., students whose data was corrupted, and students who were absent on day 2 or day 3 of the study, resulted in a sample size of 33 students (age range 10-12). We excluded day 1 (when students were familiarizing themselves with the environment) and included data from days 2 and 3, with each student working approximately 40 minutes per day on Betty’s Brain. Days 2 and 3 were chosen as the focus of our analyses because the students extensively engaged with the system during this period. The students’ final map scores were collected and documented. The final map score is calculated as a subtraction of the total incorrect causal links from the correct ones. We did a median split of the students’ final map scores and discarded the median score, and the median score \(\pm 1\). The resulting students were grouped into 16 high performers and 17 low performers.
Cognitive Processes and Coherence: As discussed earlier, we considered students’ Reading the science book, Building the causal map, and Quizing to check the correctness of their map as their primary activities in the Betty’s Brain environment. All of these actions are collected and labeled with timestamps and additional contextual information in the system logs.
Coherence between Action Pairs. The notion of coherence is based on the principle of support, which refers to the degree to which an initial activity, \(x\) generates information that is then used by a future action, \(y\) in the learning environment. The pair of actions \((x,y)\) are coherent when action \(y\) effectively employs the knowledge produced by a preceding action \(x\) [20].
Affect Detection HSEmotion (High-Speed Face Emotion Recognition) is used in this study to predict the valence and arousal values. The architecture is trained for face identification leveraging the VGGFace2 dataset [17]. The VGGFace2 dataset, comprising 3.31 million images across 9131 subjects (identities), presented diverse variations in pose, age, illumination, ethnicity, and profession [9].
These datasets encompassed facial images of children within the age group relevant to our study’s focus. Hence, the models were trained and validated on images representative of the specific age group considered in this study. The input videos run at 30 frames per second, with emotion prediction on each frame.
The employed architecture can detect emotions even when only 30% of the face is visible. However, our analysis exclusively considered emotion predictions derived from instances where more than 60% of the face was visible. Any predictions made when the student’s face was not in the frame or when less than 60% of the face was visible were excluded from consideration. We utilized the 12th Gen Intel® Core™ i9-12900F processor clocked at 2.40 GHz, coupled with the NVIDIA GeForce RTX 4070 graphics card, and a total of 32GB RAM for our emotion recognition architecture.

The output of HSEmotion is a CSV file containing valence and arousal values along with frame numbers. These valence-arousal values are transformed into discrete emotions using Russell’s circumplex, explicitly focusing on five learning-centered emotions: delight, boredom, frustration, confusion, and engagement. Additionally, Figure 1 indicates the presence of other emotions alongside neutral ones (intersecting quadrants). Therefore, we classified emotions into seven labels: the five learning-centered emotions, neutral, and others. The ’others’ category includes three cases: when all other emotions are considered, when fleeting emotions (explained later) are accounted for, and also when faces are not visible.
Learning-centered emotion annotation: While D’Mello [10] utilizes Russell’s circumplex [16] of emotions to identify discrete emotions on a valence-arousal scale in the education domain, these methods are not specifically applied to OELE involving children of the age group considered in this study. Therefore, we manually annotated 500 images for each learning-centered emotion, randomly selected from various timestamps during the study. These images were chosen from the data of 10 students, ensuring an equal division of gender (5 males and 5 females) and diverse demographic backgrounds, including 3 White Americans, 3 African Americans, 2 Hispanics, and 2 Asians. Two different annotators independently annotated each emotion using facial expressions, and the inter-rater reliability, measured by Cohen’s Kappa, was 0.91. To determine the range of values on the valence-arousal scale, instances where both annotators completely agreed (\(\kappa = 1\)) for each learning-centered emotion were considered. While the annotated data identified the same area on Russell’s circumplex, it represented a range of values surrounding that point, as depicted in Figure 1. After removing outliers, a smaller dispersion for each learning-centered emotion with an average standard deviation of 1.1 was observed. Using this range of values for each learning-centered emotion, the valence-arousal values were converted to discrete learning-centered emotions and stored in the CSV file.
To ensure consistency and reliability, we filtered out fleeting emotions by setting a threshold: emotions were considered valid only if they persisted for at least 5 seconds, equivalent to 150 consecutive frames. Abrupt changes or sudden spikes in emotions were disregarded during the analysis, requiring a minimum duration of 150 frames for an emotion to be considered. When fleeting emotions occurred, the class label ’others’ was used. Consequently, the final CSV file from the affect detection step contains the 7 class labels.
This cognitive process-related data (which includes cognitive processes and coherence details) is then cross-referenced with the CSV file generated from emotion recognition. The latter contains frame numbers, timestamps, and corresponding 7 class labels based on the system timestamp. The objective is to amalgamate these files, resulting in a comprehensive dataset that provides insights into the total instances of each emotion label for every instance of the cognitive process, along with coherence information during its specific duration. For the entire study, IRB approval has been obtained, and all necessary participant consent procedures and formalities have been diligently followed.
4. RESULTS AND DISCUSSION
In this section, we report our results to answer the research questions outlined in Section 1. We performed a series of non-parametric Mann-Whitney U Tests to check our hypotheses associated with the research questions. First, we computed the percentage of coherent READ \(\rightarrow \) BUILD (R-B), QUIZ \(\rightarrow \) BUILD (Q-B), QUIZ \(\rightarrow \) READ (Q-R) action pairs for the high and low performers and checked if there were significant differences for any of these pairs. Next, we analyzed and evaluated the duration of students’ discrete emotional states, expressed as a percentage of the total time they worked in the learning environment. The discrete emotions we computed the percentage time for were: (1) Delight (De), (2) Engaged (En), (3) Confusion (Cn), (4) Frustration (Fr), and (5) boredom (Br). When we were unable to establish an affective state, we labeled it as Others (Ot). For RQ3, we compared the affective state distributions between high- and low-performing students when they performed coherent and non-coherent action pairs. Finally, we probed more into the QUIZ \(\rightarrow \) BUILD action pairs (coherent and non-coherent) to examine the differences in affective states between high and low performers. A particular reason for studying the affective states in the QUIZ \(\rightarrow \) BUILD action pair was because a lot of students had difficulty performing this action pair in an effective way. In other words, they had difficulties in using the QUIZ results to make corrections in their causal maps, and we were curious to see if this also resulted in negative affective states.

RQ1: Is there a difference in the percentage of coherent read-to-build, quiz-to-build, and quiz-to-read action pairs between the high and low performing students?
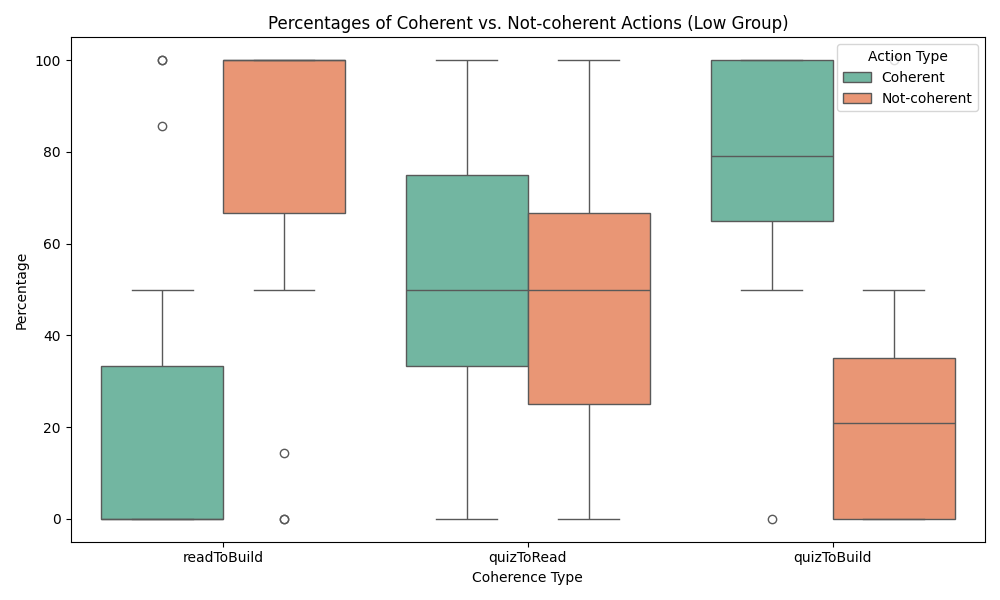
We computed the percentages of coherent and non-coherent action pairs (i.e., R-B, Q-B, and Q-R) for the high- and low-performing groups. Figures 2 and 3 show the distribution of the coherence percentages for the three action pairs. Figure 2 shows the boxplot of the percent of the oherent and not-coherent action pairs for high-performing students. The coherent read-to-build action pairs exhibit a median percentage of around \(42\%\) with a substantial spread. On the contrary, not-coherent read-to-build action pairs show a tighter distribution with a median of around \(60\%\). For quiz-to-build and quiz-to-read action pairs, the percentages of coherent and not-coherent action pairs are closely matched, with medians around the \(50\%\) region. The quiz-to-read action pairs, in particular, demonstrate a lower median for coherent actions compared to not-coherent actions, which surpass the \(50\%\) threshold. Next, Figure 3 plots the percentage distributions of action pairs for low-performing students. Coherent read-to-build action pairs show a lower median percentage, below \(20\%\), and outliers suggest sporadic higher percentages. The not-coherent counterparts record a notably higher median percentage, near \(80\%\). The quiz-to-build coherent action pairs have a median percentage of around \(40\%\), while not-coherent actions record a median close to \(60\%\). For quiz-to-read actions, particularly for the low performers, there is a distinct difference between coherent and not-coherent actions, with medians below \(20\%\) and above \(70\%\), respectively. These boxplot distributions highlight the fact that low-performers perform more non-coherent action pairs than high performers.
| AP | High: M (SD) | Low: M (SD) | U Stat | P-Value |
|---|---|---|---|---|
| R-B | 42.00 (13.98) | 22.57 (21.59) | 210 | 0.0077* |
| Q-B | 84.63 (13.70) | 46.54 (42.45) | 201.5 | 0.0177* |
| Q-R | 61.29 (20.06) | 55.11 (26.14) | 159 | 0.4167 |
Note: * indicates significance at \(p < 0.05\); AP: Action Pairs
Table 1 shows the averages and standard deviations of the three coherent action pairs for high and low performers. The Mann-Whitney U test indicated statistically significant differences between groups for R-B (\(U = 210\), \(p < .05\)) Q-B (\(U = 201.5\) and \(p = .0177\)). However, for Q-R coherence, the Mann-Whitney U test did not show statistically significant differences between the groups (\(U = 159\), \(p < .05\)). Interestingly, the high performers were much better than the low performers in converting the information they READ into relevant causal map links (BUILD), and they were also effective in using the QUIZ results to go back and READ relevant pages. However, all students seemed to have difficulty with using the Quiz results to make informed corrections in their maps.
RQ2: Are there significant differences in the aggregated affective states exhibited by high and low performers when working in the Betty’s Brain environment?
| E | High: M (SD) | Low: M (SD) | U Stat | P |
|---|---|---|---|---|
| De | 6.38 (10.06) | 2.49 (3.21) | 192 | 0.0456* |
| En | 5.04 (3.61) | 3.20 (3.50) | 184 | 0.0871 |
| Co | 21.15 (10.48) | 20.89 (11.93) | 144 | 0.7870 |
| Bo | 13.56 (13.47) | 17.87 (12.81) | 105 | 0.2719 |
| Fr | 3.46 (7.31) | 4.55 (5.85) | 108 | 0.3219 |
| Ot | 39.27 (13.65) | 43.96 (11.06) | 112 | 0.3973 |
Note: * indicates significance at p < 0.05.
E: Emotion; De:Delight; En:Engagement; Co:Confusion; Br:Boredom; Fr:Frustration; Ot:Other; P:P-Value
To address RQ2, we first computed the ratio of the aggregated duration of each discrete emotion to the total duration of time spent in the learning environment and then converted these ratios to percentages (see Table 2). The Mann-Whitney U-tests revealed that Delight was the only affective state where there were differences between High and Low performers. This result confirms our previous results, where we found that High performers were more successful in building their causal maps, and, therefore, expressed more Delight as they kept getting more and more correct answers on their quizzes [20]. Though their Engagement states (when the student is engaged in their task but shows no visible emotion) had a low percentage, the difference between High and Low performers showed a trend (\(P=0.09\)).
Interestingly, the label Other (i.e., situations where we could not assign an affective state to the student) was quite high across all students. This could be because the student had moved away from their laptop so the webcam could not track the students’ faces. It could also be that our computed valence and arousal values did not quite fall with the regions where we could label definitive educational affective states using Figure 1. Among the other affective states, Confusion levels, i.e., a state of cognitive disequilibrium, were relatively high for both groups. This indicated that the learning task was not easy, and students often had to put in some effort before they could overcome their state of cognitive disequilibrium. However, students did not get into prolonged periods of Frustration. We expected that Frustration levels, a negative and disruptive affective state, would be higher for Low performers, but it is good to see that was not the case. Students did seem to go into the Bored or Disengaged state for about 15% of the total time spent on the system. Typically, this may be considered to be a negative affective state, but as others have pointed out, boredom’s causes and consequences are ambiguous and often associated with individual differences [4, 24]. At times, disengagement, i.e., taking a break, may be beneficial because it enables recovery and avoids negative frustrated states [26].
RQ3: What are the differences in emotional experiences between high and low performers when they are performing coherent versus incoherent action sequences?
| E | High: M (SD) | Low: M (SD) | U Stat | P |
|---|---|---|---|---|
| De | 8.26 (8.00) | 4.12 (6.46) | 190 | 0.0536 |
| En | 8.35 (7.04) | 4.32 (5.72) | 188.5 | 0.0608 |
| Co | 41.31 (44.21) | 55.16 (79.19) | 150.5 | 0.6140 |
| Bo | 21.43 (24.72) | 47.46 (89.77) | 108 | 0.3217 |
| Fr | 8.74 (17.74) | 8.70 (11.92) | 121.5 | 0.6115 |
| Ot | 68.83 (39.71) | 107.02 (110.76) | 114.5 | 0.4493 |
Note: * indicates significance at p < 0.05.
E: Emotion; De:Delight; En:Engagement; Co:Confusion; Br:Boredom; Fr:Frustration; Ot:Other; P:P-Value
| E | High: M (SD) | Low: M (SD) | U Stat | P |
|---|---|---|---|---|
| De | 11.91 (15.14) | 5.44 (7.68) | 173 | 0.1884 |
| En | 8.34 (6.91) | 6.58 (8.86) | 172 | 0.2006 |
| Co | 38.99 (23.72) | 54.41 (57.26) | 144 | 0.7870 |
| Bo | 40.09 (65.52) | 32.88 (29.83) | 115 | 0.4601 |
| Fr | 7.44 (21.21) | 11.72 (18.82) | 108 | 0.3211 |
| Ot | 80.55 (55.99) | 85.38 (49.33) | 128 | 0.7870 |
Note: * indicates significance at p < 0.05.
E: Emotion; De:Delight; En:Engagement; Co:Confusion; Br:Boredom; Fr:Frustration; Ot:Other; P:P-Value
We addressed RQ3 in a similar manner to RQ2. We calculated the ratio of the duration of each discrete emotion for high and low performers when they were performing coherent action pairs to the total time they spent on the system (see Table 3). We performed similar calculations for the ratio of the duration on non-coherent action pairs to the total time spent on the system (see Table 4).
As anticipated, High-performing students exhibit greater Delight compared to Low-performing students when executing coherent action pairs. Although the observed difference lacks statistical significance, we see a discernible trend in the result. A similar pattern is observed for Engagement. We hypothesize that this difference may be attributed to the greater confidence of High performers in the success of their system-related actions, leading to a more positive affective state compared to Low performers. This proposition is further supported by the observation that these differences diminish when both High and Low performers engage in non-coherent action pairs, as neither group is certain about the outcomes of their actions.
Surprisingly, the Confusion percentages are high for High and Low performers, even when they are performing coherent action pairs. One would have expected that the Confusion percentage would be lower for High performers when they were performing coherent action pairs, and significantly less than that of the Low performers. Similarly, there were no differences for the other Affect states between the High and Low performers.
RQ4: Are there affect differences between high and low performers during the quiz-to-build action pair when they are coherent versus not coherent?
| E | High: M (SD) | Low: M (SD) | U Stat | P |
|---|---|---|---|---|
| De | 5.77 (10.81) | 1.30 (4.05) | 205.5 | 0.0097* |
| En | 4.57 (5.05) | 2.17 (4.49) | 200.0 | 0.0183* |
| Co | 15.93 (11.80) | 5.59 (8.54) | 220.0 | 0.0022* |
| Bo | 9.13 (11.57) | 9.73 (15.40) | 167.5 | 0.2525 |
| Fr | 3.73 (8.28) | 1.12 (2.84) | 172.0 | 0.1688 |
| Ot | 34.43 (17.18) | 24.89 (29.13) | 161.0 | 0.3685 |
Note: * indicates significance at p < 0.05.
E: Emotion; De:Delight; En:Engagement; Co:Confusion; Br:Boredom; Fr:Frustration; Ot:Other; P:P-Value
| E | High: M (SD) | Low: M (SD) | U Stat | P |
|---|---|---|---|---|
| De | 2.12 (3.54) | 0.31 (0.72) | 157.0 | 0.3788 |
| En | 1.88 (3.88) | 2.41 (5.59) | 148.0 | 0.6307 |
| Co | 12.57 (14.34) | 7.22 (12.37) | 162.0 | 0.3229 |
| Bo | 7.96 (12.43) | 8.15 (14.02) | 138.0 | 0.9521 |
| Fr | 0.43 (1.27) | 2.23 (5.29) | 116.0 | 0.3879 |
| Ot | 26.52 (27.68) | 20.87 (28.00) | 154.0 | 0.4976 |
Note: * indicates significance at p < 0.05.
E: Emotion; De:Delight; En:Engagement; Co:Confusion; Br:Boredom; Fr:Frustration; Ot:Other; P:P-Value
Given the significant differences in coherence for two of the action pairs (R-B and Q-B) between the High and Low performers for RQ1, but no significant differences in the affective states for RQ2 and RQ3, we decided to probe further and study differences in affect for action pairs individually. In this paper, we analyze results for affect state differences for the Q-B action pair. As discussed earlier, we hoped to see more differences between the two groups because the High performers were likely more confident in their success in correcting their maps using the Quiz results. Tables 5 and 6 show the affective states for the high and low performers for coherent Q-B and non-coherent Q-B action pairs. Table 5 for the coherent action pairs shows significant differences between High and Low performers for Delight (De) and Engagement (En), and Confusion (Co), with respective P-values of \(.01\), \(.02\), and \(.0022\). No significant differences were found for boredom (Bo), frustration (Fr), or other emotions (Ot) in coherent sequences.
On the other hand, Table 6 shows no significant affect differences detected between High and Low performers in action pairs that were not coherent across all of the learning-centered emotions. The combinations of these results indicate that there is a relation between coherence and the positive affective states, i.e., Delight and Engagement. In other words, High performers may have a better understanding of how to combine action pairs to generate effective results, i.e., higher map scores. This is also demonstrated in their positive affect. However, in situations, where the High performers may not have this understanding, i.e., their action pair are non-coherent (which corresponds to making guesses or performing trial and error actions), there is little difference between their affective states and that of the Low performers.
5. CONCLUSIONS AND FUTURE WORK
This paper presents some of our initial results in understanding the relations between students’ cognitive and strategic processes (i.e., action pairs) and their affective states as they work on complex learning and problem-solving tasks in an OELE. The notion of coherence, which is a measure of students’ effective strategic behaviors, does show some relation to students’ affective states. Our results demonstrated significant differences in the coherence of action pairs between High and Low performers. High performers showed a greater percentage of coherent Read-to-Build and Quiz-to-Build action pairs as compared to low performers. This provides some explanations as to why they perform better \(-\) they are better at interpreting what they read than low performers, and they are better at debugging errors in their maps as compared to low performers. This conforms to and supports a number of our previous results in OELE environments [21, 13, 22].
Future research should investigate how students’ coherence, specifically the correctness/effectiveness of their actions, interacts with the dynamic interplay of emotions within OELEs. Exploring the impact of coherence on academic outcomes and evaluating the outcomes associated with coherent action pairs will provide valuable insights.
Acknowledgement
This work was supported by the National Science Foundation (NSF) AI Institute Grant No. DRL-2112635 and NSF Eager Award No. 2327708. Any opinions, findings and conclusions or recommendations expressed in this material are those of the authors and do not necessarily reflect the views of the National Science Foundation.
6. REFERENCES
- T. Ashwin and R. M. R. Guddeti. Affective database for e-learning and classroom environments using indian students’ faces, hand gestures and body postures. Future Generation Computer Systems, 108:334–348, 2020.
- T. Ashwin and R. M. R. Guddeti. Impact of inquiry interventions on students in e-learning and classroom environments using affective computing framework. User Modeling and User-Adapted Interaction, 30(5):759–801, 2020.
- R. Azevedo and A. F. Hadwin. Scaffolding self-regulated learning and metacognition–implications for the design of computer-based scaffolds. Instructional science, 33(5/6):367–379, 2005.
- S. W. Bench and H. C. Lench. Boredom as a seeking state: Boredom prompts the pursuit of novel (even negative) experiences. Emotion, 19(2):242, 2019.
- G. Biswas, J. R. Segedy, and K. Bunchongchit. From design to implementation to practice a learning by teaching system: Betty’s brain. International Journal of Artificial Intelligence in Education, 26:350–364, 2016.
- J. Broadbent, E. Panadero, J. M. Lodge, and P. de Barba. Technologies to enhance self-regulated learning in online and computer-mediated learning environments. Handbook of Research in Educational Communications and Technology: Learning Design, pages 37–52, 2020.
- R. A. Calvo and S. D’Mello. Affect detection: An interdisciplinary review of models, methods, and their applications. IEEE Transactions on affective computing, 1(1):18–37, 2010.
- F. Z. Canal, T. R. Müller, J. C. Matias, G. G. Scotton, A. R. de Sa Junior, E. Pozzebon, and A. C. Sobieranski. A survey on facial emotion recognition techniques: A state-of-the-art literature review. Information Sciences, 582:593–617, 2022.
- Q. Cao, L. Shen, W. Xie, O. M. Parkhi, and A. Zisserman. Vggface2: A dataset for recognising faces across pose and age. In 2018 13th IEEE international conference on automatic face & gesture recognition (FG 2018), pages 67–74. IEEE, 2018.
- S. D’Mello, A. Graesser, et al. Monitoring affective trajectories during complex learning. In Proceedings of the annual meeting of the cognitive science society, volume 29, 2007.
- S. K. Gupta, T. Ashwin, and R. M. R. Guddeti. Students’ affective content analysis in smart classroom environment using deep learning techniques. Multimedia Tools and Applications, 78:25321–25348, 2019.
- J. S. Kinnebrew, J. R. Segedy, and G. Biswas. Analyzing the temporal evolution of students’ behaviors in open-ended learning environments. Metacognition and learning, 9:187–215, 2014.
- A. Munshi, G. Biswas, R. Baker, J. Ocumpaugh, S. Hutt, and L. Paquette. Analysing adaptive scaffolds that help students develop self-regulated learning behaviours. Journal of Computer Assisted Learning, 39(2):351–368, 2023.
- A. Munshi, R. Rajendran, J. Ocumpaugh, G. Biswas, R. S. Baker, and L. Paquette. Modeling learners’ cognitive and affective states to scaffold srl in open-ended learning environments. In Proceedings of the 26th conference on user modeling, adaptation and personalization, pages 131–138, 2018.
- R. Pekrun and E. J. Stephens. Academic emotions. 2012.
- J. A. Russell. A circumplex model of affect. Journal of personality and social psychology, 39(6):1161, 1980.
- A. Savchenko. Facial expression recognition with adaptive frame rate based on multiple testing correction. In International Conference on Machine Learning, pages 30119–30129. PMLR, 2023.
- A. G. Sebastian, S. Singh, P. Manikanta, T. Ashwin, and G. R. M. Reddy. Multimodal group activity state detection for classroom response system using convolutional neural networks. In Recent Findings in Intelligent Computing Techniques: Proceedings of the 5th ICACNI 2017, Volume 1, pages 245–251. Springer, 2019.
- J. R. Segedy, J. S. Kinnebrew, and G. Biswas. Coherence over time: understanding day-to-day changes in students’ open-ended problem solving behaviors. In Artificial Intelligence in Education: 17th International Conference, AIED 2015, Madrid, Spain, June 22-26, 2015. Proceedings 17, pages 449–458. Springer, 2015.
- J. R. Segedy, J. S. Kinnebrew, and G. Biswas. Using coherence analysis to characterize self-regulated learning behaviours in open-ended learning environments. Journal of Learning Analytics, 2(1):13–48, 2015.
- M. Taub, R. Azevedo, R. Rajendran, E. B. Cloude, G. Biswas, and M. J. Price. How are students’ emotions related to the accuracy of cognitive and metacognitive processes during learning with an intelligent tutoring system? Learning and Instruction, 72:101200, 2021.
- M. Taub, N. V. Mudrick, R. Rajendran, Y. Dong, G. Biswas, and R. Azevedo. How are students’ emotions associated with the accuracy of their note taking and summarizing during learning with itss? In Intelligent Tutoring Systems: 14th International Conference, ITS 2018, Montreal, QC, Canada, June 11–15, 2018, Proceedings 14, pages 233–242. Springer, 2018.
- A. TS and R. M. R. Guddeti. Automatic detection of students’ affective states in classroom environment using hybrid convolutional neural networks. Education and information technologies, 25(2):1387–1415, 2020.
- W. A. Van Tilburg and E. R. Igou. Boredom begs to differ: Differentiation from other negative emotions. Emotion, 17(2):309, 2017.
- P. H. Winne. Theorizing and researching levels of processing in self-regulated learning. British Journal of Educational Psychology, 88(1):9–20, 2018.
- C. Wrosch, M. F. Scheier, C. S. Carver, and R. Schulz. The importance of goal disengagement in adaptive self-regulation: When giving up is beneficial. Self and identity, 2(1):1–20, 2003.