ABSTRACT
Educational data mining increasingly leverages enrollment data for higher education applications. However, these data describe final end-of-semester course selections, not the often complex enrollment activities leading up to a finalized schedule. Fine-grain transaction data of student waitlist, add, and drop actions during academic semester planning can explain the decision-making processes that lead to mismanaged course selection (e.g., dropping a course late with an institutional penalty). The present study investigates student late drops through the lens of procrastination. Results suggest that students who procrastinate on enrolling in courses are likelier to drop courses late. Further, students who enrolled late had a larger predicted workload than their nominal enrollment based on credit hours would suggest, pointing to potential mismanagement in the workload these students take on. These findings motivate the hypothesis that academic advising interventions that support students in academic planning could potentially mitigate the adverse effects of procrastination on academic outcomes.
Keywords
1. INTRODUCTION AND BACKGROUND
Educational data mining has taken increasing interest and has reported many successes in mining detailed enrollment records of students’ course selection in higher education [8, 4]. Enrollment records can be used to study prerequisite inference [8], grade prediction [9], next course prediction [14], and next semester basket prediction [18]. However, course enrollment only tells part of the story of undergraduate course selection activities: they represent what courses a student ends up with at the end of the semester rather than their process of adding, dropping, and waitlisting for courses. In contrast, detailed records of course transactions and data containing a history of these actions leading up to and occurring at the beginning of a semester can speak to underlying processes that tell the story of how students arrived at their end-of-semester enrollments. Recent work in educational data mining has found that mining records of student course enrollment and drop decision-making processes improves the semantic signal in enrollment data for prediction tasks, for example, inferring a course’s popularity and major diversity [22].
The present study presents initial evidence that mining course transaction data of enrollments and drops can also create insights into student academic outcomes and help explain their underlying decision processes. Past work gathered evidence that the courses students take and their attributes (e.g., course workload) relate to academic outcomes such as GPA and dropout [2]. This work, and other prior work (e.g., [21]), has led to the hypothesis that if students take on a workload that is too high and mismanage their resources, their academic outcomes suffer. The present study investigates one example of undesirable academic outcomes: late course drops, defined as students dropping out of an enrolled higher education course after an institutional deadline during which students are free to enroll and drop in eligible courses. Late course dropping is undesirable because it is costly for students and institutional resources.1 Among the top ten largest universities in the United States in terms of the number of enrolled students, six out of ten require students to present documented proof of extenuating circumstances for late course drops (such as the death of a family member, call to military service, and illness of the student), five out of ten institutions denote such drops with markings on student transcripts.
In US-American higher education, which grants students a relatively high degree of freedom in their course selection, the phenomenon of students systematically enrolling in, waitlisting for, and dropping courses to retain their optimal set of courses during a semester is commonly known as course shopping [6]. Course shopping gleaned from sequences of course enrollment and drops is likely to elevate insights into how students manage and mismanage their course load, eventually culminating in late course drops. Prior work identified that a substantial minority of students engage in shopping at a large community college and that the specific type of shopping (e.g., substituting one course for another or retaining a large bulk of courses until late) is related to course completion rates and GPA [6]. Therefore, there is reason to assume that studying shopping can produce more insights into students’ academic outcomes. Further, recent evidence points to the idea that course shopping is increasingly common when students find the course catalog information of a course insufficient for their academic planning [17]. Therefore, studying student add and drop records could speak to suboptimal student course planning due to lacking information on a course until enrolling and taking the course. However, to our knowledge, course shopping has not been studied through fine-grain transaction records as featured in this study. Rather, course shopping has previously been studied through the lens of transcript data [6], questionnaires [17], and indicators from enrollment records such as late enrollment in courses [11]. All studies only had access to smaller, selected samples of specific cohorts or majors, totaling less than 1,000 students. One exception is Lechner [11] with about \(3{,}000\) students across six years at a community college with part-time options. Therefore, there is an opportunity for a research contribution to describe course shopping behavior through large-scale, fine-grained transaction data. To this end, the present study leverages data from over \(N=150{,}887\) student semesters at a large public university in the United States and with over 10 million fine-grain, time-stamped records of student course transactions (i.e., waitlists, adds, drops).
The lens through which we operationalize course shopping behavior to explain late course drops is procrastination, a topic of increasing interest to the educational data mining community and its adjacent disciplines [15, 1]. Procrastination is defined as the student’s tendency to wait until late to complete tasks (in this case, adding and dropping courses during their academic planning period before late dropping is necessary). Procrastination can relate to academic outcomes in higher education through a vicious cycle that reinforces low self-efficacy [21]. Similarly, procrastination has been previously linked to higher education dropout [16]. In both cases, as is common practice in these lines of work, procrastination is measured via survey scales, typically longitudinally [16, 21, 19]. However, given the increasing availability of large-scale, fine-grain data, research in educational data mining and learning analytics has leveraged student activity data to successfully operationalize procrastination, typically measured as the relative time point at which students submit assignments [3, 15]. Analogously, the present study operationalizes procrastination as the relative position of students adding and dropping action to a deadline, standardized in relationship to other students, in a semester.
Procrastination through the lens of inferences from novel, fine-grain data interests the educational data mining community as it could lead us to better student support. Specifically, studying the mechanism by which students end up with a suboptimal set of courses and subsequent adverse academic outcomes can guide intervention. Further, it can help understand why there is a robust link between procrastination and academic outcomes established in prior research [10, 3]. For example, it can reveal misalignments between students’ expectations and actual experiences of courses. Recent work showed that student course shopping can relate to insufficient information about a course [17]. Therefore, a better understanding of late course dropping through data mining could inform student academic advising and course recommender systems, which is part of nascent research in the field [18, 9]. Speaking to mismatched expectations of students signing up for courses, the present study investigates the workload taken on by procrastinators through the emerging lens of course workload analytics [2], which offer more accurate predictions of the workload students experience in a course than the credit hour units reported in course catalogs [13]. In summary, the present study addressed two research questions using fine-grained transaction data of student course add and drop records:
RQ1: What do fine-grained course transactions (i.e., course shopping activities) look like in the lead-up to and at the beginning of a semester?
RQ2: What is the relationship between inferences of procrastination from transaction data and late course drops?
Overall, the present study opens up the subfield of enrollment-based data mining to new predictive tasks and advances methods to study fine-grain differences in academic outcomes based on the meso-level process data of course transactions.
2. METHODOLOGY
2.1 Study Context
The study sample includes institutional recordings of timestamped student course enrollments and drops (referred to as course transactions) between Fall 2016 and Spring 2022 at the University of California, Berkeley, a large public university in the United States. For this study, the data was provided in an anonymized format by an institutional data provider. Due to the data’s anonymized and privately held nature, an IRB approval was not necessary. All data storage and analysis were securely conducted on servers housed within the UC Berkeley data center, ensuring security and confidentiality throughout the research process.
UC Berkeley’s administrative structure includes subject areas as the most fine-grain academic unit. These areas are embedded in departments, followed by divisions and colleges. Further, UC Berkeley is a comprehensive public research university with a wide range of undergraduate, graduate, and professional programs across various disciplines.2
2.2 Data Set
In our institutional data set of timestamped student course transactions, the unit of analysis or row in this data set represents students enrolling into or dropping classes with a timestamp representing an updated enrollment status. A status token “E” means a student is directly enrolling in a class or enrolling from the waitlist, and the token “D” means a student is dropping a course.
| Timeframe | Fall 2016 - Spring 2022 (18 semesters) |
|---|---|
| Number of transactions | 11,136,719 |
| Number of transactions that affect student status | 10,495,919 (94.2%) |
| Number of transactions initiated by students | 9,457,735 (85.0%) |
| Number of transactions initiated by students and affect student status | 9,141,091 (82.1%) |
| Number of students | 150,887 |
| Number of student-semester pairs | 629,200 |
| Average number of add actions per student per semester | 4.62 |
| Average number of drop actions per student per semester | 3.58 |
| Average number of unique courses enrolled per student per semester | 3.44 |
We preprocess the transaction data to include only actions that affect enrollment status (drop, enroll) and actions that students initiate. Table 1 summarizes descriptive statistics on the transaction data.
2.3 Feature Engineering
2.3.1 Enrollment Periods and Late Drops
There are four main phases of enrollment at UC Berkeley: Phase 2, add-drop period, and late add-drop period. Undergraduates can only enroll in 13.5 units (about three classes) during Phase 1 and 17.5 units during Phase 2. They can add more units during the add-drop period. Phase 1 and Phase 2 happen near the end of the previous semester, while the add-drop period happens from a few days before instruction starts to about four weeks after the instruction begins. A late add-drop period occurs from week 4 to week 8. The late add-drop period is between the add-drop deadline and the late add-drop deadline. The exact dates of these phases vary from Spring vs. Fall semesters (for instance, Phase 1 and Phase 2 are usually longer for fall semesters) and vary from semester to semester. We define late drops as any drop actions that occur during the late add-drop period, which usually involves a student fee.
2.3.2 Procrastination Index
We define procrastination as enrolling or dropping relatively close to the add-drop deadline. Specifically, we calculate the relative time of the student’s action for each enrollment period (Phase 1 enrollment, Phase 2 enrollment, add drop period, late drop period), normalizing it to a range of 0 to 1. Then, we compute the median of the relative time of student action. For our purposes, we define a procrastinator as a student who enrolls or drops later than the median time, representing groups of students with comparatively high and low levels of procrastination. We define three types of procrastination: general procrastination, enroll procrastination, and drop procrastination. Students with high general procrastination have any enrollment action later than the median time. Analogously, enroll procrastinators enroll later than the median time, and drop procrastinators drop later than the media time.
2.3.3 Regularity Index
The regularity index represents the degree to which students exhibited regular course planning activity. The index is defined as the standard deviation of the difference in days between each enrollment action within an enrollment period. It is also divided by the total number of days of the enrollment period as normalization. The larger the regularity index, the more frequently and regularly the student enrolls/drops classes. We calculate the regularity index separately for enroll (E) actions, drop (D) actions, and jointly for both actions pooled. The activity index can not be computed for drops if students had dropped less than two courses before the add-drop deadline, which happened fairly often for drops (29.1% of student semesters) while omitting students for enrolls, as they showed no course planning activity in a given semester (10.0%). For regression modeling, we, therefore, compute a control variable representing whether student semesters included less than two dropped courses before the add-drop deadline. We compute the regularity index for enrolls, drops, and both activities jointly, analogous to the procrastination index (Section 2.3.2).
2.3.4 Course Workload Analytics
Course load analytics can represent a more accurate prediction of students’ workload experiences than credit hours alone by providing course-level estimates of time load, mental effort, and psychological stress based on learning management system and enrollment data [13, 2]. We generate course workload predictions for each course and semester via models trained and validated in prior work [2]. In line with their validation study, predictions were obtained via ensembling an array of machine learning architectures, which proved to have the highest predictive accuracy on a holdout test set. Finally, we use these course workload estimates and each course’s institutional credit hour designation to compute a predicted semester workload and credit hour workload for each student semester through a simple sum of the workloads of all courses the student retained after the add-drop deadline, analogous to [2].
2.4 Analysis Methods
We generate two sets of calculations to explore the trend of adding and dropping throughout the semester for RQ1. We first calculate the average number of courses students enrolls, drops, waitlists, and swaps for each day of the semester. Swaps are actions in which the student drops one class and enrolls in another class. We define day 0 as the day when Phase 1 begins and the last day (which varies by semester) as the late add-drop deadline. Then, to explore the effect of dropping and adding on student enrollment, we calculate the average student basket size for each day of the semester. Basket size is defined as the number of courses students are enrolled in at any given time. To calculate a student’s daily basket size, we keep a running tally of the number of classes students are enrolled in. We note each instance in which a student enrolls in or drops a class daily and accumulate the changes for the day. Because students do not have add/drop activities every day of the semester, we then fill in the missing days by carrying over the previous days.
To answer RQ2, we fit linear mixed models of the number of late-dropped units (see Section 2.3.1) for each student semester using a log-linear link suited for count data. Given that we have repeated measures on the student level across semesters, we use linear mixed models with a random intercept per student to adjust for their baseline frequency of dropping courses late. The model then estimates incidence rate ratios (\(IRRs\)) for each independent variable, representing the relative change in the incidence rate of late dropped course units associated with a one-unit increase in the corresponding predictor while holding other variables constant. For instance, if the \(IRR\) for the procrastination index is 1.5, it indicates that a one-unit increase in the procrastination index is linked to a 50% higher incidence rate of late dropped course units, assuming all other factors are held constant. In practical terms, this implies that higher levels of procrastination, as measured by the index, are associated with an increased likelihood of students late dropping course units. We fit three models, standardizing all independent variables to a mean of 0 and a standard deviation of 1 to ease the interpretation of a per-unit increase, effectively setting the unit to standard deviations.
Specifically, we compare four models through \(BIC\) to investigate the effects of student procrastination and their regularity index on late course drops in a given semester. \(BIC\) is more suited for model comparisons than the likelihood-ratio test given our large sample size of \(629{,}200\) student semesters, which would make the comparison very sensitive to significance while not adjusting for model complexity. The first model features a simple control variable indicating whether students dropped more than one course or not (see Section 2.3.3 for the rationale of this control variable). We then compare that baseline model to a model additionally featuring the procrastination and regularity index of each student semester as the main effects (general activity model). Then, we sequentially replace the procrastination model with two main effects of enrollment and drop procrastination (dual procrastination model) and a model with two additional effects for regularity indices of enrollments and drops (dual procrastination and dual regularity model). These model comparisons serve to inspect whether procrastination and regularity in activity (i) are related to late course drops and (ii) whether their effect depends on activity regarding enrollments compared drops compared to general activity regarding both actions. All data analysis code used for this study is publicly available.3
3. RESULTS
3.1 RQ1: Trends of Course Adding and Dropping
Fig. 1 illustrates the average weekly enrollment activities, including waitlisting, enrollment, dropping, and swapping courses across both spring and fall semesters. Fall semesters notably exhibit an extended Phase 1 compared to spring, with enrollment initially peaking at the phase’s start and sharply declining toward the end. A resurgence occurs at the beginning of Phase 2, followed by a gradual decrease through subsequent add-drop and late add-drop periods.
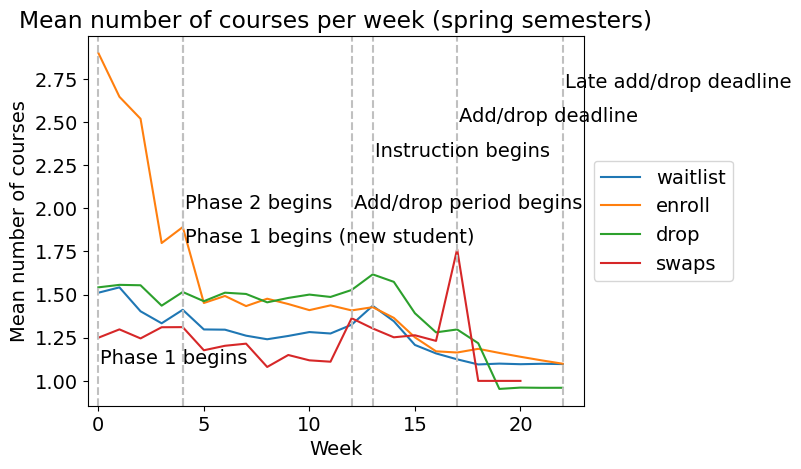
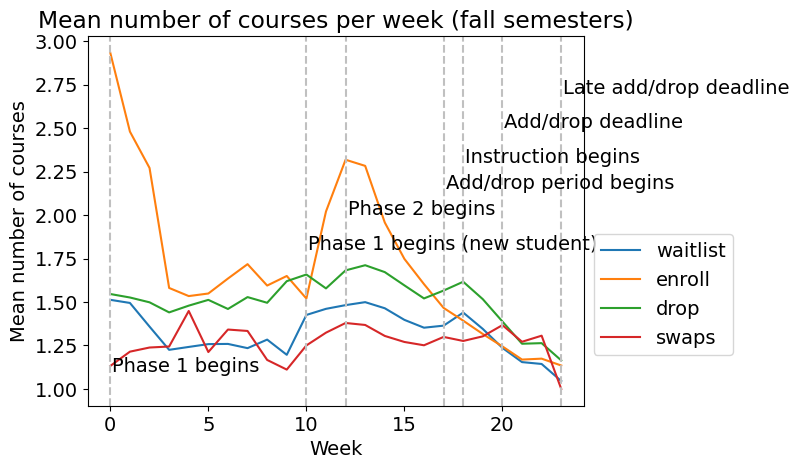
The spike in fall semester enrollment activities is less due to the influx of new undergraduates, a phenomenon less pronounced in spring. This surge extends to waitlist, drop, and swap activities, peaking with the start of Phase 2. Conversely, spring semester drop activities maintain a steady low throughout Phases 1 and 2, rising sharply at the add-drop period’s onset and reaching their peak at the spring semester’s start of instruction. Drop activities consistently outnumber add activities from mid to late Phase 2 and throughout subsequent phases. Waitlists closely mirror drops, reaching their peak when instruction starts. Swaps remain low during initial phases but surge at the spring semester’s add/drop deadline. Across both semesters, enrollment activities respond to major enrollment events and deadlines, with similar patterns observed (however, activities reach their peak at the start of Phase 2 because of new undergraduates joining in the fall). Notably, the most significant fluctuations occur during Phase 1, characterized by a sharp drop in add activities followed by a gradual increase. Furthermore, approximately 52.4% of spring semester add-drop activities occur during Phase 1, covering roughly the first 25% (first 5 weeks) of enrollment phases, while in fall, this proportion is 40.0%, spanning the initial 50% (first 10 weeks). These patterns related to enrollment phases were generally consistent across students of different years of enrollment (years one through four) based on visual inspection of plots.
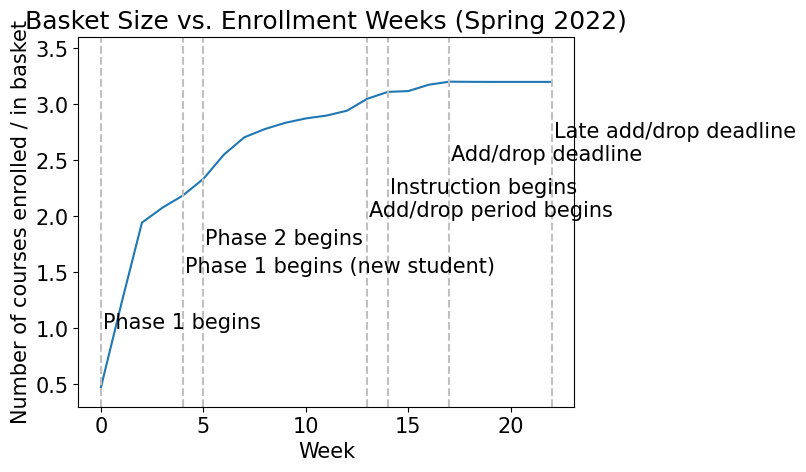
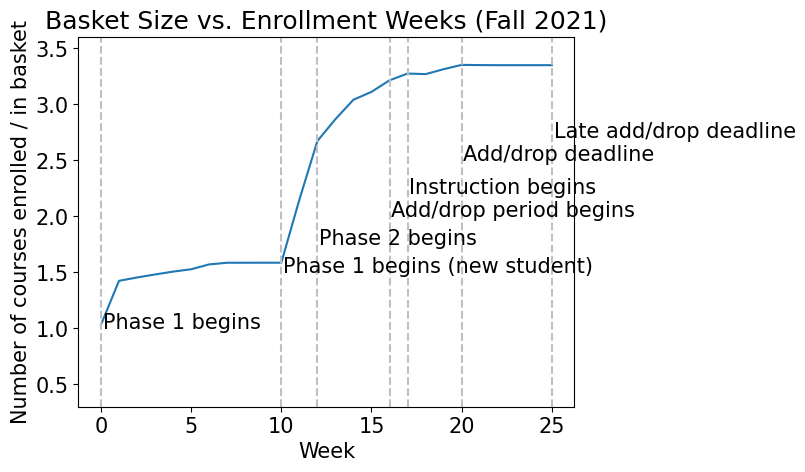
We also explore how student basket size changes throughout the semester, week by week. Analyzing the time series (Fig. 2), which illustrates the average changes in student basket size, we observe fluctuations coinciding with major enrollment deadlines. At the outset of Phase 1, basket sizes surge rapidly for continuing students and spike further as Phase 1 commences for new undergraduates. This surge gradually tapers until the onset of Phase 2, where basket sizes experience a steady increase, punctuated by a minor spike when instruction starts. Subsequently, basket sizes stabilize during the add-drop period. A comparison between spring and fall semesters reveals a prolonged plateau during Phase 1 for fall semesters due to the extended duration of their Phase 1 period. Additionally, a more substantial spike in basket size occurs when new undergraduate students enroll during fall semesters. Comparing the two plots, despite drop activities surpassing add activities at mid-to-late Phase 2, we observe no significant fluctuations in basket size throughout the enrollment period. However, this intersection may be reflected by the varying rates of change in basket size: a larger increase at the start of Phase 2 and a smaller one at the midpoint. Overall, the absence of a decrease in basket size suggests that the rise in dropping actions does not sufficiently counterbalance the decline in enrollment actions, resulting in a net decrease in average basket size.
3.2 RQ2: Relationship Between Procrastination and Late Course Dropping
RQ2 asks about the relationship between procrastination and late course dropping. We found that a model that distinguishes between activity types (enrollments vs. drops) in terms of procrastination but does not distinguish between activity types in terms of activity spread described the data best. Specifically, the dual procrastination model had the lowest \(BIC\) (\(2{,}763{,}638\)) followed by the general activity model (\(BIC = 2{,}771{,}557\)), the baseline (\(BIC = 2{,}935{,}188\)), and the dual regularity model (\(BIC = 3{,}587{,}051\)). We refer to Section 2.4 for model references. The modeling results of the chosen model (i.e., the dual procrastination model) are summarized in Table 2.
| Variable | \(IRR\) | \(CI_{95\%}\) | \(p\) |
|---|---|---|---|
| Intercept | 9.47 | 9.46 – 9.48 | \(<.001\) |
| Dropped More than 1 Course | 0.55 | 0.55 – 0.55 | \(<.001\) |
| Enrolled Later | 1.06 | 1.06 – 1.06 | \(<.001\) |
| Dropped Later | 0.93 | 0.93 – 0.93 | \(<.001\) |
| Higher Spread in Activity | 0.79 | 0.79 – 0.79 | \(<.001\) |
As shown in Table 2, the coefficients derived from the selected model offer insights into the determinants of late dropped units. Notably, the variable “Dropped More than 1 Course” exhibits a coefficient of 0.55, indicating a 45% reduction in the expected incidence rate of late dropped units for students who dropped at least two courses during the add-drop period. Conversely, “Enrolled Later” yields a coefficient of 1.06, signifying a 6% increase in the expected incidence rate for each unit increase in the predictor. “Dropped Later” and “Higher Spread in Activity” contribute coefficients of 0.93 and 0.79, respectively, suggesting a 7% decrease and a 21% decrease in the expected incidence rate per \(SD\) increase in their respective predictors.
3.3 Exploratory Analysis of Activity Across Procrastination Groups
The regression results suggest that students procrastinating on enrollment dropped more courses late. What courses did students with high enrollment procrastination enroll in? Can they point us to course basket characteristics that can explain late dropping beyond the act of procrastination on enrollment itself? To answer these follow-up questions, we conducted an exploratory analysis comparing the overall predicted course load and credit hours for the courses in the baskets of enroll procrastinators vs. non-procrastinators throughout all four phases of enrollment (Fig. 3).
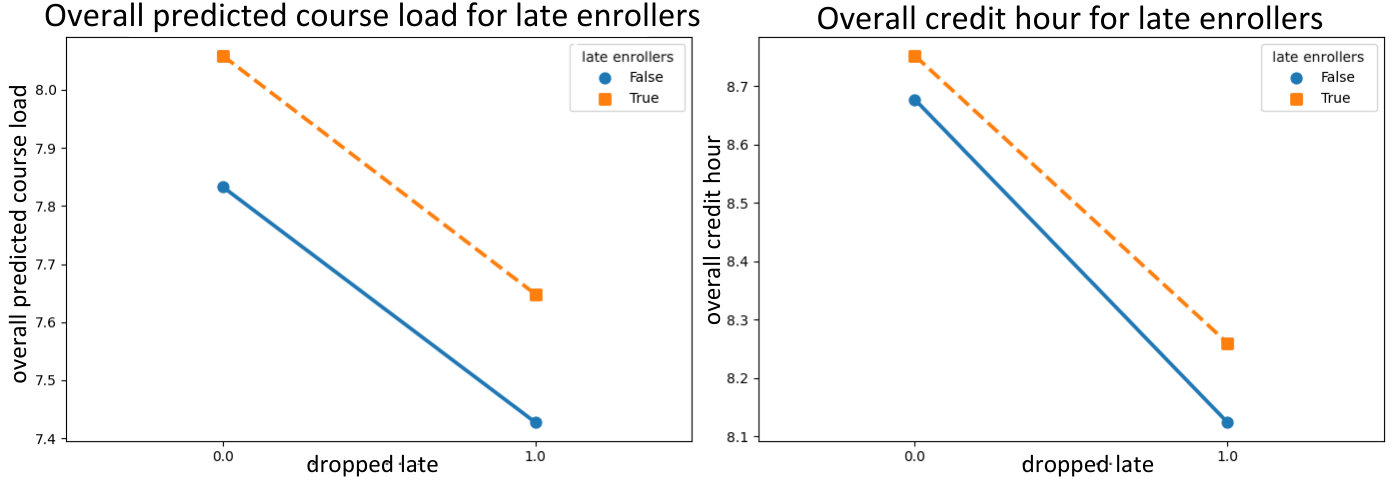
Students with high enrollment procrastination enrolled in higher overall predicted course load and higher credit hours than non-procrastinators. Additionally, students who dropped courses late tend to carry a lower overall course load and lower credit hours. Importantly, there was a smaller difference in the credit hours taken by procrastinators vs. non-procrastinators, while there was a larger difference in the predicted course load. Enrollment procrastinators who dropped courses late took a comparable amount of credit hours (compared to non-procrastinators) when they enrolled but had a higher predicted workload. Employing \(t\)-tests comparing the workload distribution of procrastinators who dropped late (M = 7.65) vs. non-procrastinators (M = 7.43) who dropped late shows there is a statistically significant difference for predicted workload (\(t\)(131785) = 9.38, \(p\) < 0.001, Cohen’s \(d\) = 0.06) and credit hours (\(t\)(131785) = 4.13, \(p\) < 0.001, Cohen’s \(d\) = 0.03), although the effect size for predicted course load was twice as large. These differences in effect sizes were generally consistent across students’ year of study except for Year 4. Effect sizes ranged from \(d\) = 0.01 (Semester 4) to \(d\) = 0.16 (Semester 3) for predicted workload and from \(d\) = -0.06 (Semester 4) to \(d\) = 0.09 (Semester 3) for credit hours. Notably, compared with non-procrastinators (M = 2.97), enroll procrastinators were more likely to late drop courses (around 9% more likely), \(t\)(168371) = 10.9, \(p\) < 0.001, Cohen’s \(d\) = 0.15). In sum, late enrollers were more likely to take on more credit hours and especially more predicted workload than early enrollers and were more likely to drop courses late.
4. DISCUSSION
The present study has investigated how detailed transaction data of student course adds and drops can reveal patterns in how students plan for their academic semester and elevated insights into how these patterns relate to late drops, an undesirable outcome of student course planning. Procrastination and course shopping are well-known concepts in higher education research but have not been studied through detailed transaction records. We discuss three main contributions.
Our first contribution relates to the general documentation of student course add and drop behavior in relationship to institutional deadlines. Nearly half (46.1%) of add and drop activities occur during Phase 1 during the spring semester, spanning approximately the first quarter to half of the enrollment period. A similar pattern was observed for the fall semester, with the first 50% (10 weeks) of enrollment phases covering 40% of activity. During this phase, significant fluctuations in enrollment activities are observed, stabilizing in later phases. Unlike enrollment activities, which peak at Phase 1’s onset, drop and waitlist activities peak at instruction commencement, while swap activities peak at the add/drop deadline. Notably, patterns in basket size changes emerge between spring and fall semesters, reflecting responses to varying enrollment events and add/drop activity changes. These observed patterns can guide institutions in allocating academic advising resources, potentially enhancing nascent course recommendation systems [9]. Moreover, they prompt exploration into the types of courses students enroll in early versus late and their subsequent behaviors. Understanding the course attributes linked to these enrollment patterns—such as popularity, prerequisite satisfaction, and course-level GPA—can provide valuable insights for academic advising and student success initiatives.
As our second contribution, studying how procrastination relates to late dropped units (RQ2), we delineated enrollment procrastination and irregular academic planning as being associated with late course dropping. Further, dropping courses before the add-drop period was associated with less late dropping. In other words, students who dropped late generally tended to stick to courses more before the add-drop deadline. This finding aligns with a theoretical model where students mismanage their course planning by overloading on too many courses before the add-drop deadline, after which they must drop a course late. Future work could further investigate this resource model [7] by correlating the total semester load of students with their late drops. One potential psychological reason for students sticking to courses despite an excessive workload is loss aversion, where dropping a course and losing the opportunity to take it weighs more heavily than enrolling in a course, making students inclined to overenroll [5]. Further, we found that students who regularly plan to add and drop courses dropped fewer courses late. This aligns with past work that has found related findings where the sequentiality and regularity of student campus behaviors were associated with academic performance [20]. Regularity in behavior could be potentially explained by an underlying trait of conscientiousness, which prior work has associated with a moderator of individuals’ ability to follow through with plans and intentions (e.g., preparing for the semester early; [12]). Future work could further investigate these student-level differences related to their planning regularity to elucidate this effect more.
As our third contribution, we found that students who procrastinated on enrollment also enrolled with higher semester loads overall, not only in credit hours but especially in predicted workload. In other words, students with high levels of procrastination not only enrolled in larger course workloads based on credit hours but even more so in more difficult courses with higher effective workloads. While our RQ2 results speak to student-level procrastination as a correlate of late drop outcomes, our workload analysis suggests that late dropping might also an attribute of a resulting student course basket. Both factors might also work together, where procrastinators are ill-informed about the workload of a course (which prior work linked to course shopping [17]) and how much work they can take on, leading to late drops. This aligns with prior work linking excessive workload to adverse academic outcomes [2]. As an alternative interpretation to these high workloads representing mismanaged academic planning, it could be that high-workload courses tend to be the only courses that have leftover seats for students at the end of the enrollment period, hence forcing students to enroll in them, which could have potential ramifications for institutional policies on course seat allocation For example, it could be that these courses generally have more prerequisites than others (which correlates with effective course workload [13]), such that late enrollers tend to be more underprepared, which is undesirable from an institutional standpoint if they end up dropping these courses late more often. Future work could test these causal theories of why enrollment procrastinators overenroll and its relationship to other academic outcomes (i.e., GPA).
How can students who enroll late and over-enroll be supported? A fruitful avenue for future work is to devise academic planning interventions that support students in planning their semester more early on and more regularly. Our results suggest that such interventions could mitigate some of the adverse outcomes of procrastination in higher education, for example, self-efficacy [21] and lower academic performance measured in GPA [10]. Indeed, past work has suggested that ill-sized goals at the beginning of the semester can lead to a vicious cycle of low self-efficacy and goal achievement [21], a hypothesis such interventions could investigate further. Nascent course recommender systems that run on enrollment data could support students in devising academic plans more regularly and early while also monitoring for course load expressed in analytics [9, 2]. However, more work is needed if such systems can alleviate student procrastination on enrollments and have the desired downstream effect on workload and subsequent academic outcomes.
4.1 Limitations and Future Work
We see three limitations to the present study that guide future work. First, the present study’s findings were constrained to one higher education institution. Future work could develop a standardized taxonomy and way of analyzing course transactions in relationship to add-drop and drop deadlines to create predictive modelings of academic outcomes that generalize across institutions. Second, the present study has looked at late drops as one form of student academic outcomes. However, transaction data and the features present in the present study could be used to model other, more distal adverse academic outcomes, such as GPA and on-time graduation. In line with the prior work on predicting student outcomes in EDM [9], our features could be used in recommender systems or forecast models that support higher education students. However, we highlight the merit of straightforward linear regression models used in this study for retaining linear interpretations of associations between procrastination and late drops. Third, the present study has investigated adds and drops as features representing student course transaction activity. Still, future work can gain insight into student course selection by looking into more diverse and fine-grain features mined from these records. For example, course swaps between courses with relatively high and low workloads or substituting a required course for an elective course could have distinct signals for student outcomes, including late drops.
5. CONCLUSION
The present study has investigated how records of student academic planning encoding in timestamped add and drop transaction records can explain student mismanagement during academic planning represented in late drops. Documenting students’ general course planning patterns, we found 25-50% of course enrollment activity to happen during the first 5-10 weeks following the Phase 1 enrollment period. Further, we found that students who enrolled in courses late were likelier to drop classes late. This relationship could be explained by these students’ overloading course load, especially more difficult courses, as represented in machine-learned course workload predictions. These findings suggest that academic planning support, for example, delivered through course recommender systems, could help students plan earlier and select more appropriate course sets, potentially mitigating the adverse effect of procrastination on academic outcomes. Overall, transaction data offer various avenues for educational data mining to study the process through which students arrive at course sets during their academic semester that are more or less suited for them, opening the door for prediction, intervention, and collaboration with educational practitioners and policymakers seeking to enhance student success and retention in academic settings.
6. REFERENCES
- R. Baker, D. Xu, J. Park, R. Yu, Q. Li, B. Cung, C. Fischer, F. Rodriguez, M. Warschauer, and P. Smyth. The benefits and caveats of using clickstream data to understand student self-regulatory behaviors: opening the black box of learning processes. International Journal of Educational Technology in Higher Education, 17(1):1–24, 2020.
- C. Borchers and Z. A. Pardos. Insights into undergraduate pathways using course load analytics. In LAK23: 13th International Learning Analytics and Knowledge Conference, pages 219–229, 2023.
- S. H. Cormack, L. A. Eagle, and M. S. Davies. A large-scale test of the relationship between procrastination and performance using learning analytics. Assessment & Evaluation in Higher Education, 45(7):1046–1059, 2020.
- C. Fischer, Z. A. Pardos, R. S. Baker, J. J. Williams, P. Smyth, R. Yu, S. Slater, R. Baker, and M. Warschauer. Mining big data in education: Affordances and challenges. Review of Research in Education, 44(1):130–160, 2020.
- D. Gal and D. D. Rucker. The loss of loss aversion: Will it loom larger than its gain? Journal of Consumer Psychology, 28(3):497–516, 2018.
- L. S. Hagedorn, W. E. Maxwell, S. Cypers, H. S. Moon, and J. Lester. Course shopping in urban community colleges: An analysis of student drop and add activities. The Journal of Higher Education, 78(4):464–485, 2007.
- N. Huntington-Klein and A. Gill. Semester course load and student performance. Research in Higher Education, 62(5):623–650, 2021.
- W. Jiang and Z. A. Pardos. Evaluating sources of course information and models of representation on a variety of institutional prediction tasks. International Educational Data Mining Society, 2020.
- W. Jiang, Z. A. Pardos, and Q. Wei. Goal-based course recommendation. In Proceedings of the 9th international conference on learning analytics & knowledge, pages 36–45, 2019.
- K. R. Kim and E. H. Seo. The relationship between procrastination and academic performance: A meta-analysis. Personality and Individual Differences, 82:26–33, 2015.
- E. Lenchner. Mining Transactional Student-Level Data to Predict Community College Student Outcomes. Columbia University, 2017.
- S. Lippke, S. Pomp, and L. Fleig. Rehabilitants’ conscientiousness as a moderator of the intention–planning-behavior chain. Rehabilitation Psychology, 63(3):460, 2018.
- Z. A. Pardos, C. Borchers, and R. Yu. Credit hours is not enough: Explaining undergraduate perceptions of course workload using lms records. The Internet and Higher Education, 56:100882, 2023.
- Z. A. Pardos, Z. Fan, and W. Jiang. Connectionist recommendation in the wild: on the utility and scrutability of neural networks for personalized course guidance. User modeling and user-adapted interaction, 29:487–525, 2019.
- S. Sabnis, R. Yu, and R. F. Kizilcec. Large-scale student data reveal sociodemographic gaps in procrastination behavior. In Proceedings of the Ninth ACM Conference on Learning@ Scale, pages 133–141, 2022.
- A. Scheunemann, T. Schnettler, J. Bobe, S. Fries, and C. Grunschel. A longitudinal analysis of the reciprocal relationship between academic procrastination, study satisfaction, and dropout intentions in higher education. European Journal of Psychology of Education, 37(4):1141–1164, 2022.
- M. Scott and D. A. Savage. Lemons in the university: asymmetric information, academic shopping and subject selection. Higher Education Research & Development, 41(4):1247–1261, 2022.
- E. Shao, S. Guo, and Z. A. Pardos. Degree planning with plan-bert: Multi-semester recommendation using future courses of interest. In Proceedings of the AAAI Conference on Artificial Intelligence, volume 35, pages 14920–14929, 2021.
- B. W. Tuckman. The development and concurrent validity of the procrastination scale. Educational and psychological measurement, 51(2):473–480, 1991.
- X. Wang, X. Yu, L. Guo, F. Liu, and L. Xu. Student performance prediction with short-term sequential campus behaviors. Information, 11(4):201, 2020.
- K. Wäschle, A. Allgaier, A. Lachner, S. Fink, and M. Nückles. Procrastination and self-efficacy: Tracing vicious and virtuous circles in self-regulated learning. Learning and instruction, 29:103–114, 2014.
- Y. Xu and Z. A. Pardos. Mining detailed course transaction records for semantic information. International Educational Data Mining Society, 2023.