ABSTRACT
There is less attention on examining algorithmic fairness in secondary education dropout predictions. Also, the inclusion of protected attributes in machine learning models remains a subject of debate. This study delves into the use of machine learning models for predicting high school dropouts, focusing on the role of protected attributes like gender and race/ethnicity. Utilizing a comprehensive national dataset, we critically evaluate the predictive performance and algorithmic fairness of these models via the novel Differential Algorithmic Functioning (DAF) method. Our results show that the impact of protected attributes on predictions varies, displaying model-specific biases across different threshold ranges. It suggests that researchers should not only evaluate but also document the safe (bias-free) threshold range of their predictive models. Furthermore, it recommends that the decision to include or exclude protected attributes should be based on their effect on predictive performance, algorithmic fairness, and practical model deployment considerations. The findings offer significant insights for educational policymakers and researchers in the development of fair and effective predictive models.
Keywords
1. INTRODUCTION
The future prosperity of a society is strongly linked to the educational attainment of its members. Yet, one of the pressing challenges faced by the education sector in the U.S. is the high rate of high school dropouts. A report from National Center for Educational Statistics (NCES) shows that the overall status dropout rate is 5.2 percent in 2021, which means almost 2 million students between the age of 16 and 24 were not enrolled in high school and had not earned a high school credentials or the equivalent such as GED [1]. In 2016, 4.7 percent of the 11.1 million 15- to 24-year-olds enrolled in grades 10 through 12 left school without obtaining a high school credential [20]. This phenomenon not only dampens individual potential but also undermines social cohesiveness and economic progress. A full-time, year-round worker without a high school diploma earns only 0.7 times the average earnings of high school graduates [9]. In addition, dropping out of high school also demonstrated large effect on adult crimes [7, 10]. Therefore, proactive identification of students at risk of dropping out can lead to timely interventions, potentially altering the course of their educational journey.
The application of machine learning techniques, capable of processing large and complex datasets, holds promise in this regard. Various machine learning models have been investigated on this topic. For example, Baker and colleagues[3] employed the logistic regression (LR) method on the information collected from overall 9th grade to predict the dropouts for 10 to 12 grades. Hickman et al. [12] used the same method to investigate the predicting efficacy of attentional biases and initial grade point average (GPA) for high-school dropouts. Besides, more advanced models, e.g., support vector machine (SVM), random forest (RF), gradient boosted tree (GBT), extreme gradient boosting (XGB), and neural network(NN), are explored as well [14, 24, 18, 8]. However, less attention has been paid on the algorithmic fairness.
The fundamental concept of algorithmic fairness is that machine learning algorithm should impartially treat individuals and avoid discrimination based on sensitive characteristics (also known as protected attributes, terms used interchangeably) such as age, sex, sexual orientation, race/ethnicity, etc. [28]. To build a predictive model without examining its fairness is to implicitly assume that the model is free from bias. Nonetheless, the biases might be already encoded in dataset sent for fitting and testing the models due to the measurements with differential item functioning, historical decision bias, and so forth [22, 6, 2]. For example, Peassach and Shmueli [22] argued that unprivileged group with SAT score of around 1100 performs as well as privileged examinees with score of approximate 1400 for future career success. Directly using the SAT scores as screening method during the hiring process will disadvantage the underrepresented candidates with higher potential.
The integration of protected attributes into predictive models, particularly due to concerns about inheriting historical prejudice, has been a contentious issue for years. Research has shown that including these characteristics, a concept known as “fairness through awareness,” can enhance the fairness of educational tasks. This has been evidenced in areas such as admission decisions [15, 30]. Conversely, Shum [25] argues that including these attributes may unfairly burden students with the legacy of historically disadvantaged patterns, especially when they have already demonstrated potential by securing university admission. Notably, while numerous studies have focused on higher education, there is a dearth of research examining algorithmic fairness in secondary education dropout predictions. To address this gap and the ongoing controversy regarding the inclusion of sensitive characteristics in machine learning models, this study aims to compare the predictive performance of various algorithms in identifying at-risk students. Additionally, we explore algorithmic fairness in selected models using a novel approach known as Differential Algorithmic Functioning [27]. The research questions are:
- 1)
- Does a machine learning model inevitably introduce bias in predicting high school dropouts?
- 2)
- In what ways does the inclusion or exclusion of protected attributes affect the predictive performance of the model?
- 3)
- How does the inclusion or exclusion of protected attributes impact the algorithmic fairness of the model?
In developing the research framework for this study, we revisit and adapt two questions from Yu and colleagues [30] as the second and third research question.
| Variable | Description | Role |
|---|---|---|
| X4EVERDROP | If the respondent ever dropped out of high school. | Outcome |
| X1STAGE | Student’s Age, generated by subtracting the variable X1STDOB from 2009. | Predictor |
| X1CONTROL | School as a Public, Catholic, or Private School. | Predictor |
| X1SES_U | Socio-economic status composite derived with locale (urbanicity) | Predictor/ Fair attribute |
| X1SCHOOLENG | Scale of student’s school engagement | Predictor/ Fair attribute |
| X1SCHOOLBEL | Scale of student’s sense of school belonging | Predictor |
| X1SCHOOLCLI | Scale of administrator’s assessment of school climate | Predictor |
| X1TXMTSCOR | Mathematics standardized theta score | Predictor |
| X1REGION | School geographic region | Predictor |
| X1MTHID | Scale of student’s mathematics identity | Predictor |
| X1MTHUTI | Scale of student’s mathematics utility | Predictor |
| X1MTHEFF | Scale of student’s mathematics self-efficacy | Predictor |
| X1MTHINT | Scale of student’s interest in fall 2009 math course | Predictor |
| X1SCIID | Scale of student’s science identity | Predictor |
| X1SCIUTI | Scale of student’s science utility | Predictor |
| X1SCIEFF | Scale of student’s science self-efficacy | Predictor |
| X1SCIINT | Scale of student’s interest in fall 2009 science course | Predictor |
| X1PAREDEXPCT | How far in school parent thinks 9th grader will go | Predictor |
| X1STUEDEXPCT | How far in school 9th grader thinks he/she will get | Predictor |
| X1PROBLEM | Scale of problems at high school, generated based on X2PROBLEM | Predictor |
| S1MSCORE | Weighted score for self-reported highest math course in 8th grade | Predictor/ Fair attribute |
| X1SEX | Student’s gender | Predictor/ Protected attribute |
| X1RACE | Student’s race/ethnicity | Predictor/ Protected attribute |
2. DATA AND VARIABLES
2.1 Data
To ensure the reproducibility1, our study uses the public dataset of High School Longitudinal Study of 2009 (HSLS:09). HSLS:09 is a nationally representative, longitudinal study of more than 21,000 ninth graders in 944 schools who were followed through their secondary and postsecondary years [21]. It collected data from students, their parents, math and science teachers, school administrators, school counselors, and transcripts. Although a few variables are collapsed due to restriction, such as the state location and the components of school climates, the public available information are sufficient for us to build the predicting models.
2.2 Outcome Variable
HSLS:09 provides two variables about 2009 cohorts’ dropout status. We have selected X4EVERDROP as the outcome variable, which is assigned a value of 1 to indicate instances where a student has ever dropped out of high school. It is an updated version of the identical variable X3EVERDROP created in previous survey round. After removing the non-response and missing observations in this outcome variable, the overall sample size has changed from 23,503 to 17,332. The dataset exhibits an imbalance, as evidenced by the ratio of positive cases (students who have dropped out of high school) to negative cases (students who have not dropped out), which stands at 2714:14618, or approximately 0.186:1. This disproportionate representation can significantly skew the performance of many machine learning models, leading them to disproportionately weigh the majority class (students who have not dropped out). Consequently, this imbalance could result in overoptimistic outcomes and render accuracy a less reliable metric. For instance, a model might achieve an ostensibly high accuracy rate (around 85% in this case) by predominantly predicting the majority class, thereby overlooking the nuances and complexities associated with the minority class (students who have dropped out).
In response to the identified issue of data imbalance, this study implements the Synthetic Minority Oversampling Technique (SMOTE) and its variants [5, 11] to oversample the minority class before training LR, RF, and XGB models. Additionally, when utilizing SVM and NN models, the approach involves assigning additional weight to the minority class to ensure a more balanced representation and learning process.
2.3 Predictors
Since dropping out of school could happen at each grade (from 9 to 12), we choose student-, family-, and school-level predictors collected at the first semester of respondents’ 9th grade, i.e., the first round of HSLS:09 survey [23, 16, 3, 4, 17]. The student-level covariates focus on demographic information, middle school math achievement, self-expectation for future academic achievement, school engagement and belonging, and student’s attitude towards math and science (like interests, utility, self-efficacy, etc.). One of the two family-level covariates is a composite variable called X1SES_U, which was constructed by HSLS:09 from family-income, parent’s occupation and education, and family location [13]. Another one is parent’s expectation for student’s future academic achievement. The school level predictors are about school type (public or private/catholic), region, school climate, and school problem.
One should notice that the first round of HSLS:09 survey did not provide a variable about school problem, which was created at the second round, i.e., X2PROBLEM. This study fits a linear regression model on X2PROBLEM and its indicators and then apply this model to generate an indicator reflecting the school problem at the beginning of 9th grade. The overall model explains 93.82% variance in the target, with \(R^2 = 0.9382\), \(F(5,13469) = 40850\), and \(p < 0.001\).
Protected attributes, such as age, gender, and religion, are characteristics that should not be used as a basis for discrimination or decision-making. In this study, due to data availability, we specifically focus on gender and race/ethnicity as protected variables. Instead of categorizing socioeconomic status (SES) as a protected attribute, we treat it as a variable to be controlled, known as a fair attribute [27], in our evaluation of algorithmic fairness. This approach is justified by the strong predictive power of SES in identifying students at risk. By controlling for SES and other fair variables, we aim to ensure that the machine learning methods provide equitable predictions for students within each specific SES group. Table 1 provides detailed information on all 22 variables.
3. METHOD
3.1 Data Imputation and Augmentation
In the feature engineering phase, we divide the cleaned dataset into training and testing subsets at an 80% to 20% ratio. To address missing values in all predictors, we utilized the predictive mean matching method [29], performing the imputation separately on each subset to prevent data leakage. This precaution helps avoid overly optimistic and misleading conclusions by ensuring that the models being fitted do not have access to information from the testing set. All machine learning models are trained on the same dataset to facilitate a fair comparison of their performance. Specifically, the NN model was trained using 80% of the training data, with the remaining 20% used for validation. Furthermore, SMOTE is a promising choice to enhance the model performance on imbalanced data, since it generates synthetic samples by selecting one or more of the k-nearest neighbors for each example in the minority class, then perturbing these samples by random amounts along the line segments between them [5]. In this study, we applied the Borderline-SMOTE [11] method on the training dataset for more effective oversampling accuracy.
3.2 Models
This study employs various machine learning models spanning a range from simplicity and interpretability to complexity and predictive power. LR serves as a baseline model due to its simplicity and interpretability. To challenge this baseline, we use the RF, recognized for its robustness and handling of large, high-dimensional datasets; XGB, an advanced technique known for minimizing bias and variance; SVM, known for effective separation for data with clear margin especially in high-dimensional spaces. In addition, We utilize a NN model comprising three hidden layers with 32, 16, and 8 neurons, respectively because of its capability of identifying complex patterns in large datasets. We run all models on both aware models (i.e., model including the protected attributes) and blind models (i.e., models without the protected attributes) [30]. Through comparative analysis, we aim to identify the most effective model for predicting high school dropouts, and then evaluate algorithm fairness.
3.3 Metrics for Predicting Performance
We employ multiple metrics due to the inherent class imbalance in our dataset. While accuracy alone can be misleading, we also consider sensitivity (or recall, terms used interchangeably), which assesses the model’s ability to correctly identify positive cases (i.e., actual dropouts). Additionally, we examine specificity, which measures the model’s success in correctly identifying negative cases. Aiming for high sensitivity is crucial to detect as many true at-risk students as possible. However, this often comes at the expense of lower specificity, highlighting a common trade-off in model performance. Moreover, precision is evaluated to determine the proportion of correctly identified positive cases.
To balance the trade-off between precision and recall, we introduce the F-beta score as a key metric. F-beta score is a weighted harmonic means of precision and recall and provides a singular metric that considers both aspects. Given the significant consequences of failing to identify students at risk, we select a beta value of 2 for the F-beta score, emphasizing the importance of recall while still considering precision. Unless otherwise specified, sensitivity, specificity, precision, and F-beta scores are calculated using a 0.5 probability threshold.
The Area Under the Receiver Operating Characteristic Curve (AUC) provides an overarching evaluation of a model’s discriminative performance across various thresholds. While there is no universally accepted benchmark for a “good” AUC, it is generally expected that a model should achieve an AUC score above 0.5 at least. Sansone [24] conducted a similar study on dropout prediction using the same HSLS:09 dataset, incorporating information from the entire 9th grade and applying various machine learning methods grounded in econometric theory. In this context, Sansone’s achievement of an AUC around 0.78 will be used as a benchmark for comparison in our study.
3.4 Measures for Algorithmic Fairness
Suk and Han [27] identify four prevalent metrics for assessing algorithmic fairness: statistical parity, conditional statistical parity, separation, and sufficiency. Statistical parity, also known as demographic parity or disparate impact, necessitates that an algorithm’s decisions are not influenced by protected group membership. In this current study, it can imply that a machine learning model should yield comparable results in identifying potential dropouts among both white and black students. However, statistical parity does not consider certain confounders, such as SES and prior academic achievement. For example, expecting identical prediction outcomes for students from historically underrepresented groups with higher SES and stronger academic backgrounds, as compared to privileged groups with lower SES and weaker academic potential, may not be reasonable. This is where conditional statistical parity (CSP) becomes relevant. CSP mitigates the limitations of statistical parity by considering legitimate risk factors, such as SES and previous academic performance.
| Metrics | LR | RF | XGB | SVM | NN |
|---|---|---|---|---|---|
| AUC | 0.713 | 0.764 | 0.758 | 0.788 | 0.786 |
| Sensitivity | 0.490 | 0.374 | 0.486 | 0.711 | 0.724 |
| Specificity | 0.781 | 0.909 | 0.844 | 0.720 | 0.715 |
| Precision | 0.294 | 0.432 | 0.367 | 0.320 | 0.321 |
| F-beta | 0.432 | 0.384 | 0.456 | 0.571 | 0.579 |
| Accuracy | 0.736 | 0.825 | 0.788 | 0.718 | 0.717 |
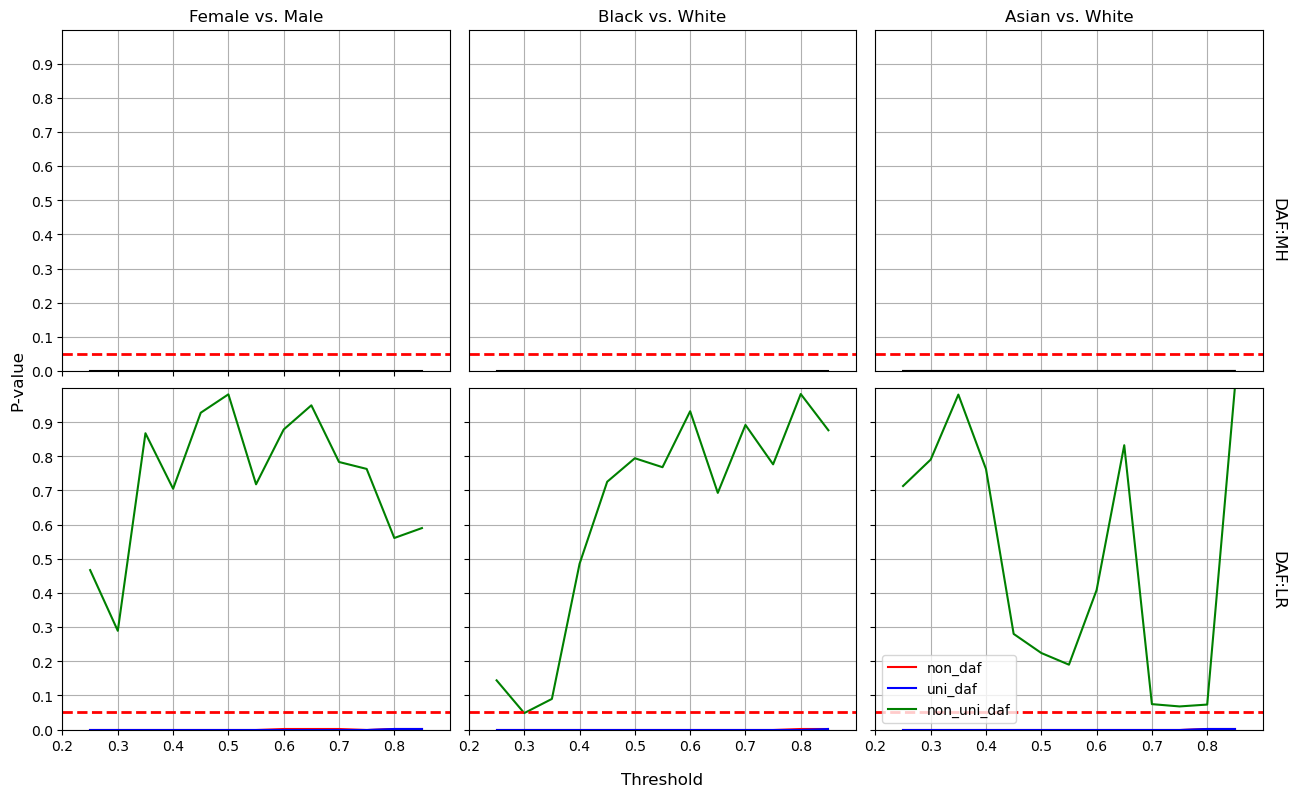
Drawing inspiration from the concept of CSP and Differential Item Functioning (DIF) from psychometrics, Suk and Han [27] have defined Differential Algorithmic Functioning (DAF). DAF is a method to identify discriminatory decisions made by algorithms based on protected variables, while controlling for fair attributes, which are a set of legitimate risk factors. Uniform DAF occurs when a model consistently makes favorable decisions for one group across the entire spectrum of fair attributes. On the other hand, non-uniform DAF describes a scenario where the model’s decisions may favor one group at certain levels of fair attributes, but another group at different levels. Therefore, DAF is a crucial metric for assessing algorithmic fairness in this study. It is identified using the Mantel-Haenszel (MH) test and logistic regression (LR) methods, as detailed by Suk and Han (refer to section 4.1 and 4.2 of the paper for more information) [27]. It should be noted that, unlike the MH method, which detects only the DAF, the LR method can additionally identify both uniform and non-uniform DAF, as illustrated in Figures 3 through 6.
4. RESULTS
4.1 Predictive Performance
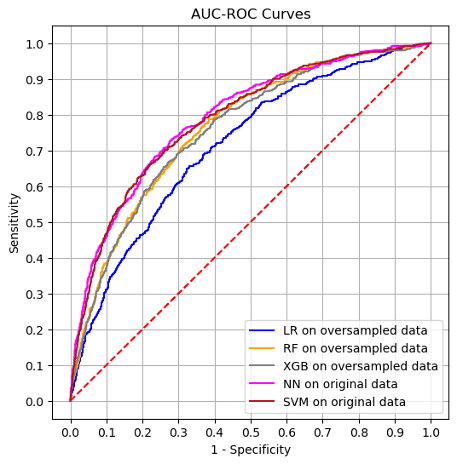
The comparative analysis of various aware machine learning models (i.e., protected attributes are included) for predicting high school dropouts yields insightful results across multiple performance metrics; see Table 2. The AUC scores reveal that SVM (0.788) and NN (0.786) models exhibit the highest capability in distinguishing between the dropout and non-dropout classes, closely followed by RF (0.764), XGB (0.758), and LR (0.713). Although all AUC scores fall in the range of 0.7~0.8 demonstrating a good discriminating performance, the SVM and NN outperform the others at various threshold values as shown in Figure 1. The sensitivity score, as a crucial metric in this study, indicates the superior ability of NN model with the highest value of 0.724 in correctly identifying actual dropout cases.
In addition, we set beta to be 2 for the F-beta score to place a greater emphasis on the sensitivity comparing to precision, suggesting that false negatives are considered more detrimental than false positives. The results present that the SVM model achieved an F-beta score of 0.571, while the NN model exhibits a marginally higher score of 0.579, which demonstrates a slightly better balance of precision and recall. In terms of overall accuracy, RF outperforms other models with a score of 0.825, followed by XGB (0.788). However, considering the specific focus on detecting the true potential at-risk students for this study, the lowest sensitivity score excludes the RF from our target models.
To simplify the further comparative analysis on algorithm fairness, we select the LR as baseline model and compare it with NN model since NN exhibits a stronger balance between sensitivity and precision as reflected in its F-beta score, despite a slight compromise in specificity and overall accuracy.
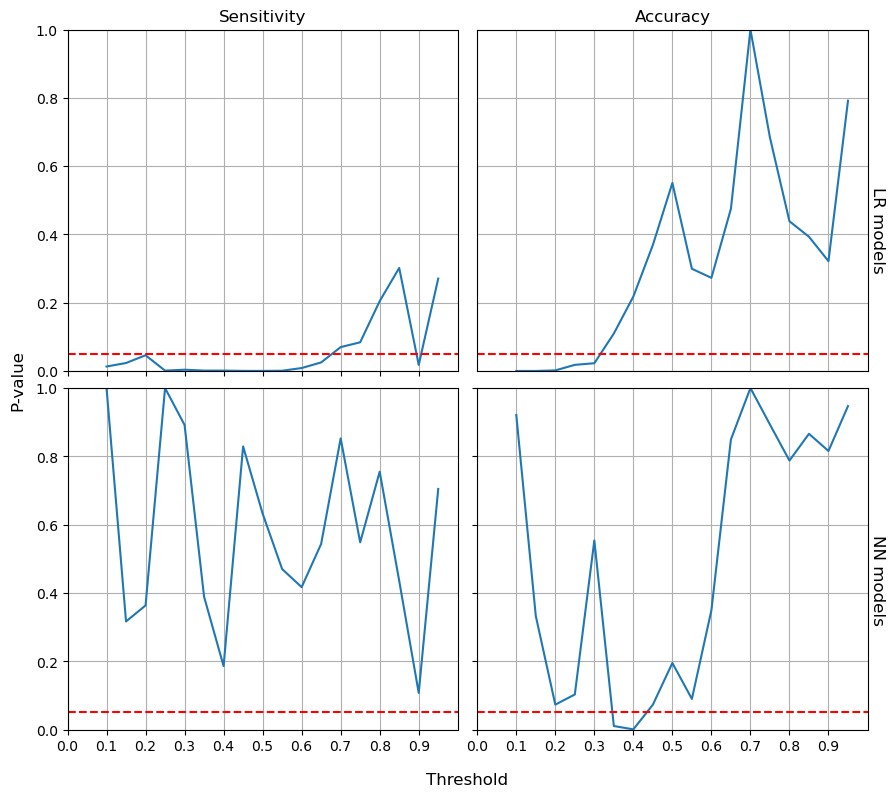
Next, we remove the protected variables (i.e., the gender and race/ethnicity) from the models and keep them blind. As shown in Table 3, there are no notable changes in all metrics except for the LR model. More specifically, we employ the proportion Z-test to respectively compare the values of sensitivity and accuracy before and after removing the protected attributes for baseline LR model and NN model across the range of threshold from 0.1 to 0.9. The results reveal that there is no significant difference on sensitivity from the blind and aware NN models as shown at bottom-left of Figure 2. The red dashed line represents the significance level of 0.05. P-values below this line indicate significant difference. In contrast, the significantly different sensitivity can be found on LR model below 0.68 threshold. In terms of accuracy, the significant difference is at narrow range of 0.35 to 0.44 for NN models and below 0.31 for LR.
| Metrics | LR | RF | XGB | SVM | NN |
|---|---|---|---|---|---|
| AUC | 0.744 | 0.765 | 0.752 | 0.789 | 0.787 |
| Sensitivity | 0.604 | 0.401 | 0.479 | 0.716 | 0.737 |
| Specificity | 0.753 | 0.900 | 0.837 | 0.718 | 0.696 |
| Precision | 0.312 | 0.427 | 0.353 | 0.321 | 0.311 |
| F-beta | 0.509 | 0.406 | 0.447 | 0.575 | 0.579 |
| Accuracy | 0.729 | 0.822 | 0.781 | 0.718 | 0.703 |
Therefore, this evidence supports that the effect of including protected attributes on predictive performance depends on the models and selected thresholds. For example, at 0.50 threshold, removing the protected variables has no significant influence on NN model’s sensitivity and accuracy but can significantly increase the recall for the logistic regression model.
4.2 Algorithm Fairness
This study concentrates on detecting Differential Algorithmic Functioning (DAF), as previously discussed, which serves as an alternative indicator of conditional statistical disparity. This is because DAF reflects the conditional relationship between dropout status and protected group membership, accounting for fair attributes. Specifically, we anticipate that the algorithms should demonstrate equivalent predictive performance for students at risk across different protected groups, such as gender and race/ethnicity, when fair attributes are controlled. For this purpose, the study identifies fair attributes from three critical dimensions commonly associated with predicting high school dropout: academic performance, attendance, and socioeconomic [23, 16, 3]. These are represented by 8th grade math achievement, high school engagement, and SES, respectively.
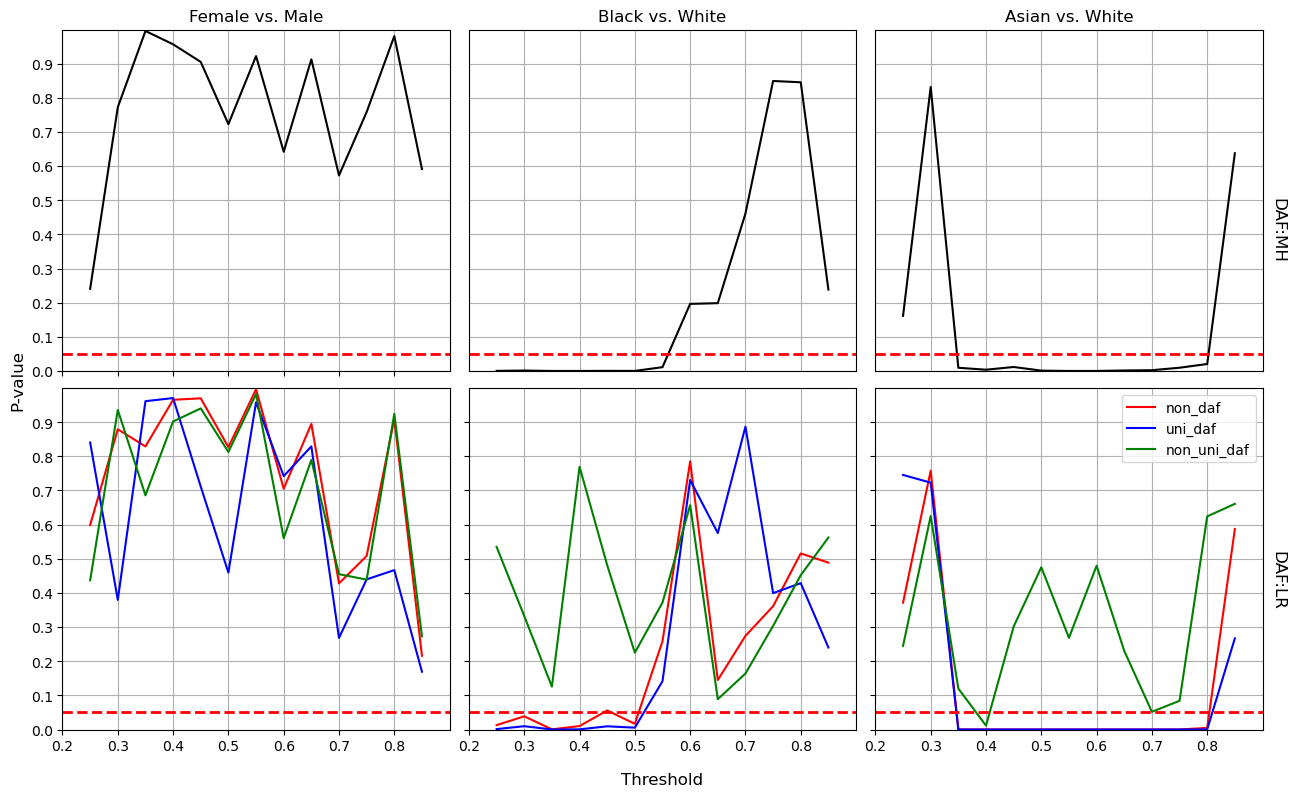
The red dashed lines in Figure 3 represents the significance level of 0.05. The curve under the dashed lines is a sign of DAF since chi-square test and likelihood ratio test are used for MH and LR methods respectively [27]. These two techniques reveal similar tendency in detecting the DAF when comparing the black curves in the up three plots with red curves in the bottom plots. We compare the DAF on three groups: Female versus Male, Black versus White, and Asian versus White. In terms of algorithmic fairness regarding gender, the aware NN model demonstrates equitable dropout detection across all examined thresholds (ranging from 0.25 to 0.90), as shown at bottom left in Figure 3. However, disparities emerge in the aware NN model’s outcomes between Black and White students at thresholds below approximately 0.51. Additionally, bias is observed when comparing Asian to White students, particularly within the threshold range of 0.35 to 0.80. In contrast, the aware LR model exhibits consistent prediction bias across all thresholds, as detailed in Figure 5. Considering both predictive power and relative algorithmic fairness, the NN model is recommended for identifying high school dropouts, provided it is applied within the identified safe threshold range.
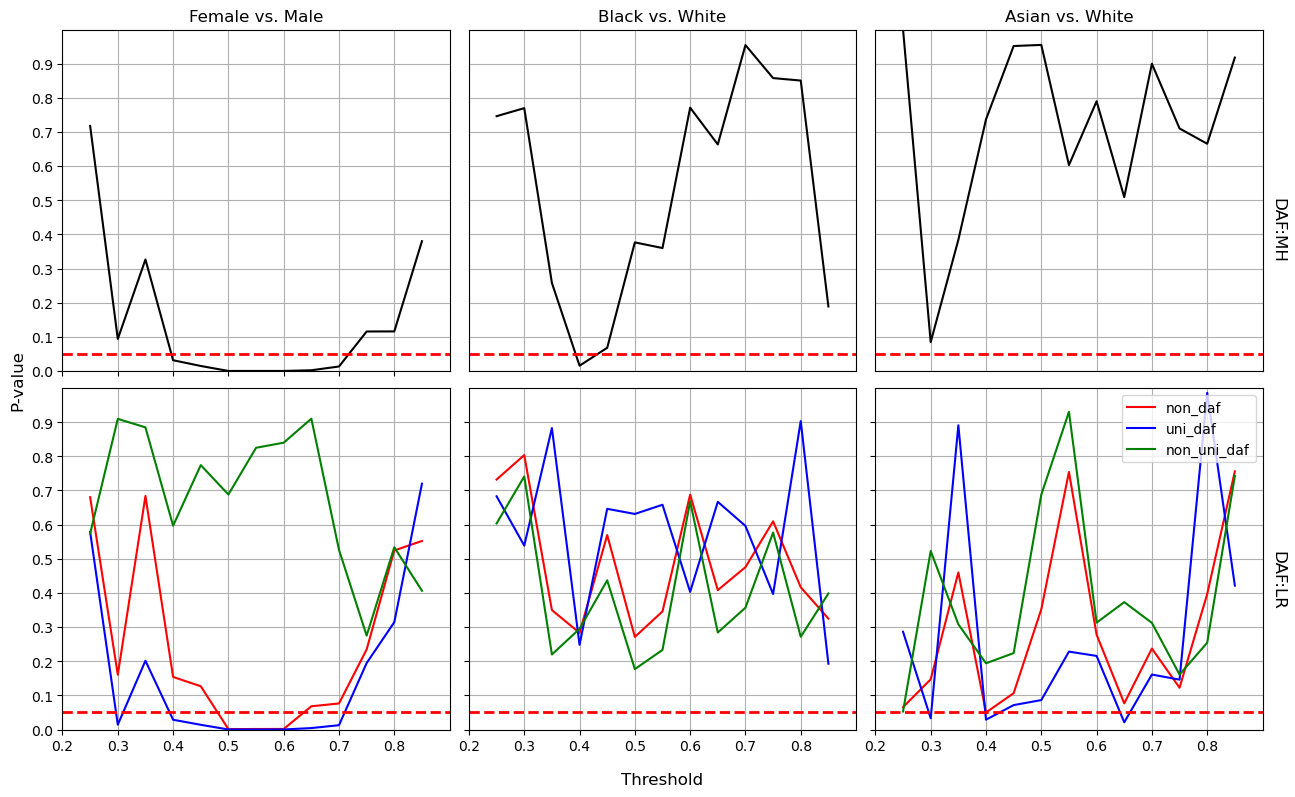
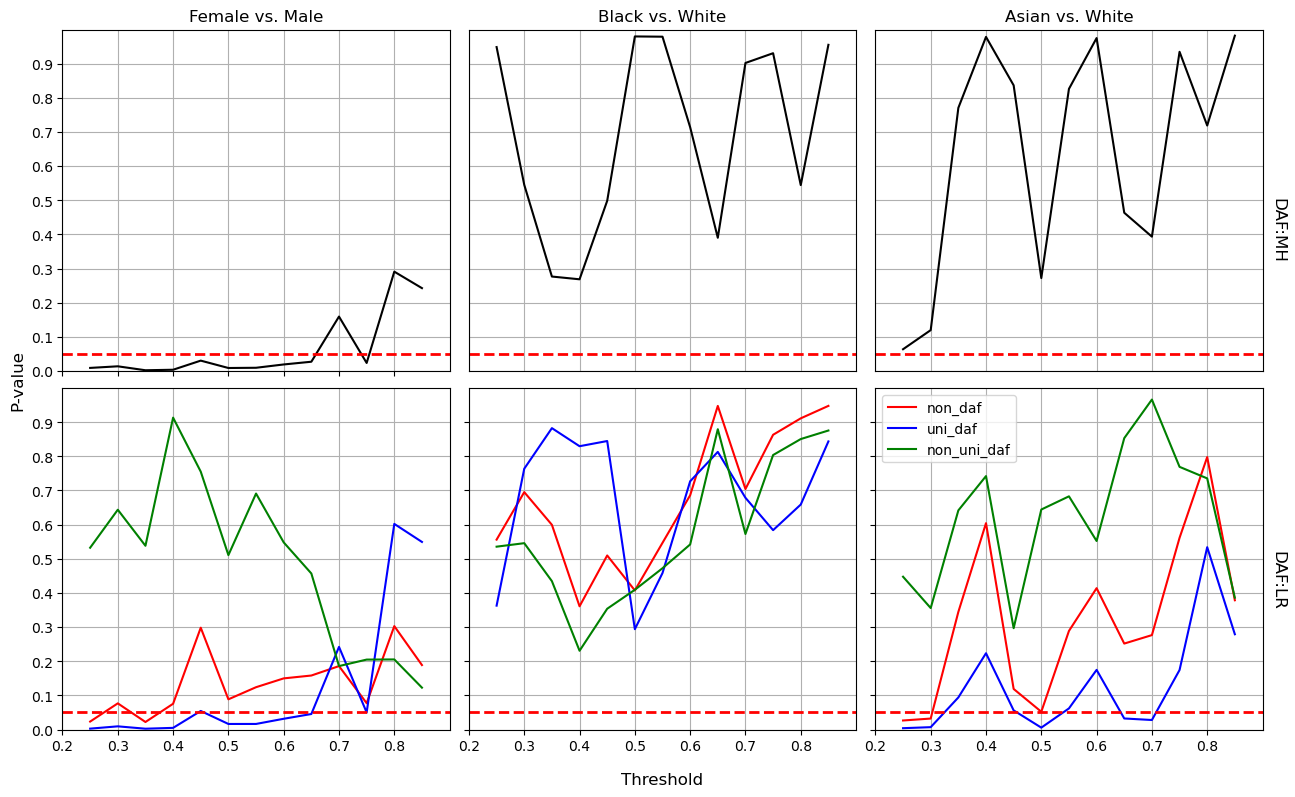
After dropping the protected variables (i.e., the gender and race/ethnicity), both MH and LR methods detect the algorithmic bias from the blind NN model in the range of threshold from about 0.48 to 0.63 comparing female to male students. However, the unfairness from the aware NN model when comparing Black versus White and Asian versus White has almost disappeared as shown in Figure 4. Similarly, the blind LR model demonstrates nearly non-bias prediction on the same race groups; see Figure 6. Compared to the increasing bias from blind NN model on gender, this baseline model shows alleviated unfairness.
Consequently, the decision to include protected attributes in enhancing fairness is contingent on the specific model and the nature of the protected attributes. For school administrators aiming to foster a gender-equitable environment, the aware NN model is advisable. In contrast, to mitigate predictive bias concerning certain racial or ethnic groups, the blind NN model may be a viable option. Alternatively, administrators can utilize the aware NN model, but it is recommended to apply it within a safe (i.e., unbiased) threshold range exceeding 0.53 for fairly identifying Black and White students at risk of dropping out.
5. DISCUSSION AND CONCLUSION
Utilizing the newly proposed Differential Algorithmic Functioning (DAF) method [27], this study explores the potential biases in machine learning models used for predicting high school dropouts. It delves into the impact of including or excluding protected attributes on both the predictive performance and algorithmic fairness of these models. Specifically, the research focuses on gender and race as critical factors in the model’s performance. Recognizing that school leaders might need to dynamically adjust the cutoff in predicted probabilities to vary the sensitivity for detecting potential dropouts, we perform a comparative analysis across a broad spectrum of thresholds.
In addressing the first and third research questions, our findings indicate that the presence of predictive bias in a machine learning algorithm is contingent upon the model used, the protected groups involved, and the specific threshold range. For instance, some models, like an aware NN model, may yield unbiased predictions across the entire threshold range for certain focal and reference groups, such as female and male students. Conversely, other models, like LR, may consistently produce biased results. Based on these findings, we recommend that researchers aiming to develop predictive models should thoroughly evaluate algorithmic fairness. Moreover, they should provide guidance on what constitutes a safe (bias-free) range of thresholds for interpreting the models.
The impact of protected variables on predictive performance varies depending on the model. These attributes may have a minimal contribution to the detection of the target, especially in terms of specific metrics like sensitivity or accuracy. The decision to include or exclude these variables should also take into account their effect on algorithmic fairness. Omitting certain group memberships might reduce predictive bias (as seen in the Black vs. White comparison in the blind NN model), but it could simultaneously exacerbate outcome disparities in other groups (such as the female vs. male comparison in the blind NN model).
We recommend that in deciding the retention of a protected attribute, researchers should consider its impact on three key aspects across the range of thresholds they are interested in: predictive performance according to certain metrics, changes in algorithmic fairness, and the practical implications of deploying the models. This comprehensive approach ensures that the decision is informed by a balance of technical accuracy and ethical considerations.
An additional contribution of our study is the development of a reproducible machine learning model that demonstrates strong predictive performance on a nationally representative dataset, while also highlighting its unbiased application in real-world school settings. Our blind and aware neural network models, which rely solely on data from the first semester of 9th grade, achieve AUC scores around 0.79, recall rates approximately 0.73, and specificities near 0.70. These results indicate a more balanced performance at an intuitive and interpretable threshold (specifically, 0.50) compared to the study by Sansone [24], who conducted a similar investigation using the same dataset. This comparison underscores the efficacy of our models in terms of both predictive accuracy and fairness in practical educational scenarios.
A limitation of our study is its reliance on the Mantel-Haenszel test and logistic regression methods to detect Differential Algorithmic Functioning (DAF) as a measure of algorithmic fairness. Suk and Han [27] have also introduced a residual-based approach to DAF. They emphasize that while DAF is a necessary component of fairness, it is not in itself sufficient. Future research could benefit from incorporating residual-based DAF and other methodologies for a more comprehensive evaluation of fairness [19, 22].
Moreover, we advocate for researchers to explore intersectional fairness, examining combinations on protected attributes such as black females versus white males [26]. This approach could yield insights of particular relevance to school leaders and policymakers, fostering a deeper understanding of fairness across multiple intersecting identities.
6. REFERENCES
- Status dropout rates. National Center for Education Statistics, 2023. [Accessed Jan. 2024].
- W. H. Angoff and A. T. Sharon. The evaluation of differences in test performance of two or more groups. Educational and Psychological Measurement, 34(4):807–816, 1974.
- R. S. Baker, A. W. Berning, S. M. Gowda, S. Zhang, and A. Hawn. Predicting k-12 dropout. Journal of Education for Students Placed at Risk (JESPAR), 25(1):28–54, 2020.
- J. Burrus and R. D. Roberts. Dropping out of high school: Prevalence, risk factors, and remediation strategies. R & D Connections, 18(2):1–9, 2012.
- N. V. Chawla, K. W. Bowyer, L. O. Hall, and W. P. Kegelmeyer. Smote: synthetic minority over-sampling technique. Journal of artificial intelligence research, 16:321–357, 2002.
- A. Chouldechova and A. Roth. The frontiers of fairness in machine learning, 2018.
- B. Christeson, B. Lee, S. Schaefer, D. Kass, and S. Messner-Zidell. School or the streets: Crime and america’s dropout crisis. Fight Crime: Invest in Kids, 2008. Available from Fight Crime: Invest in Kids [Accessed Jan 2024].
- J. Y. Chung and S. Lee. Dropout early warning systems for high school students using machine learning. Children and Youth Services Review, 96:346–353, 2019.
- J. C. Day and E. C. Newburger. The big payoff: Educational attainment and synthetic estimates of work-life earnings. Current population reports, Bureau of the Census, Economics and Statistics Administration, Washington, DC, 2002.
- D. Dragone, G. Migali, and E. Zucchelli. High School Dropout and the Intergenerational Transmission of Crime. IZA Discussion Papers 14129, Institute of Labor Economics (IZA), Feb. 2021.
- H. Han, W.-Y. Wang, and B.-H. Mao. Borderline-smote: a new over-sampling method in imbalanced data sets learning. In International conference on intelligent computing, pages 878–887. Springer, 2005.
- G. P. Hickman, M. F. Sabia, R. Heinrich, L. Nelson, F. Travis, and T. Veri. Predicting high school freshmen dropout through attentional biases and initial grade point average. Journal of At-Risk Issues, 20(2):45–54, 2017.
- S. J. Ingels, D. J. Pratt, D. R. Herget, L. J. Burns, J. A. Dever, R. Ottem, J. E. Rogers, Y. Jin, and S. Leinwand. High school longitudinal study of 2009 (hsls: 09): Base-year data file documentation. National Center for Education Statistics, 2011.
- B. Kiss, M. Nagy, R. Molontay, and B. Csabay. Predicting dropout using high school and first-semester academic achievement measures. In 2019 17th International Conference on Emerging eLearning Technologies and Applications (ICETA), pages 383–389, 2019.
- J. Kleinberg, J. Ludwig, S. Mullainathan, and A. Rambachan. Algorithmic fairness. volume 108, pages 22–27, May 2018.
- J. A. Koenig and R. M. Hauser. High school dropout, graduation, and completion rates: Better data, better measures, better decisions. National Academies Press, 2011.
- S. Kotok, S. Ikoma, and K. Bodovski. School climate and dropping out of school in the era of accountability. American Journal of Education, 122(4):569–599, 2016.
- H. Lakkaraju, E. Aguiar, C. Shan, D. Miller, N. Bhanpuri, R. Ghani, and K. L. Addison. A machine learning framework to identify students at risk of adverse academic outcomes. In Proceedings of the 21th ACM SIGKDD international conference on knowledge discovery and data mining, pages 1909–1918, 2015.
- M. A. Madaio, L. Stark, J. Wortman Vaughan, and H. Wallach. Co-designing checklists to understand organizational challenges and opportunities around fairness in ai. In Proceedings of the 2020 CHI conference on human factors in computing systems, pages 1–14, 2020.
- J. McFarland, J. Cui, J. Holmes, and X. Wang. Trends in high school dropout and completion rates in the united states: 2019. Compendium Report NCES 2020-117, National Center for Education Statistics, 2020.
- U. S. D. of Education. Institute of Education Sciences. National Center for Education Statistics. High school longitudinal study, 2009-2013 [united states], May 2016. Accessed: [Jun. 2023].
- D. Pessach and E. Shmueli. Algorithmic fairness. In E. S. Lior Rokach, Oded Maimon, editor, Machine Learning for Data Science Handbook: Data Mining and Knowledge Discovery Handbook, pages 867–886. Springer Nature, Switzerland AG, 2023.
- R. W. Rumberger and S. A. Lim. Why students drop out of school: A review of 25 years of research. 2008.
- D. Sansone. Beyond early warning indicators: high school dropout and machine learning. Oxford bulletin of economics and statistics, 81(2):456–485, 2019.
- S. B. Shum. Should predictive models of student outcome be "colour-blind", oct 2020. Accessed: [Jan. 2024].
- Y. Suk and K. T. Han. Evaluating intersectional fairness in algorithmic decision making using intersectional differential algorithmic functioning, Sep 2023.
- Y. Suk and K. T. Han. A psychometric framework for evaluating fairness in algorithmic decision making: Differential algorithmic functioning. Journal of Educational and Behavioral Statistics, 49(2):151–172, 2024.
- H. J. Weerts. An introduction to algorithmic fairness. arXiv:2105.05595, 2021.
- I. R. White, P. Royston, and A. M. Wood. Multiple imputation using chained equations: issues and guidance for practice. Statistics in medicine, 30(4):377–399, 2011.
- R. Yu, H. Lee, and R. F. Kizilcec. Should college dropout prediction models include protected attributes? In Proceedings of the eighth ACM conference on learning@ scale, pages 91–100, 2021.
1The data and code for this study can be accessed through the first author’s GitHub repository at: https://github.com/cgpan/hslsdropout.