ABSTRACT
This paper proposes an interactive web-based Python dashboard tool for allowing any users to easily predict students at risk and help make decisions about avoiding student dropout. The user must not necessarily have the programming skills required to develop a machine-learning project. Instead, our system will allow the user to upload students’ information dataset, and automatically will generate the best possible prediction model and explanations. The novelty of this tool is that it integrates Automated Machine Learning (AutoML) and Explainable Artificial Intelligence (XAI) techniques, especially counterfactual explanations, into the same interface to make the process more accessible. The objective is to democratize and personalize data science by allowing any stakeholder, to make predictions of student dropout from a dashboard. It provides two different interfaces: a basic interface for beginners and a more complete interface for advanced users. In this paper, we describe the use of the dashboard on a free public dataset for predicting student dropout.
Keywords
INTRODUCTION
Detection of students at risk of dropping out is a major challenge for educational institutions today. Educational Data Mining (EDM) and Predictive Learning Analytics (PLA) are promising approaches to tackle this problem, allowing the development of predictive models for identifying at-risk students and enabling effective intervention strategies [1]. However, applying machine learning techniques becomes a challenge for instructors, course developers or designers lacking expertise in data mining. First, because it is difficult for these stakeholders to do all the data science process, that is: data preprocessing, feature engineering, model selection, and hyperparameter tuning. In addition, the most powerful prediction models such as deep neural networks and ensemble models produce black-box models understandable to users.
To address these issues, we propose the combined used of Automatic Machine Learning (AutoML) and Explainable Artificial Intelligence (XAI) into an interactive visual tool. AutoML allows non-experts, such as educators and users, to conduct experiments and produce automatically complex and effective learning models without any coding experience [2]. The idea behind our proposal is that the users only must provide their dataset and then the results will be displayed back to them. XAI techniques allow users to understand the decisions made by the machine learning models, making them feel more confident about the model’s recommendations in decision-making processes [3]. Among all the XAI methods, counterfactual explanations are very useful in our problem [4]. It shows attributes that, when altered, could potentially change the risk of drop-out risk and guide students toward academic success. So, it can help the users to make decisions about avoiding student dropout. Additionally, our tool provides two different tailored views, one with a few options and another with more options. The former is intended to be used by basic machine learning users while advanced users are recommended to use the latter. The user only has to load a dataset and select one of the two available interfaces to automatically obtain the predictions and explanations about student dropout.
DASHBOARD DESCRIPTION
The interactive web-based dashboard has been developed in Python language. It has a very simple and easy-to-use interface that consists of four main steps as shown in Figure 1.
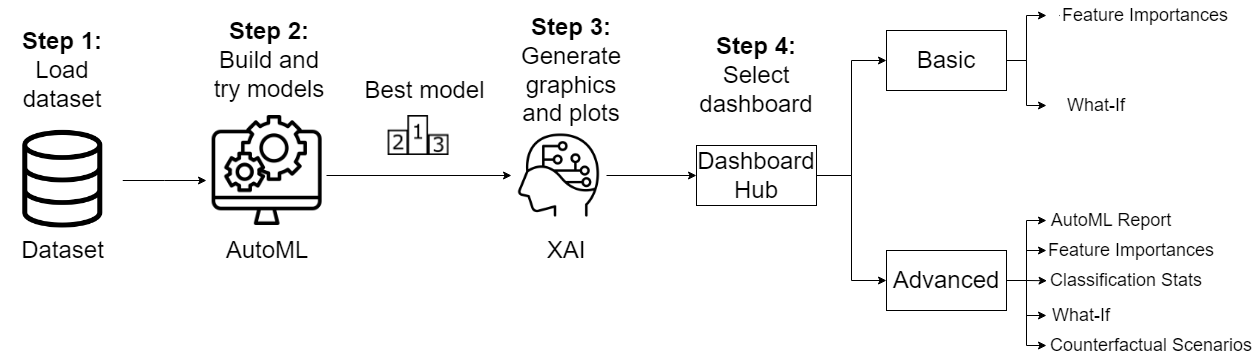
Firstly, user has to upload a dataset. Next, AutoML automatically obtains the best prediction model for this dataset by executing and comparing a wide range of well-known machine learning models. Then, XAI techniques are executed for automatically generating graphics and plots to explain the best obtained model in two different dashboards. Finally, the user must select between using the basic interface or the more advanced or full interface. The basic interface is oriented to users with low level of knowledge about machine learning and it only provides two tabs: the feature importance and the what-if scenarios. The advanced interface is oriented to users with a higher level of knowledge about machine learning. It provides five tabs: AutoML report, feature importances, classification stats, what-if and counterfactual scenarios.
Dataset loading
In the first stage, the user must load one or two datasets in .csv format. The only restriction that must fulfill the dataset is that the last attribute should be the class attribute to be predicted and must be labeled as Dropout and Nondropout. There are 2 possibilities when uploading the data file:
- To upload only 1 dataset that will be used both for training and prediction. This dataset will be automatically divided in 75% training and 25% test randomly. The target feature/attribute or class label must appear for all instances/students.
- To upload 2 datasets, one for training and the other for prediction. The target feature must appear in all instances of the training dataset but it must be empty in the test dataset.
In this paper, as an example case of study, we have used a free available public student dropout dataset [5]. The dataset contains 34 features (demographic, socioeconomic, macroeconomic, and academic data at enrollment, and at the end of the first and second semester) about 4424 undergraduate students at a higher education institution. Data were collected over a period of 10 years, from the academic year 2008/9 to the academic year 2018/19. The dataset is provided in .csv format. We have modified the three labels of the class (dropout, enrolled, graduated) by merging enrolled and graduate students as no-dropout. As a result, we will finally have only 2 labels (Dropout and Nondropout).
AutoML execution
To implement AutoML we have used the Python library mljar-supervised [6]. Although there are other Python libraries for doing AutoML such as Auto-Keras, Auto-PyTorch, Auto-Sklearn, AutoGluon, H2O AutoML, TPOT, etc. [7], we have selected mljar-supervised due to its ease of use. This is an Automated Machine Learning Python package that works with tabular data. It is designed to save time for a data scientist. It abstracts the common way to preprocess the data, construct the machine learning models, and perform hyper-parameters tuning to find the best model. It executes many classification algorithms such as: Baseline, Linear, Random Forest, Extra Trees, LightGBM, Xgboost, CatBoost, Neural Networks, and Nearest Neighbors. In our case of study, the student dropout dataset was preloaded by mljar-supervised. Then, it was split into 75%/25% (train/test) for evaluation purposes. Finally, the best prediction model (among the ones mentioned before) was automatically obtained to be used in the next step.
XAI generation
Starting from the automatically best prediction model obtained in the previous step, two different XAI dashboards are automatically generated. We have used the library explainerdashboard [8]. This package makes it convenient to quickly deploy a dashboard web app that explains the workings of a (scikit-learn compatible) machine learning model. It uses the framework Dash [9] that ties modern UI elements like dropdowns, sliders, and graphs directly to your analytical Python code. It provides interactive plots on model performance, feature importances, feature contributions to individual predictions, "what if" analysis, partial dependence plots, SHAP (interaction) values, etc. Additionally, we also generate counterfactual explanations using DICE library [4]. Counterfactuals provide information by showing feature-perturbed versions of the same case. In our problem, counterfactuals show how a student who is failing could pass if certain factors were altered.
Dashboard selection
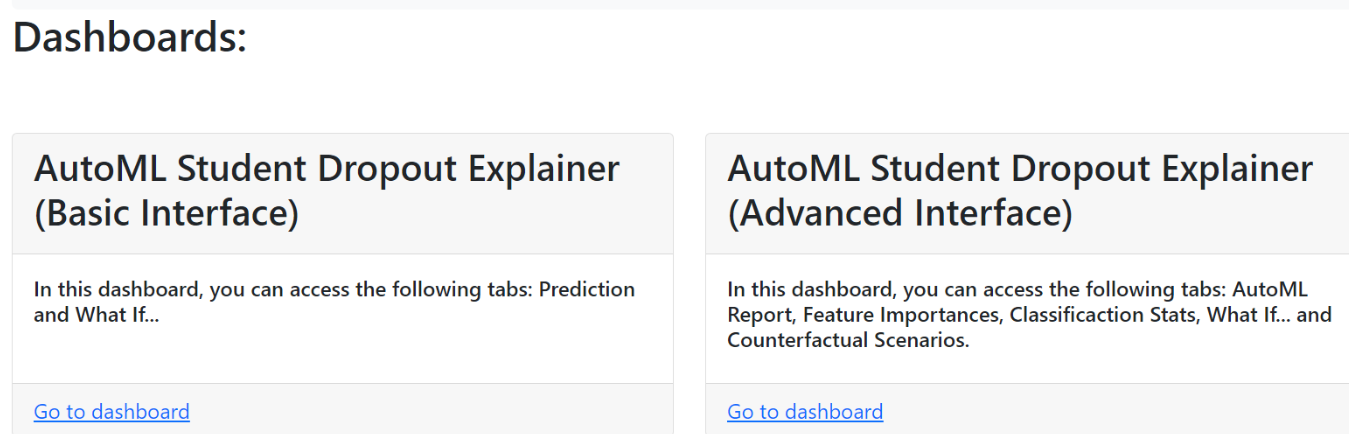
Finally, user can choose between using or the basic dashboard or the full and more advanced dashboard (see Figure 2), depending on the level of knowledge about machine learning of the user.
Basic interface
This dashboard, intended for basic users, only contains only two tabs: feature impact and what-if.
- Feature Impact: This tab shows the average importance or impact of each input variable or attribute on the prediction. It provides a bar chart of the mean absolute SHAP (SHapley Additive exPlanations) values ordered in decreasing order of importance (see Figure 3).
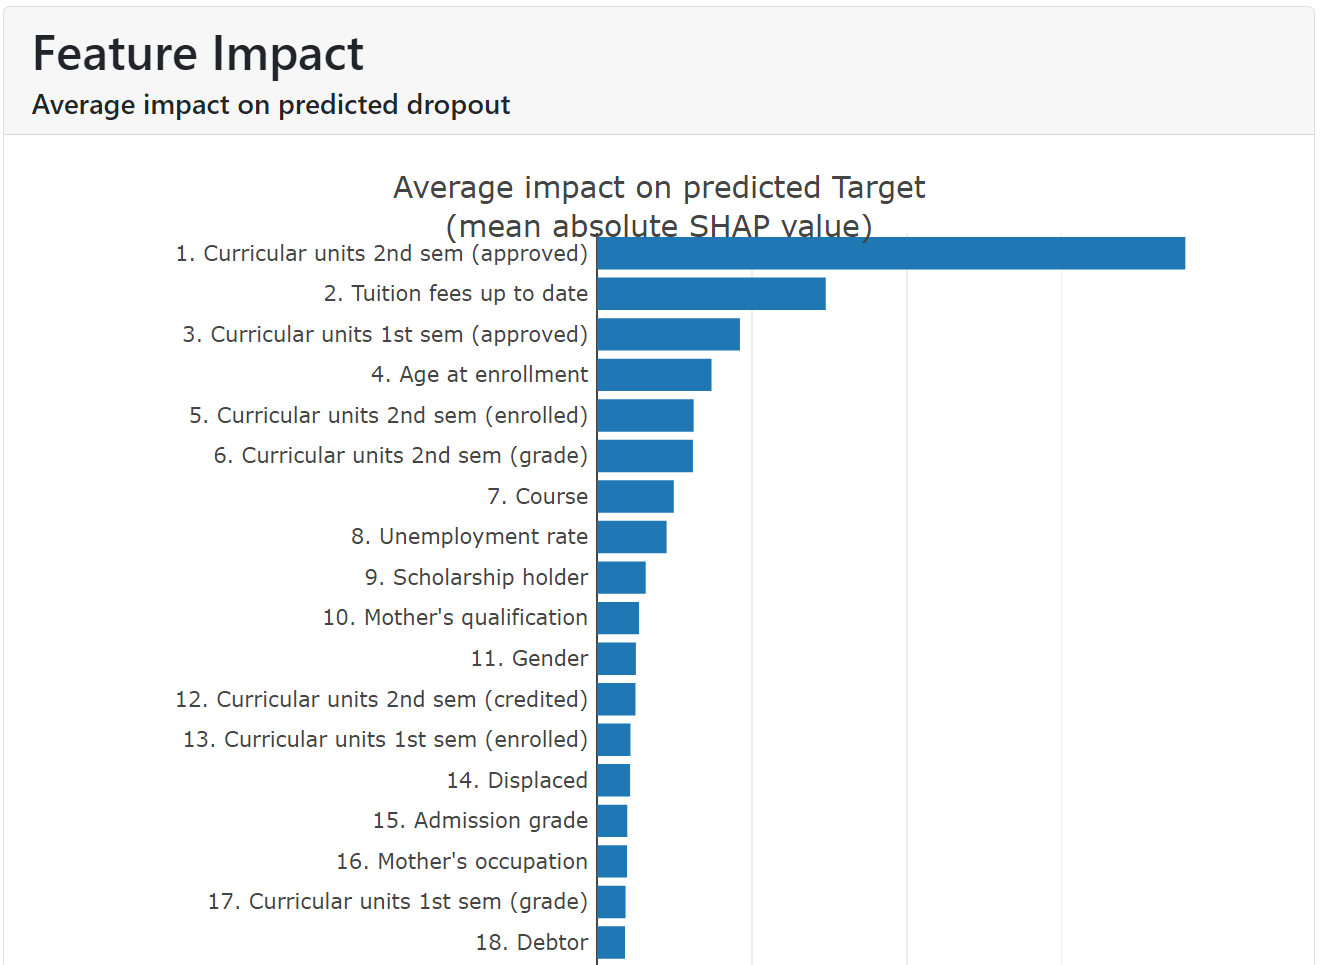
As we can see on figure 3, the attribute “Curricular units 2nd sem (approved)” had the biggest impact on the prediction by a huge margin, followed by “Tuition fees up to date” and “Curricular units 1st sem (approved)”. This information is very useful for users due to it shows what attributes have a stronger effect on the prediction of dropout for all students.
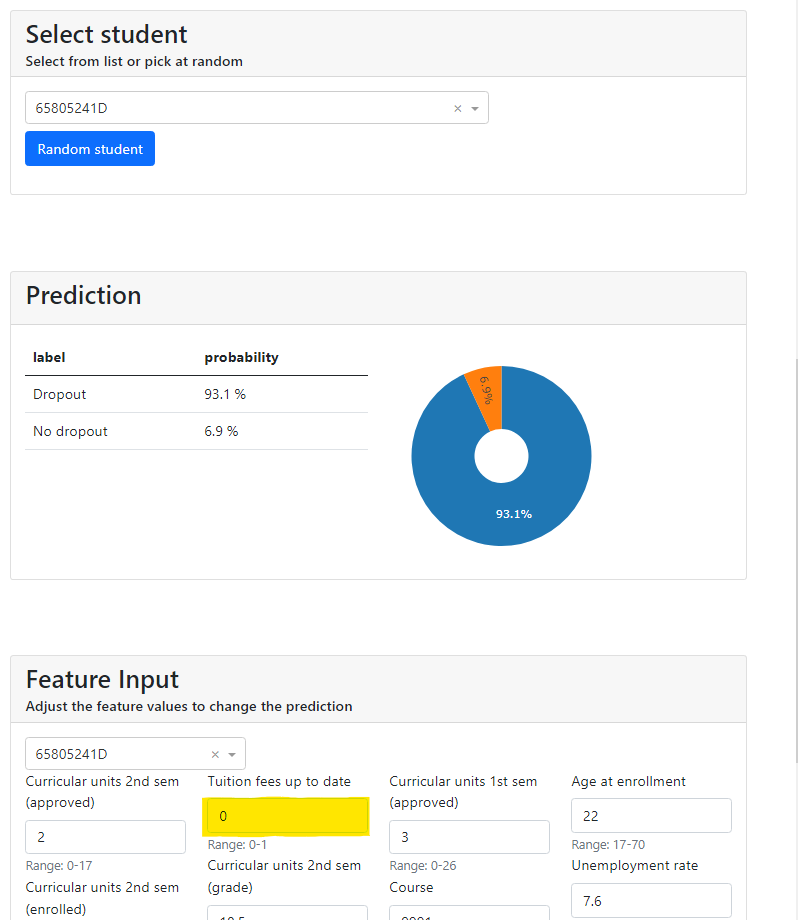
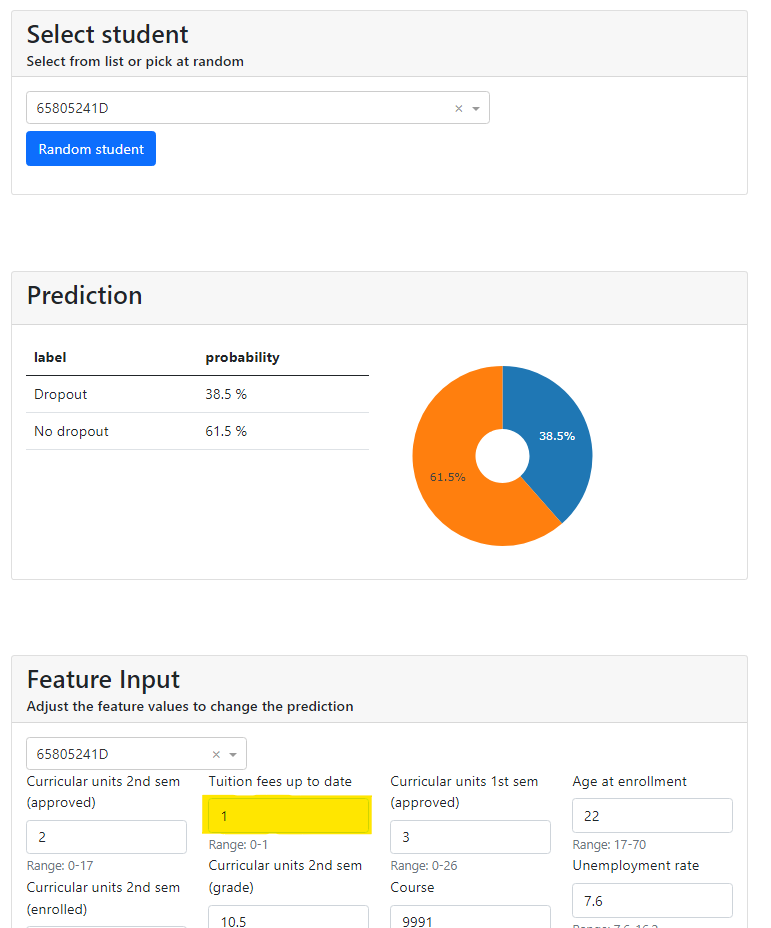
- What-If: In this tab, the user has to select a specific student (by an anonymized identifier) in order to see what the probability is to drop out. And then, the user can modify the value of any variable to test how it affects on the prediction (Figure 4).
For example, figure 5 shows that after changing the value of “Tuition fees up to date” from 0 to 1 (that means from not paying them to paying), the prediction for the student 65805241D goes down from a percentage of dropout 93.1% to 38.5%.
Advanced interface
The advanced or full interface is similar to the basic interface but with more options and information. This dashboard is oriented to users who are more experienced in machine learning tasks, and it provides the next five tabs:
- Feature Impact: It is the same “Feature Impact” tab of the basic interface that shows a graph with the average impact of each variable on the predicted dropout.
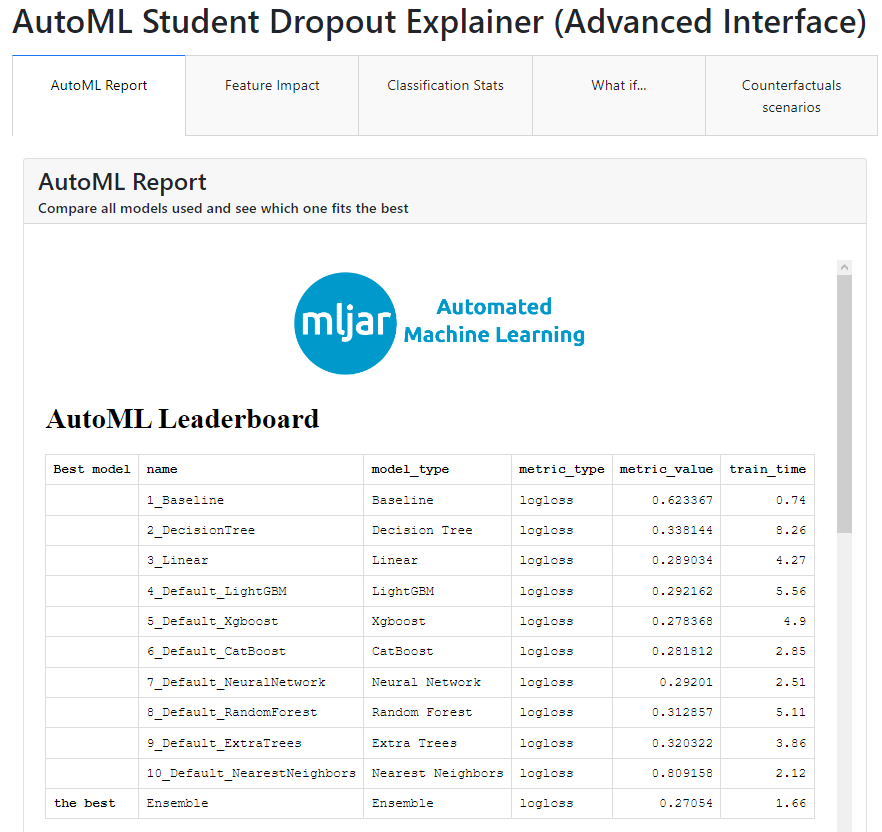
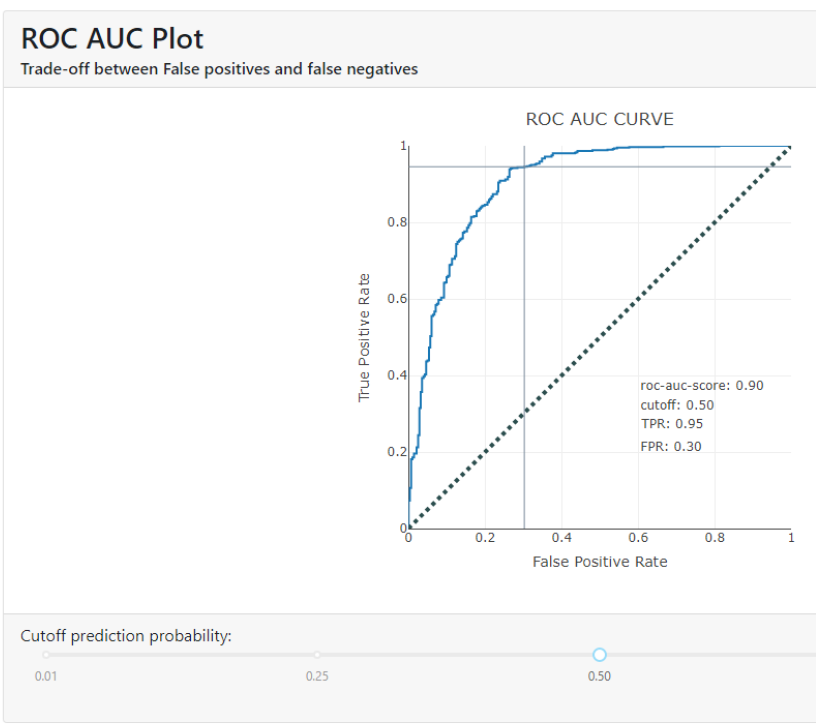
- Classification Stats: This tab shows different classification metrics (accuracy, precision, recall, f1-score, roc-auc-score, pr-auc-score and log_loss), the confusion matrix and the ROC AUC curve of the best model. For example, Figure 7 shows the ROC AUC curve that indicates how far the model is capable of distinguishing between classes (in our case 0.9). The TPR (True Positive Rate) and FPR (False Positive Rate) values indicate the rate of correct and incorrect classification of the model for each decision threshold. In this case, a TPR value of 0.95 indicates that the model is capable of correctly identifying 95% of the positive cases. While an FPR value of 0.30 indicates that the model also incorrectly classifies 30% of the negative cases as positive.
- What-If: It is the same “What-If” tab as in the basic interface. The users will be able to select a student and see the predictions the model made. If the user wishes, he/she can also modify each variable to see how it affects the prediction.
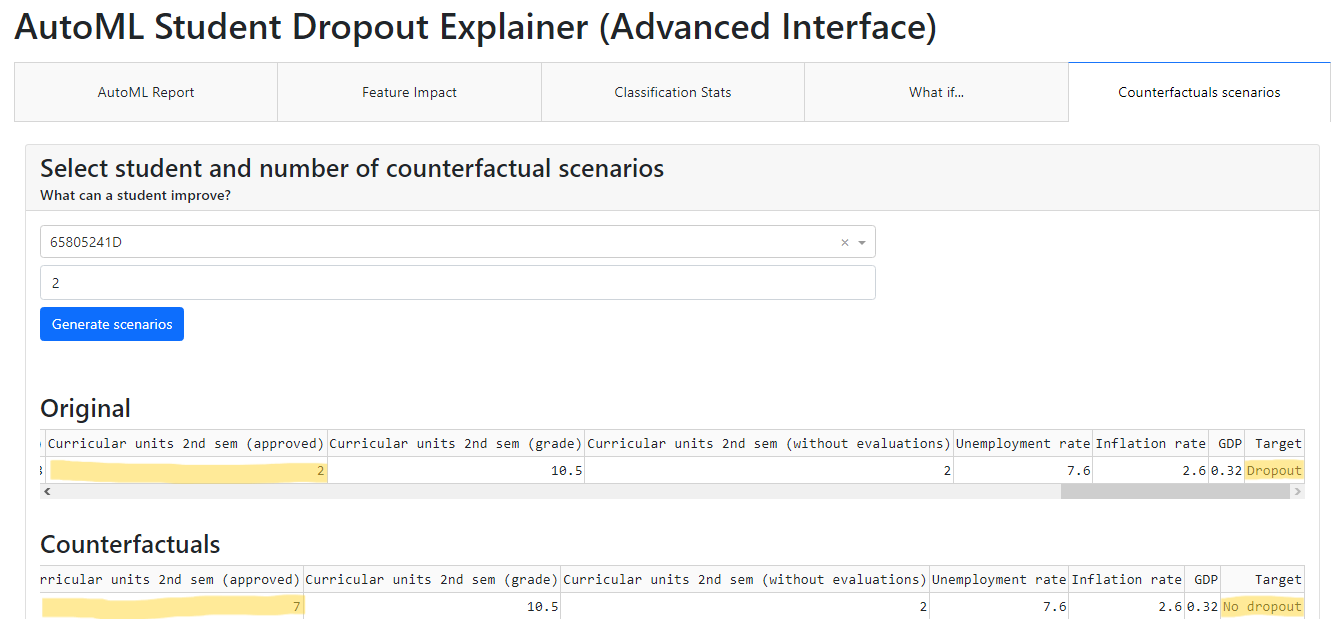
- Counterfactual Scenarios: On this last tab, the user can select a student (by using the anonymized identifier) and the number (between 1 and 10) of counterfactual scenarios to automatically generate. These scenarios will show the variables to be modified, causing a shift in the student's circumstances (from dropout to nondropout).
- For example, Figure 8 shows that student 65805241D (the same of the first scenario) changed from dropout to no dropout when the value of “Curricular units 2nd sem (approved)” is modified from 2 to 7.
CONCLUSIONS and future work
This paper proposes an Interactive Visual Dashboard designed to easily predict students at risk and provide explanations about the obtained models and how to intervene in student dropout. The tool aims to democratize data mining for users, regardless of their machine learning knowledge, by using AutoML and XAI techniques. However, there are some issues for non-experts in data mining that should be highlighted. First, when the dataset used has a problem, such as it being imbalanced, the users cannot analyze how to solve and modify it by using this tool. Second, if the best model selected by AutoML exhibits poor performance due to overfitting and underfitting, SHAP values may provide non-confident information. In this regard, XAI methods have other limitations such as the lack of theoretical and empirical evidence for the correctness of XAI explanations [10]. As future work, we are now preparing a case study for evaluating the dashboard with beginners and advanced users in machine learning. We expect the usability evaluation to yield satisfactory scores for both interfaces, showing that both interfaces effectively democratize the methodology for users with different data science knowledge levels. We are also working to add more tabs to our tool; for example, to provide information about the prediction model's fairness and bias. The idea behind this future line is that the user can select the protected attributes (such as race, gender, etc.) to obtain metrics and graphics that show whether or not the model is fair or biased.
ACKNOWLEDGMENTS
This research was supported by the ProyExcel-0069 project of the Andalusian University, Research and Innovation Department.
REFERENCES
- Shafiq, D. A., Marjani, M., Habeeb, R. A. A., and Asirvatham, D. 2022. Student retention using educational data mining and predictive analytics: a systematic literature review. 10, p. 72480-72503. IEEE Access. DOI=10.1109/ACCESS.2022.3188767
- Tsiakmaki, M., Kostopoulos, G., Kotsiantis, S., and Ragos, O. 2019. Implementing AutoML in educational data mining for prediction tasks. Applied Sciences, 10(1), p. 90, Article 90. DOI=10.3390/app10010090
- Melo, E., Silva, I., Costa, D. G., Viegas, C. M. D., and Barros, T. M. 2022. On the Use of eXplainable Artificial Intelligence to Evaluate School Dropout. Education Sciences, 12(12), p. 845, Article 845. DOI= 10.3390/educsci12120845
- Mothilal, R. K., Sharma, A., and Tan, C. 2020. Explaining machine learning classifiers through diverse counterfactual explanations. In Proceedings of the 2020 conference on fairness, accountability, and transparency, p. 607-617, DOI=10.1145/3351095.3372850
- Realinho, V., Machado, J., Baptista, L., and Martins, M. V. 2022. Predicting Student Dropout and Academic Success. Data, 7(11), p. 146, Article 146. DOI=https://doi.org/10.3390/data7110146
- Plońska, A., and Ploński, P. 2022. MLJAR: State-of-the-art automated machine learning framework for tabular data. Github. https://github.com/mljar/mljar-supervised
- Ferreira, L., Pilastri, A., Martins, C. M., Pires, P. M., & Cortez, P. 2021. A comparison of AutoML tools for machine learning, deep learning and XGBoost. In proceeding of IEEE International joint conference on neural networks. p. 1-8, DOI=10.1109/IJCNN52387.2021.9534091
- Dijk, O., Ray Bell, Lily, Simon-Free, Serna B., Gädke, A., Todor, A., Evgeniy, Hugo, Mohammad Haizad, Tunay Okumus, and woochan-jang. 2023. oegedijk/explainerdashboard Zenodo. DOI=10.5281/zenodo.7633294
- Manley, E. D. 2023. Dash: An easy-to-use framework for building web applications and dashboards. Journal of Computing Sciences in Colleges, 38(6), 104-105. DOI= 10.5555/3606388.3606401
- Wilming, R., Kieslich, L., Clark, B., & Haufe, S. 2023. Theoretical behavior of XAI methods in the presence of suppressor variables. In International Conference on Machine Learning. 37091-37107.