ABSTRACT
Educational games have demonstrated benefits across a variety of subjects and skills. To understand how a well-designed game enhances learning, it is crucial to analyze students’ choices throughout the learning process. This can be done with the framework of problem-solving strategies. Existing studies have mainly focused on summarizing, categorizing, and correlating strategies with learning outcomes. However, they have seldom visualized the temporal changes in problem-solving strategies at a more granular level to demonstrate their development. To fill this gap, the present study investigated how students engaged with Water Cycle, a geography game designed to teach water-movement processes to middle school students. Specifically, the study sought to summarize students’ problem-solving strategies, visualize their temporal changes, and evaluate their effectiveness in winning the game. Within a single game, the students demonstrated an increase in the complexity and effectiveness of their problem-solving strategies. These findings complement existing research and underscore the potential of using game learning analytics to study the temporal evolution of problem-solving in educational games.
Keywords
INTRODUCTION
Game-based learning (GBL) is the use of games, usually digital ones, to achieve specific learning outcomes [42]. It includes creating educational games [7, 40, 47] and adapting commercially available ones (e.g., SimCity [35], Portal [1], and Minecraft [37]) for educational purposes. GBL has gained attention due to the large number of available games and their diverse learning benefits. While the results concerning the effectiveness of GBL compared to traditional teaching methods are mixed, a recent meta-analysis [26] showed that educational games produce a large effect size (g = .705) on science achievement. Another meta-analysis [45] indicated small effects on motivational (g = .36), cognitive (g = .49), and behavioral learning outcomes (g = .25).
To further explore why a well-designed game benefits learning, researchers have scrutinized the interplay between playing and learning [44, 20]. A pivotal aspect of this exploration has been players’ choices. To achieve their goals, players make moment-by-moment choices based on the game’s situation and rules. After taking an action, they interpret the result for subsequent choice making. Through this iterative process, players make meaning from their choices [50]. In the context of an educational game, a learner must learn to make meaningful choices to fulfill both the game’s goal and the learning objectives [43]. As the learner advances in the game, the choices they make may evolve over time [50], reflecting the progression of learning.
Choice making within an educational game can be examined through the framework of problem-solving strategies. A problem-solving strategy is the reasoning underlying a specific choice. Existing studies have explored problem-solving strategies in subjects such as math [28, 18, 30], physics [22, 31], and biology [48], but limited work has looked at other domains, including geography. Furthermore, scholars have summarized and categorized strategies, and they have correlated them with learning outcomes. However, they have seldom visualized strategies’ temporal changes to demonstrate the progression of problem-solving skills. This study presents an exploratory analysis, based on game learning analytics, of how a group of students engaged with Water Cycle, a geography game designed to teach Earth’s water movement processes.
We seek to answer three research questions (RQs). RQ1: What problem-solving strategies do the students employ? RQ2: How do these strategies develop over time? RQ3: Are these strategies effective?
This study makes methodological and practical contributions. Methodologically, data-driven techniques enrich the findings of traditional methods, such as cross-sectional studies and experiments. Analyzing data on a finer time scale and with a large sample size provides a comprehensive understanding of strategy development. Practically, the study’s findings allow for real-time intervention by teachers to support instruction on problem-solving skills. Also, choices have been regarded both as interventions and learning outcomes in education research [12]. This study complements the literature by examining choices as dynamic processes.
Literature Review
Game-Based Learning
Research on GBL emphasizes the application of learning theories to support the design of educational games and the use of diverse methods to explore learners’ experiences with the games. [42] summarized the theoretical foundation of GBL into four aspects: affective, behavioral, cognitive, and sociocultural. According to a systematic review [48], GBL research methods are typically experiments (e.g., [40]), surveys (e.g., [4]), interviews/focus groups (e.g., [37, 2]), and observations (e.g., [32]). [34] classified experimental designs for GBL into three categories: value-added research (examining a certain game feature), cognitive consequences research (assessing cognitive achievement), and media-comparison research (comparing a game with other media). These research methods contribute insights into both theory and practical design considerations.
In GBL research, conventional empirical methods (e.g., experiments, surveys, and interviews) are suitable for describing and explaining the game’s overall learning experience, but they tend to generate coarse process data. While user observations and think-alouds (e.g., [9]) have commonly been employed for collecting process data, they mainly provide qualitative insights. Log data can bridge this gap as it captures scalable, fine-grained data about the learning process [14]. Collecting log data is unobtrusive, which allows scholars to study GBL in both natural and lab settings [25]. By using machine learning models and statistics [25], data-driven methods complement the results of conventional methods [14]. Also, by using fine-grained process data, researchers and educators can detect meaningful patterns in gameplay behavior in real time, thus enhancing our understanding of human learning and play. This automated detection lays the foundation for game-based assessment and adaptive learning [23, 41], which enables automated scaffolding in the game and real-time teacher interventions.
Game Learning Analytics
Game learning analytics (GLA) leverages real-time log data collected from educational games, thus detailing student interactions in games. This allows for fine-grained analysis of their learning and play. GLA research serves multiple purposes. The primary one is game-based assessment, which involves the measurement of students’ knowledge and skills while they engage in gameplay [46]. The second one is modeling student behaviors and building automated detectors that target constructs or in-game actions, such as affective states [21], off-task behaviors [8], persistence [39], and learning progression [36]. The third purpose is predictive modeling, which seeks to identify key indicators that predict a learning outcome of interest [6, 13]. The fourth one is offering personalized interventions or scaffolding in the game or from the teacher [27]. The fifth purpose involves informing data-driven design [24]; for example, by revealing points where players encounter difficulties or decide to quit. Finally, GLA can be used for student profiling and clustering students into groups [29].
GLA faces the challenge of producing a generalized interpretation of the results. The gaming environment is open ended and complex, allowing players to achieve their goals in multiple ways [49]. Thus, their learning and gameplay behaviors are usually interpreted in the specific context of the game. To enhance the generalizability of the findings across games, subjects, and populations, it is recommended to anchor data analysis in a learning theory [15]. We selected problem-solving strategy theory, which has undergone empirical scrutiny.
Problem-Solving Strategy
Insights from Cognitive Psychology
In problem-solving theory, a strategy is used for “planning and monitoring the solution of problems” [33]. It operates at a higher level of abstraction than a concrete solution, serving as a guide to problem-solving. A basic problem-solving process typically consists of four steps: constructing a representation of the problem, searching for a solution, implementing solutions, and achieving the goal. A strategy may be invoked in the initial two steps and implemented in the remaining two. As students accumulate knowledge in an area, their problem-solving strategies become more effective and sophisticated. Accordingly, in complex problem situations, problem-solving may not follow a linear path, requiring continuous testing of solutions until a successful one is found.
Two general strategies that are relevant to Water Cycle are means-ends analysis [38] and schema-driven strategies [10, 11]. Means-ends analysis [38] entails iteratively assessing the difference between the goal state and the current state and taking action to reduce this difference until the goal is achieved. Means-ends analysis is well suited for problems with a clearly defined goal state and initial state [16]. In contrast, schema-driven strategies involve the activation and application of schemata–the representational structures of knowledge related to concepts [3]. In problem-solving, a problem schema contains structured information about the goal, constraints, and solutions associated with a specific problem type [17]. If a schema is invoked during problem representation, the problem solver will implement the solution more directly and bypass or reduce searches in the problem space [16].
Studies that compared experts and novices in problem-solving strategies have shown how strategies become more effective and sophisticated. This evidence suggests that experts possess schemata that enable them to effectively use sophisticated strategies [5]. For example, the study by [11] found that while novices categorized physics problems based on superficial features such as “falling bodies,” experts categorized them based on deeper knowledge (physics principles). This difference in problem representation stems from disparities in schemata. These kinds of cognitive psychology studies are valuable for explaining and predicting students’ development of problem-solving strategies in the context of GLA.
Game Learning Analytics Empirical Studies
Data-driven approaches enable detailed analyses of the development of problem-solving strategies 1) on a finer time scale, 2) over an extended period, 3) with a large sample size, and 4) in both lab and natural settings. This capability can elucidate the comprehensive learning trajectory from novice to expert.
GLA studies have shown students’ progression from basic to complex effective strategies, which indicates knowledge acquisition in educational games. For example, [28] used sequence mining to identify the strategies of 30 participants in a math game in grades 3–7 and compare the complexity of their strategies according to their searches of the problem space. In another example, [18] employed hierarchical cluster analysis, triangulated with visualization and think-aloud data, to identify play styles among nine players aged 11–13 in a game about algorithmic thinking. [48] utilized multiple regression to study the correlation between hypothesis-testing strategies and two learning outcomes–conceptual learning of science and in-game problem-solving performance–among 153 eighth-grade students in a microbiology game. Other data-driven techniques can be explored in educational games.
Game Design
Water Cycle is a turn-based card game created by Field Day Lab at the University of Wisconsin–Madison. Its target audience is middle school students in grades 5–8.
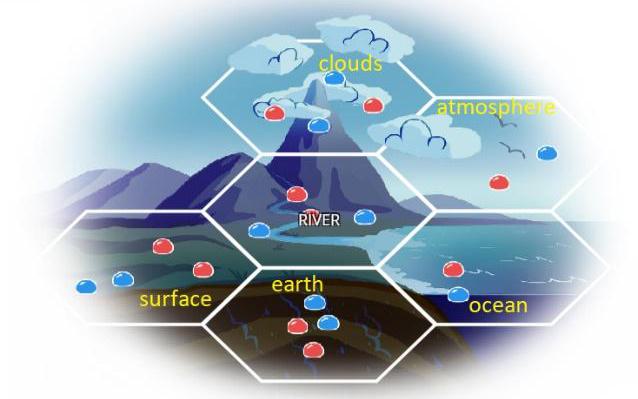
In geography, the water cycle is the circulation of water within Earth’s systems. Dynamic movements driven by gravity and solar energy continuously alter water’s distribution while maintaining its overall quantity constant. Water Cycle contains six systems–river, clouds, surface, earth, ocean, and atmosphere–which are depicted as a hexagon (Figure 1). The game also comprises six water cycle processes, each with between one and three directions and with different origin and destination systems (Table 1).
Water Cycle Process | Directions |
|---|---|
Evaporation | Surface to atmosphere, ocean to atmosphere, river to atmosphere |
Runoff | Surface to river, surface to ocean |
Condensation | Atmosphere to clouds |
Precipitation | Clouds to ocean, clouds to river, clouds to surface |
Soil absorption | Surface to earth |
Ground water expansion | Earth to river, earth to ocean |
Rules of Play
Setup. A student plays as the Red Team with the goal of accumulating more points than the Blue Team (the computer). Six hexagons in the center of the screen represent Earth’s systems (Figure 2). Both teams are randomly assigned 4–5 cards from a pool of 12 cards, each belonging to one of six water cycle processes. Each card contains brief information about its water cycle process. The student can click on the card to view additional information.
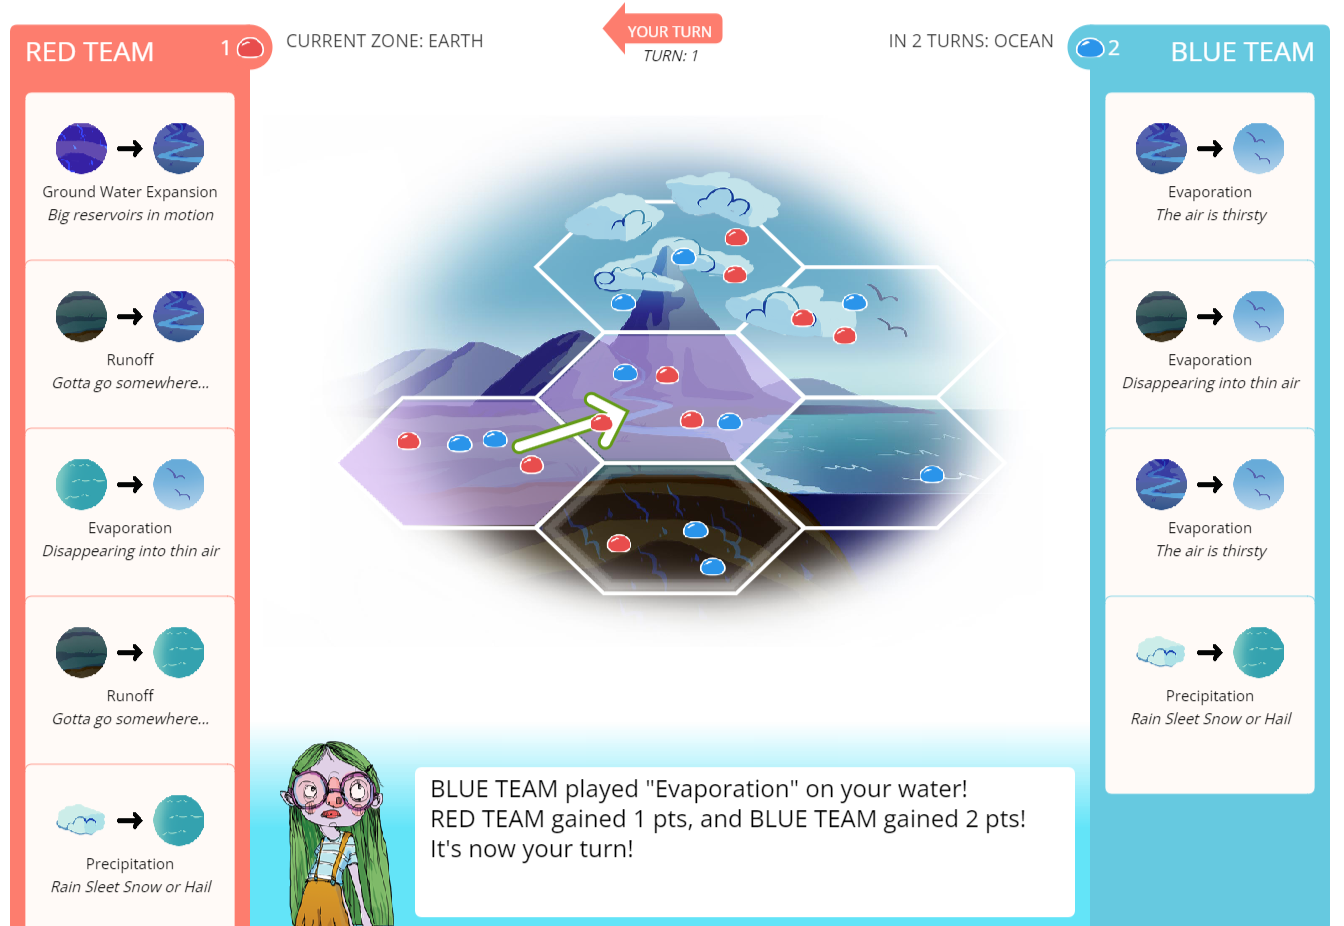
Gameplay. The student can choose to play a 10-turn or 30-turn game. During each turn, the student plays a card and selects the color of water droplets (red or blue). This action moves the droplet from one zone to another. Then, the computer does the same. When the turn ends, the student earns points based on the number of red droplets in the designated “current zone,” which represents one of the six hexagons, as specified by the game. Similarly, the computer earns points based on the number of blue droplets in the current zone. The game also designates a “next zone,” which becomes the current zone after three turns. The team with the most points at the end of the game wins. In addition, players are presented with additional scaffolding during the first three turns, with arrows displayed on the game board to illustrate the outcome of playing each card.
Strategy
The most effective gameplay strategy centers on maximizing the number of red water droplets while minimizing the number of blue water droplets in both the current and next zones. However, students are constrained by the availability of cards and water droplets on the board. Furthermore, the cards allocated to students and the designation of zones are random. To win, students must evaluate the effects of their actions and make the best move given the zones, the board, and the available cards in each turn. Ideally, exposure to this problem scenario provides students with the opportunity to encode and retrieve knowledge of the water cycle.
In Water Cycle, we consider a problem-solving strategy to be the reasoning underlying a specific action taken by a student. This strategy extends beyond the mere selection of actions when presented with multiple choices; it includes the process of evaluating the outcomes of choices and the sequence of choices toward a specific goal. Evidence from cognitive psychology shows that players are more likely to initially use less effective strategies, such as means-ends analysis. As they progress in the game, they gradually adopt more effective and sophisticated strategies, potentially leaning toward schema-driven approaches. Specifically, they are expected to learn to identify the distribution of water droplets on the board, strategically plan moves based on the current and next zones, and make informed decisions regarding the appropriate card and color of the water droplet for each move. Throughout this process, students intend to generate and critically evaluate multiple solutions in the defined problem space. They may progress from focusing on a single decision-making element (color, zone, or direction of the move) in one move to recognizing the connections among multiple elements and understanding the longer-term impacts of their moves. Ideally, students’ strategy development would also reflect their acquisition of geographical knowledge in terms of schemata of the water cycle processes.
Method
Dataset
The data came from a publicly available dataset accessible on the Field Day Lab’s website (https://fielddaylab.wisc.edu/). The raw data contained time-stamped information about students’ actions, such as viewing cards, selecting cards, and moving water droplets. As ours was an exploratory analysis, we focused on one data file, which comprised 128k actions logged in June 2021. In this file, a total of 1,366 games were played. No demographic information about the participants was collected. Given that 80.6% of the games lasted 10 or fewer turns and that the shortest duration of a complete game was 10 turns, we examined data corresponding to the first 10 turns.
Data Analysis
To answer RQ1 (What problem-solving strategies do the students employ?) and RQ2 (How do these strategies develop over time?), line plots were used to compare 1) students’ ratios of moving water droplets of different colors and 2) the percentages of actions related to targeted zones and directions in a turn. Ratios and percentages were used to compare the frequency of strategies, thereby accounting for variations in the total number of actions across different turns. Chi-square tests of independence were conducted to assess the statistical significance of temporal changes. To answer RQ3 (Are these strategies effective?), an evaluation was performed based on whether the students gained or lost points.
To highlight temporal trends, the first 10 turns were divided into three periods: the beginning (turns 1–3), the middle (turns 4–6), and the end of the game (turns 7–10). The boundaries between these periods corresponded to changes in the designated zones.
RESULTS
RQ1 and RQ2: What Problem-Solving Strategies Do the Students Employ? How Do They Develop over Time?
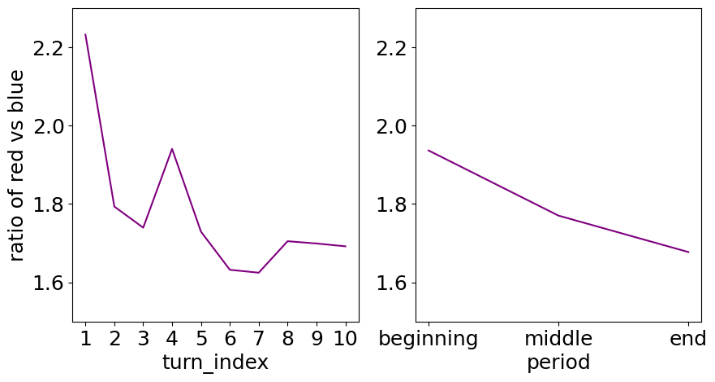
The students exhibited a preference for moving red water droplets (their droplets) over blue ones (the computer’s droplets), with a ratio of approximately 2:1. Figure 3 (left) shows the temporal trend of this ratio, which reveals a slight decrease over time. A chi-square test of independence demonstrated a significant association between color and turn, χ2 (9, N = 8,014) = 19.7, p = .02. This decreasing trend suggests that the students increased the attention paid to their opponent’s water droplets as they progressed in the game. Distinct peaks at the first and fourth turns, along with two separate declining trends in turns 1–3 and 4–6, show that the students prioritized manipulating the red water droplets when the current zones changed and shifted focus to the blue droplets in subsequent turns. Figure 3 (right) illustrates the color trend in the beginning, middle, and end periods of the game, and it highlights the persistent preference for red over blue and the decreasing trend.
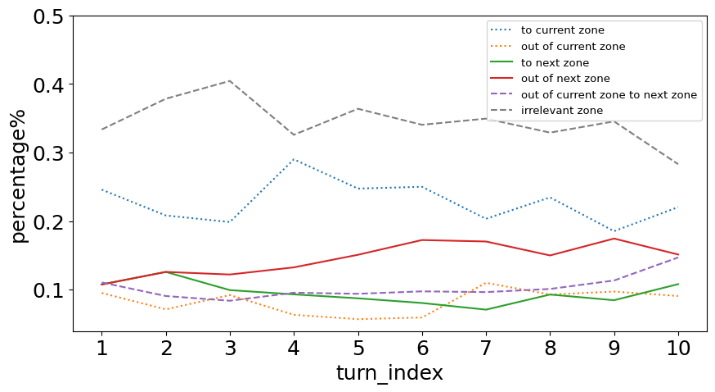
Figure 4 illustrates the temporal trends of the targeted zones and the directions of the moves for each turn. Generally, the moves concerned either the current zone or the next zone about 2/3 of the time; they were unrelated to the designated zones about 1/3 of the time. The latter ratio decreased over time, suggesting that the students’ moves became more aligned with the goal and available resources. A chi-square test of independence demonstrated a significant association between direction and turn, χ2 (45, N = 8,014) = 146.0, p < .001. Among the relevant moves, the students most frequently moved the water droplets to the current zone, but this trend decreased over time after the fourth turn. The second most frequent trend–out of the next zone–increased over time. These trends suggest that the students initially demonstrated short-term planning but gradually implemented long-term planning. The move out of the current zone to the next zone became more frequent over time, which indicates a shift from short-term to long-term planning and learning to target more than one zone.
RQ3: Are These Strategies Effective?
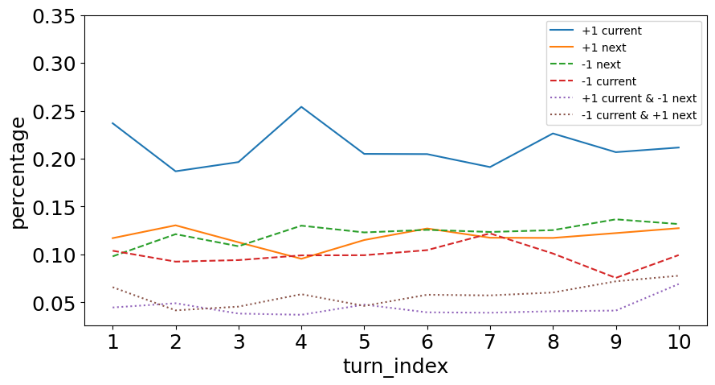
Figure 5 shows the temporal trends of the strategies’ impacts–whether the students gained or lost points. The lines are quantified as relative frequencies representing the percentage of actions in each turn. Specifically, “+1 current” represents the percentage of actions leading to a point gain in the current turn, such as getting a red water droplet in the current zone or moving a blue water droplet out of the current zone. “+1 next” reflects a point change in the future because the next zone is targeted. “+1 current & −1 next” indicates changes in both the current and future turns. Actions related to irrelevant zones were omitted from the figure.
According to Figure 5, when ranking the lines by frequency, the students most often gained points (“+1 current” and “+1 next”), followed by losing points (“−1 next” and “−1 current”) and more complex impacts (“+1 current & −1 next” and “−1 current & +1 next”). This frequency distribution indicates that their actions were effective most of the time as they gained points more often than not. Furthermore, “+1 current” occurred more frequently than “+1 next,” while “−1 next” occurred slightly more often than “−1 current.” This suggests that the students prioritized immediately gaining points, but they were also able to postpone losing points through long-term planning. A chi-square test of independence demonstrated a significant association between point change and turn, χ2 (54, N = 8,014) = 87.0, p = .002. As for the temporal trend, there was an increase in occurrences of “−1 next,” “−1 current & +1 next,” and “+1 current & −1 next.” This suggests that the students acquired long-term planning skills as they played.
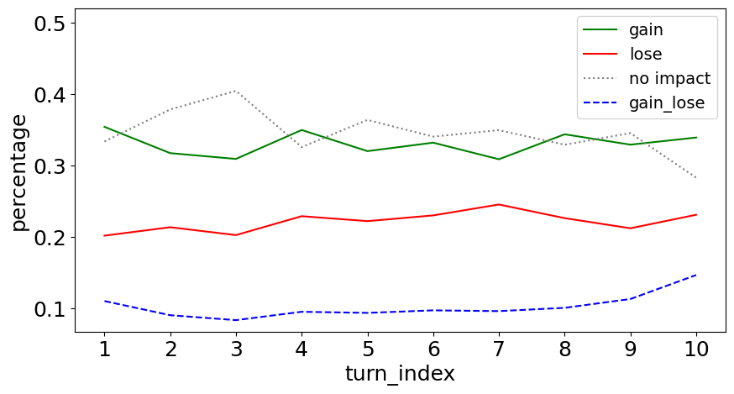
Figure 6 consolidates the lines from Figure 5 into four categories: gaining points, losing points, both gaining and losing (“gain_lose”), and no impact. When ranking the lines by frequency, the students exhibited similar patterns in gaining points and having no impact. Both occurred approximately 1/3 of the time. These two lines were followed by losing points and by both gaining and losing in different turns. This shows that their actions were mostly effective as they gained points more often than not. Regarding the temporal trend, “gain_lose” slightly increased over time. This suggests that the students were increasingly able to target more than one zone as they played. Conversely, “no impact” decreased over time, indicating that the students learned to make more effective moves. The peaks and dips at turns 4, 7, and 10 were more prominent than at other turns, which suggests that the students reacted to changes in zone designation.
Discussion
The present exploratory study examined students’ problem-solving strategies by visualizing their temporal changes and assessing their effectiveness. Gameplay data was used to capture students’ actions in the geography game Water Cycle. Drawing on the literature, it was hypothesized that as the students advanced through the game, they would employ more effective and sophisticated strategies. Ideally, this development would signal the acquisition of knowledge about geography.
Findings and Implications
Concerning RQ1 (What problem-solving strategies do the students employ?) and RQ2 (How do these strategies develop over time?), the results indicate that the students consistently prioritized decision-making elements such as color, targeted zone, and move direction for their immediate benefit (i.e., red water droplet and current-zone move). As they advanced in the game, their proficiency in utilizing resources improved, especially when there was a change in the game’s zone designation. This suggests that the students’ strategies initially focused on short-term planning and a single element; however, gradually, they evolved toward longer-term planning and the consideration of multiple elements in each action. In other words, the complexity of their strategies progressively increased.
Regarding RQ3 (Are the strategies effective?), the findings indicate that the students’ actions were mostly efficacious. Having no impact was the most common result, but this was followed by gaining points. The students demonstrated a tendency to prioritize immediate point gain and defer losing points. This disparity in their responses to gaining and losing points highlights their flexibility in alternating between short-term and long-term planning. Over time, the students improved their long-term planning, reduced the frequency at which they lost points, and enhanced their ability to target more than one zone as they played.
Furthermore, the increase in the complexity and effectiveness of students’ problem-solving strategies suggests a potential shift from basic strategies, such as means-end analysis, to advanced ones possibly resembling schema-driven approaches. This improvement may signal the acquisition of knowledge about water cycle processes.
The findings of this study align with and complement existing research on problem-solving. They also underscore the potential of using data-driven techniques to study problem-solving strategies on a finer time scale, which provides inspiration for further exploration of this topic. Future work should anchor data-driven investigations in education and psychology theories [15] in order to demonstrate their unique methodological contributions.
Limitations
The present study has limitations in its design and dataset. The absence of external measures, such as pre- and post-tests of geography knowledge and demographic surveys, limited our analysis to the learning process. As recommended by [51], it is crucial for researchers to connect GLA with outcome variables to enhance our understanding of the learning process. Without knowledge tests, distinguishing between the behaviors related to learning geography and those associated with learning the game’s rules becomes challenging.
The dataset posed challenges to the analysis. First, it lacked contextual information concerning the game, such as a list of all the cards currently available to the player, the distribution of water droplets on the board, and the real-time scores of both players. This contextual information is crucial for evaluating a specific action within its condition. When multiple choices are available, students may not initially select the best choice, but they may learn to do so through the acquisition of knowledge and the development of problem-solving strategies. [19] have argued that a comprehensive dataset, including time-stamped actions, events, context, player characteristics, and interviews, is required for game analytics. Second, the dataset lacked player IDs, which prevented us from tracking the history of all the games played by each player. Hence, we could not determine if a series of games was consecutively played by the same player. Having player IDs would be particularly beneficial for uncovering the learning trajectories of the problem-solving strategies used by players who engage in Water Cycle over extended periods.
Future Work
Using our dataset, future scholars could employ sequential analysis to illustrate the sequential patterns of problem-solving strategies. A comparative analysis of turns 1–10 and 11–30 could also be conducted. Moreover, the analytical approach of the present study could be applied to the entire dataset collected over 30 months.
Future work may also involve refining our study design and collecting new data. Incorporating pre- and post-tests of geography knowledge would enable a correlation analysis of students’ problem-solving behaviors and learning outcomes. Furthermore, including a standard demographic survey and a game experience survey would provide insights into the students’ problem-solving processes. Considering higher-order learning outcomes, such as knowledge transfer and problem posing, would also be valuable.
ACKNOWLEDGMENT
We would like to acknowledge the Field Day Lab at the University of Wisconsin–Madison for making this work possible.
REFERENCES
- Adams, D.M., Pilegard, C. and Mayer, R.E. 2015. Evaluating the cognitive consequences of playing portal for a short duration. Journal of Educational Computing Research. 54, 2 (Dec. 2015), 173–195.
- All, A., Nuñez Castellar, E.P. and Van Looy, J. 2015. Towards a conceptual framework for assessing the effectiveness of digital game-based learning. Computers & Education. 88, (Oct. 2015), 29–37.
- Anderson, J.R. 2021. Cognitive psychology and its implications. Worth Publishers.
- Anggraeni, L., Affandi, I., Wahyudin, D. Paramitha, S.T. and Ramadhan, M.G. 2022. Optimization of the Board Game as a Platform for the Concept of Peace Education: A Survey Method Study. International Journal of Education in Mathematics, Science and Technology. 10, 2, 497–511.
- Anzai, Y. and Simon, H. A. 1979. The theory of learning by doing. Psychological review. 86, 2, 124.
- Baker, R.S. and Clarke-Midura, J. 2013. Predicting successful inquiry learning in a virtual performance assessment for science. In Proceedings of the 21st International Conference on User Modeling, Adaptation, and Personalization. 203–214.
- Barab, S., Thomas, M., Dodge, T., Carteaux, R. and Tuzun, H. 2005. Making learning fun: Quest Atlantis, a game without guns. Educational Technology Research and Development. 53, 1 (Mar. 2005), 86–107.
- Carpenter, D., Emerson, A., Mott, B.W., Saleh, A., Glazewski, K.D., Hmelo-Silver, C.E. and Lester, J.C. 2020. Detecting off-task behavior from student dialogue in game-based collaborative learning. In Proceedings of Artificial Intelligence in Education: 21st International Conference, AIED 2020, Part I. (2020), 55–66.
- Chang, C.-C. and Johnson, T. 2020. Integrating heuristics and think-aloud approach to evaluate the usability of game-based learning material. Journal of Computers in Education. 8, 1 (Aug. 2020), 137–157.
- Chase, W.G. and Simon, H.A. 1973. Perception in chess. Cognitive Psychology. 4, 1 (Jan. 1973), 55–81.
- Chi, M.T., Feltovich, P.J. and Glaser, R. 1981. Categorization and representation of physics problems by experts and novices. Cognitive Science. 5, 2 (Apr. 1981), 121–152.
- Chi, M., Schwartz, D., Blair, K. P. and Chin, D. B. 2014. Choice-based Assessment: Can Choices Made in Digital Games Predict 6th-Grade Students' Math Test Scores?. In Proceedings of the 7th International Conference on Educational Data Mining (EDM '14). International Educational Data Mining Society. 36–43.
- Cooper, S., Khatib, F., Treuille, A., Barbero, J., Lee, J., Beenen, M., Leaver-Fay, A., Baker, D., Popović, Z. and players, F. 2010. Predicting protein structures with a multiplayer online game. Nature. 466, 7307 (Aug. 2010), 756–760.
- Fischer, C., Pardos, Z.A., Baker, R.S., Williams, J.J., Smyth, P., Yu, R., Slater, S., Baker, R. and Warschauer, M. 2020. Mining Big Data in education: Affordances and challenges. Review of Research in Education. 44, 1 (Mar. 2020), 130–160.
- Gašević, D., Kovanović, V. and Joksimović, S. 2017. Piecing the learning analytics puzzle: A consolidated model of a field of research and Practice. Learning: Research and Practice. 3, 1 (Jan. 2017), 63–78.
- Gick, M. L. 1986. Problem-solving strategies. Educational psychologist. 21, 1-2, 99-120.
- Gick, M.L. and Holyoak, K.J. 1983. Schema induction and Analogical Transfer. Cognitive Psychology. 15, 1 (Jan. 1983), 1–38.
- Horn, B., Hoover, A.K., Barnes, J., Folajimi, Y., Smith, G. and Harteveld, C. 2016. Opening the black box of play: Strategy analysis of an educational game. Proceedings of the 2016 Annual Symposium on Computer-Human Interaction in Play. (Oct. 2016), 142–153.
- Hooshyar, D., Yousefi, M. and Lim, H. 2018. Data-driven approaches to game player modeling: a systematic literature review. ACM Computing Surveys. 50, 6 (Jan. 2018), 1–19.
- Iten, N. and Petko, D. 2014. Learning with serious games: Is fun playing the game a predictor of learning success? British Journal of Educational Technology. 47, 1 (Nov. 2014), 151–163.
- Kai, S., Paquette, L., Baker, R. S., Bosch, N., D'Mello, S., Ocumpaugh, J., Shute, V. and Ventura, M. 2015. A Comparison of Video-Based and Interaction-Based Affect Detectors in Physics Playground. In Proceedings of the 8th International Conference on Educational Data Mining (EDM '15). International Educational Data Mining Society. 77–84.
- Käser, T., Hallinen, N.R. and Schwartz, D.L. 2017. Modeling exploration strategies to predict student performance within a learning environment and beyond. Proceedings of the Seventh International Learning Analytics & Knowledge Conference. (Mar. 2017), 31–40.
- Ke, F. F. and Shute, V. J. 2015. Serious games analytics: Chapter 13 Design of game-based stealth assessment and learning support. New York, NY: Springer.
- Kerr, D. 2015. Using data mining results to improve educational video game design. Journal of Educational Data Mining. 7, 3, 1–17.
- Koedinger, K. R., D'Mello, S., McLaughlin, E. A., Pardos, Z. A. and Rosé, C. P. 2015. Data mining and education. Cognitive Science. 6, 4, 333–353.
- Lei, H., Chiu, M.M., Wang, D., Wang, C. and Xie, T. 2022. Effects of game-based learning on students’ achievement in science: A meta-analysis. Journal of Educational Computing Research. 60, 6 (Feb. 2022), 1373–1398.
- Lin, C.F., Yeh, Y., Hung, Y.H. and Chang, R.I. 2013. Data mining for providing a personalized learning path in creativity: An application of decision trees. Computers & Education. 68, (Oct. 2013), 199–210.
- Liu, T. and Israel, M. 2022. Uncovering students’ problem-solving processes in game-based Learning Environments. Computers & Education. 182, (Jun. 2022), 104462.
- Loh, C.S. and Sheng, Y. 2014. Maximum similarity index (MSI): A metric to differentiate the performance of novices vs. multiple-experts in serious games. Computers in Human Behavior. 39, (Oct. 2014), 322–330.
- Martin, T., Petrick Smith, C., Forsgren, N., Aghababyan, A., Janisiewicz, P. and Baker, S. 2015. Learning fractions by splitting: Using learning analytics to illuminate the development of Mathematical Understanding. Journal of the Learning Sciences. 24, 4 (Aug. 2015), 593–637.
- Martinez-Garza, M.M. and Clark, D.B. 2017. Investigating epistemic stances in game play with Data Mining. International Journal of Gaming and Computer-Mediated Simulations (IJGCMS). 9, 3 (Jul. 2017), 1–40.
- Marty, J.-C. and Carron, T. 2011. Observation of collaborative activities in a game-based learning platform. IEEE Transactions on Learning Technologies. 4, 1 (Jan. 2011), 98–110.
- Mayer, R. 1992. Thinking, problem solving, cognition. W.H. Freeman.
- Mayer, R. E. 2019. Computer games in education. Annual review of psychology. 70, 531–549.
- Minnery, J. and Searle, G. 2013. Toying with the city? Using the computer game SimCity™ 4 in planning education. Planning Practice and Research. 29, 1 (Oct. 2013), 41–55.
- Minović, M., Milovanović, M., Šošević, U. and Conde González, M.Á. 2015. Visualisation of student learning model in serious games. Computers in Human Behavior. 47, (Jun. 2015), 98–107.
- Navarrete, C.C. 2013. Creative thinking in Digital Game Design and Development: A case study. Computers & Education. 69, (Nov. 2013), 320–331.
- Newell, A. and Simon, H.A. 1972. Human problem solving. Prentice-Hall.
- Owen, V. E., Roy, M. H., Thai, K. P., Burnett, V., Jacobs, D., Keylor, E. and Baker, R. S. 2019. Detecting Wheel-Spinning and Productive Persistence in Educational Games. In Proceedings of the 12th International Conference on Educational Data Mining (EDM '19). International Educational Data Mining Society. 378–383.
- Parong, J., Mayer, R.E., Fiorella, L., MacNamara, A., Homer, B.D. and Plass, J.L. 2017. Learning executive function skills by playing focused video games. Contemporary Educational Psychology. 51, (Oct. 2017), 141–151.
- Perrotta, C., Featherstone, G., Aston, H. and Houghton, E. 2013. Game-based learning: Latest evidence and future directions. Slough: nfer. 1-49.
- Plass, J. L., Homer, B. D. and Kinzer, C. K. 2015. Foundations of game-based learning. Educational psychologist. 50, 4, 258–283.
- Plass, J. L., Homer, B. D., Kinzer, C., Frye, J. and Perlin, K. 2011. Learning mechanics and assessment mechanics for games for learning. G4LI White Paper. 1, 2011.
- Rieber, L.P. 1996. Seriously considering play: Designing Interactive Learning Environments based on the blending of microworlds, simulations, and games. Educational Technology Research and Development. 44, 2 (Jun. 1996), 43–58.
- Sailer, M. and Homner, L. 2019. The gamification of learning: A meta-analysis. Educational Psychology Review. 32, 1 (Aug. 2019), 77–112.
- Shute, V. J. 2011. Stealth assessment in computer-based games to support learning. Computer games and instruction. 55, 2, 503–524.
- Shute, V.J., Smith, G., Kuba, R., Dai, C.-P., Rahimi, S., Liu, Z. and Almond, R. 2020. The design, development, and testing of learning supports for the physics playground game. International Journal of Artificial Intelligence in Education. 31, 3 (Apr. 2020), 357–379.
- Spires, H.A., Rowe, J.P., Mott, B.W. and Lester, J.C. 2011. Problem solving and game-based learning: Effects of middle grade students’ hypothesis testing strategies on learning outcomes. Journal of Educational Computing Research. 44, 4 (Jun. 2011), 453–472.
- Squire, K. 2007. The Ecology of Games: Connecting Youth, Games, and Learning: Open-ended video games: A model for developing learning for the interactive age. MacArthur Foundation Digital Media and Learning Initiative. Cambridge, MA: The MIT Press. 167–198.
- Tekinbas, K. S. and Zimmerman, E. 2003. Rules of play: Game design fundamentals: Chapter 6: Interactivity. MIT press.
- Tlili, A., Chang, M., Moon, J., Liu, Z., Chen, N.-S. and Kinshuk, K. 2021. A systematic literature review of empirical studies on learning analytics in Educational Games. International Journal of Interactive Multimedia and Artificial Intelligence. 7, 2 (2021).