ABSTRACT
Collaborative Problem Solving (CPS) is a crucial 21st-century skill for learning, workplace success, and addressing complex global issues. Team diversity, especially in digital environments, plays a key role in these activities. Although CPS involves dynamic communication behaviors, few studies have examined the impact of cultural diversity on the intricate discourse of CPS tasks. In this study, we analyze team conversations among \(N=129\) groups of four undergraduate students to explore the influence of cultural diversity on team cohesion and its potential to explain the relationship between cultural diversity and team performance. We introduce a novel measure of team cohesion based on the semantic similarity between message pairs within conversations, using a pre-trained MP-Net model and cosine similarity. We then use the average semantic similarity as a cohesion and social integration metric. An analysis of variance compares cohesion across different levels of cultural diversity, and a mediation analysis examines the relationship between cultural diversity and performance, with cohesion as the mediator. Our findings indicate that more diverse groups exhibit lower cohesion, and there is neither a direct nor an indirect relationship between cultural diversity and performance through cohesion. We discuss the implications of these findings and how they relate to group processes, as well as the future research directions for the EDM community.
Keywords: CPS, Cohesion, Cultural Diversity, NLP
1. INTRODUCTION AND BACKGROUND
Collaborative problem solving (CPS) is an essential 21st-century skill, involving individuals working together to solve complex problems through effective communication, division of labor, and collective negotiation [Burrus et al., 2013, OECD, 2013]. This skill enhances creativity and innovation in problem-solving due to diverse backgrounds and perspectives [OECD, 2013]. CPS is crucial not only in educational settings [Care et al., 2016, OECD, 2013, Graesser et al., 2017, Graesser et al., 2018] but also in the workplace, where it is increasingly vital due to the rise of online and remote communication [Fiore et al., 2018, Kniffin et al., 2021]. Employers highly value problem-solving, teamwork, and collaboration [McGunagle and Zizka, 2020, Sarkar et al., 2016]. Prior research has explored how team characteristics such as group size [Tausczik and Huang, 2019, Lu et al., 2012], diversity [Horwitz and Horwitz, 2007, Stahl et al., 2010, Dowell et al., 2019a, Dowell, 2019, Samadi et al., 2022], and member attributes [Leman, 2015, Kramer et al., 2014] affect team outcomes. Importantly, diversity in teams, encompassing both surface-level (e.g., gender, race) and deep-level attributes (e.g., personality, cognition), significantly impacts team collaboration and performance [Stahl et al., 2010, Wang et al., 2019].
Cohesion in teams has been characterized by the unity and attraction among team members. Cohesion plays a crucial role in a team’s effectiveness and distinguishes a cohesive group from a mere collection of individuals [Forsyth, 2018]. This critical element of effective teams enhances the team’s ability to succeed and manage conflicts, influenced by mutual attraction and productivity among team members. The presence of cohesion not only improves the work environment by enhancing member satisfaction and reducing stress but also presents challenges such as emotional demand and potential for conformity, which may affect decision-making and conflict resolution [Forsyth, 2018, Beal et al., 2003, Salas et al., 2015, Hoyle and Crawford, 1994, Forsyth and Elliott, 1999, Janis, 1972, Pepitone and Reichling, 1955]. The correlation between cohesion and team performance, demonstrated by enhanced coordination and a shared mental model, underscores the complexity of team dynamics where cohesion and diversity intersect, leading to varied effects on performance.
The relationship between diversity and cohesion exhibits complexity, where task-related diversity generally shows positive effects, whereas demographic diversity presents mixed outcomes. Cultural diversity, crucial in global teams, not only enhances creativity but also introduces challenges such as increased conflict and reduced cohesion, which significantly impact team dynamics, especially in digitally mediated and short-term interactions [Horwitz and Horwitz, 2007, Stahl et al., 2010, Stahl and Maznevski, 2021, Harrison et al., 1998, Bell et al., 2011]. The reduced cohesion in highly diverse teams, due to less common ground among members, affects the overall team dynamics [Janis, 1972, Goodman et al., 1987, Gully et al., 1995, Beal et al., 2003, Liang et al., 2015, Williams and O’Reilly III, 1998]. These dynamics emphasize the mediating role of cohesion between cultural diversity and performance, preparing the ground for leveraging advanced methodologies to analyze these intricate relationships.
Advances in Natural Language Processing (NLP) offer innovative tools for dynamically and organically assessing cohesion, shifting away from traditional questionnaire methods like the Group Environment Questionnaire (GEQ) [Carron et al., 1985, Klonek et al., 2019, Graesser et al., 2011, Dowell et al., 2019b, ?]. The use of NLP and AI methods such as Latent Semantic Analysis [Landauer et al., 1998], Latent Dirichlet Allocation [Blei et al., 2003], and Word2vec [Mikolov et al., 2013] for studying group dynamics and interactions highlights a significant transition from survey-based observations to automated measurements [von Davier, 2017, Dowell et al., 2015, Dowell et al., 2016, Poquet et al., 2018]. These methodologies have been facilitating the study of group dynamics and cohesion through discourse, aiming to automate the quantification of group dynamics and, more specifically, cohesion measurements [Graesser et al., 2011, Crossley et al., 2019, Putra and Tokunaga, 2017, Mesgar and Strube, 2018]. As a result, NLP tools like Coh-Metrix [Graesser et al., 2011], and TAACO [Crossley et al., 2019] were developed, providing researchers with multilevel linguistic features that allow the study of group dynamics and cohesion through group discourse effectively. This shift underscores the potential of NLP to provide new insights into the complex effects of diversity on team dynamics.
This study explores the interplay between team diversity and performance, focusing on group cohesion as a crucial mediator. We employ the MP-Net language model to analyze semantic overlap in team conversations, assessing the impact of cultural diversity on cohesion and performance. We hypothesize that increased cultural diversity reduces cohesion due to differences in backgrounds, values, and communication styles, potentially hindering group interactions. Previous research shows mixed results regarding the effects of diversity on performance and cohesion, highlighting the complexity of group dynamics. This study aims to enhance understanding of diverse team dynamics and demonstrate the value of NLP methodologies in analyzing group communication. The research questions are:
- Is cultural diversity in teams associated with lower cohesion in their conversations?
- Does cultural diversity have a significant association with performance and does cohesion mediate this relationship?
2. METHODS
2.1 Participants
A total of \(N = 514\) undergraduate students from a large university in the southwest U.S. participated in the study. Participants were randomly assigned into teams to take part in a Hidden Profile CPS task (described below). In total, \(N = 129\) teams were included in the study. Teams are predominantly four-person groups, with a few exceptions that consist of three or five people. In this study, we consider four-person groups only for the sake of consistency in analysis. Over half of our participants were female (\(N = 347\)), and the majority of the participants were freshmen (\(N = 342\)) or juniors (\(N = 128\)). Of those participants who reported their race and ethnicity (497 out of 514), 62 (12%) of the participants were White, 9 (1.7%) were Black or African American, 209 (40.6%) were Asian or Asian American, 162 (31.5%) were Hispanic or Latino, and 9 (1.7%) were multiracial. Additionally, over half of the students (\(N = 277\)) identified as first-generation students.
2.2 Procedure
Participants were randomly assigned into teams of four individuals to complete a decision-making task on the Education Platform for Collaborative Assessment and Learning (EPCAL) [Hao et al., 2017]. EPCAL is a platform by the Educational Testing Service (ETS) that provides a collaboration space for participants to communicate, for teachers or organizers to manage the participants and team formations, and for researchers to study team collaboration in a computer-mediated environment. Prior to beginning the task, participants were asked to complete a background survey to collect information on race, gender, education level, and native language. Next, students were prompted with a problem (e.g., “choose the best apartment”) and were asked to rank three options based on positive features (e.g., “this apartment is at a prime location”) and negative features (e.g., “the rent is expensive”). Teams were randomly assigned to one of four decision-making scenarios, including ranking apartments, professors, party venues, and job candidates. Each individual was provided with different features relevant to the problem. In the team discussion phase, participants synchronously chatted with other teammates to share information that they held in order to achieve the optimal ranking. The group communicated through text, and their communication lasted for 20 minutes.
2.3 Group Measurements
CPS Performance ScoringThe scoring scheme in this CPS task is on two levels, full points (2) and partial points (1). This task involves ranking three options of apartments, professors, party venues, and job candidates based on positive and negative information shared with them about the options. Therefore, each group’s answer is a sequence of three letters of A, B, and C with respect to each option provided. For example, an answer of BAC means that they are ranking B as the best option, A as the second best option, and C as the worst. Groups were given full points if they had submitted the correct order and partial points if they had found the best option only.
Cultural DiversityWe quantified cultural diversity based on the heterogeneity of ethnic identities. To determine the cultural diversity level, we calculated how many unique ethnicities existed in each group according to the student’s self-reported demographic information. Since groups consist of four members, there were four possible levels of group diversity ranging from fully homogeneous groups (coded as 1) to fully heterogeneous groups (coded as 4).
2.4 Cohesion
To assess group cohesion, we employ the method of semantic similarity analysis among participants’ text messages, positing that higher semantic similarities correlate with increased group cohesion. Semantic similarity is quantified using Natural Language Processing (NLP) models such as Latent Semantic Analysis [Landauer et al., 1998] and Word2vec [Mikolov et al., 2013]. These models encode sentences into vectors within a semantic space, ensuring that sentences with similar content yield similar vector representations. The similarity between these vector representations is measured using metrics like cosine similarity or Euclidean distance, with similarity scores ranging from 0 to 1, where 1 signifies maximum similarity. This methodology has been effectively applied in diverse research areas in education for tasks such as phase detection, role emergence in teams, and analysis of emotional language use [Harrison et al., 2022, Dowell and Poquet, 2021, Dowell et al., 2019b, Martínez-Huertas et al., 2021].
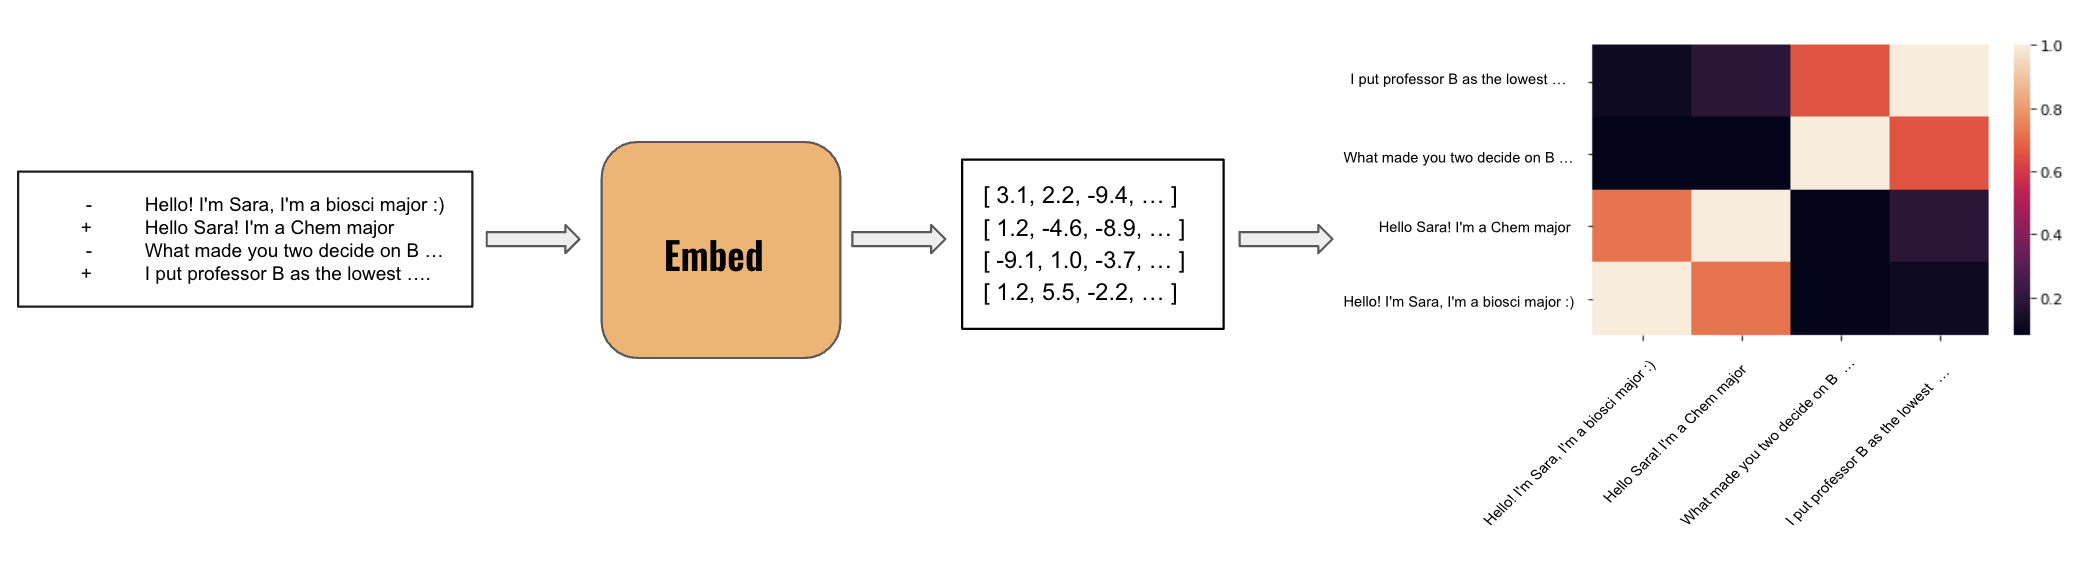
For semantic similarity extraction, we utilize the MPNet pre-trained model [Song et al., 2020], renowned for its superior performance in sentence-level semantic tasks. Trained on datasets comprising pairs of semantically similar or dissimilar sentences, MPNet excels in identifying linguistic features indicative of semantic similarity. This model encodes sentences into a semantic space, where the vector representation of each sentence encapsulates its semantic content. Through this process, MPNet effectively maps sentences to vectors in a high-dimensional space, tuned to capture semantic nuances accurately [Song et al., 2020]. To aggregate individual sentence similarities into a cohesive group measure, we construct a semantic similarity matrix from the conversation messages, analogous to a covariance matrix. In a conversation with \(n\) messages, an \(n \times n\) matrix \(R\) is formulated, where each element \(R_{i,j}\) represents the semantic similarity between the \(i^{th}\) and the \(j^{th}\) messages. This matrix not only quantifies overall group cohesion but also facilitates the temporal visualization of cohesion within the group. A visual overview of this process is shown in 1.
2.5 Cosine Similarity
As discussed in Section 2.4, by using a pre-trained language model, each sentence is represented by a vector in the semantic space that is optimized to find similar sentence pairs. Next, in order to find semantic similarity, we will be using cosine similarity as a measure of similarity among the sentences. For each pair of vectors, their cosine similarity is the cosine of the angle between them, equivalent to their dot product. The more similar the two vectors are, the smaller the angle between them is, and therefore, the cosine of that angle is larger. Thus, more similar vectors have higher cosine similarity. This range of similarity is equal to the range of cosine (-1, 1), and therefore, orthogonal vectors have a similarity of 0, parallel vectors in a similar direction have a similarity of 1, and parallel vectors in opposite directions have a similarity of -1.
\begin {equation} \operatorname S_{C}(A, B):=\cos (\theta )=\frac {\mathbf {A} \cdot \mathbf {B}}{\|\mathbf {A}\|\|\mathbf {B}\|}=\frac {\sum _{i=1}^{n} A_{i} B_{i}}{\sqrt {\sum _{i=1}^{n} A_{i}^{2}} \sqrt {\sum _{i=1}^{n} B_{i}^{2}}}, \end {equation}
2.6 Statistical Analysis
To address the first research question, we used the Analysis of Variance (ANOVA) of group cohesion values across different levels of cultural diversity. Groups were classified according to their cultural diversity level, and the four resulting cohesion values and the significance of cohesion among these groups were tested. For post-hoc analysis, we used a pairwise t-test with Bonferroni p-value adjustments. Both analyses are done through the stats package in R. 1 2
To answer the second research question, we first look into the possible relationships between cultural diversity and performance. We did so by doing a linear regression with cultural diversity as an independent variable and students’ performance as an outcome. Moreover, to further explore the second research question, we conducted a mediation analysis with cohesion as a mediator. This mediation was also interpreted based on the [Zhao et al., 2010] framework of mediation analysis. We used the mediation analysis implementation of the Pingouin package in Python for this analysis 3. The alpha level is set at 0.05 and two-sided, and the number of bootstraps is set at 500 re-samples.
3. RESULTS
Analyzing the effects of cultural diversity on team collaboration, we observed distinct patterns across four levels of cultural diversity (CDL) in terms of Cohesion, Performance, and Discussion Time. Teams with the highest cultural diversity (CDL 4) exhibited the lowest cohesion (\(M = 0.146, SD = 0.01\)) but reported the highest performance (\(M = 0.59, SD = 0.86\)), with notably longer discussion times (19.02 minutes). Minor cohesion variations were noted across other diversity levels, indicating a nuanced impact of cultural diversity on team dynamics. These descriptive statistics are summarized in Table 1.
| Cultural Diversity Level (CDL)
| |||||
|---|---|---|---|---|---|
| 1 | 2 | 3 | 4 | Full Sample | |
| Measures | \(M(SD)\) | \(M(SD)\) | \(M(SD)\) | \(M(SD)\) | \(M(SD)\) |
| Cohesion | 0.178 (0.04) | 0.183 (0.04) | 0.175 (0.04) | 0.146 (0.01) | 0.175 (0.04) |
| Performance | 0.21 (0.57) | 0.40 (0.75) | 0.43 (0.65) | 0.59 (0.86) | 0.42 (0.70) |
| Discussion Time | 715.15 (183.38) | 727.34 (358.15) | 885.42 (431.21) | 1141.0 (285.84) | 850.47 (404.31) |
| \(M\) = Mean, \(SD\) = Standard Deviation | |||||
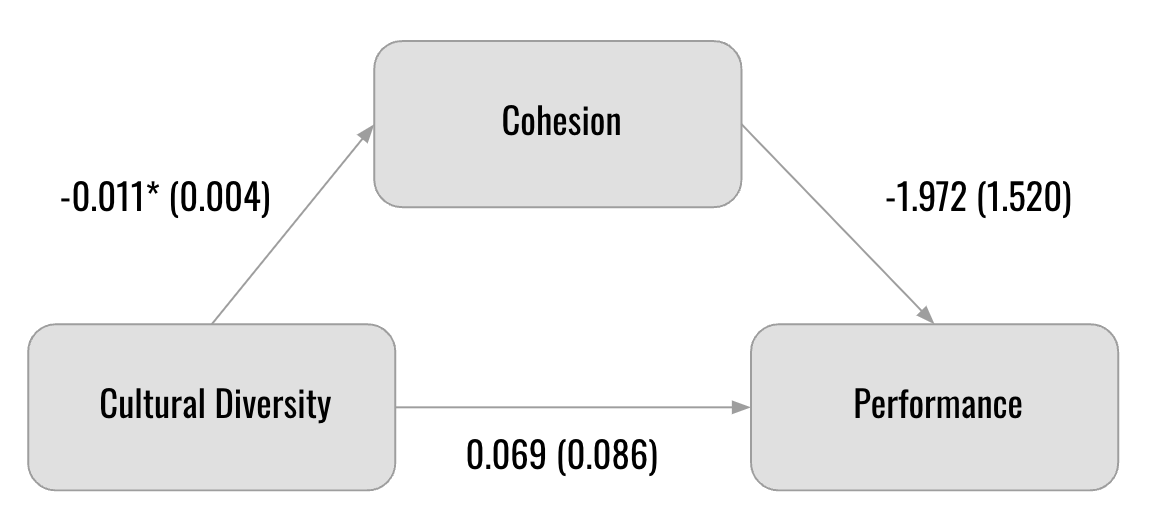
An ANOVA test highlighted a significant effect of cultural diversity on group cohesion (\(F(3, 125) = 2.84, p = 0.04\)), with further analysis via a pairwise t-test confirming these differences (detailed in Tables 3 and 2). However, exploring the relationship between cultural diversity and performance through linear regression and mediation analysis revealed an inconclusive direct relationship (\(\beta = 0.09, p = 0.3\)), but indicated a significant negative impact of cultural diversity on cohesion (\(\beta = -0.01, p = 0.02\)). The mediation analysis suggested that while the direct path from diversity to performance was not significant, the indirect effects through cohesion were also inconclusive, negating substantial indirect mediation (results presented in Table 4 and Figure 2).
| Cohesion | |||
|---|---|---|---|
| Diversity | 1 | 2 | 3 |
| 2 | 1.00 | - | - |
| 3 | 1.00 | 1.00 | - |
| 4 | 0.51 | \(0.03^{\ *}\) | \(0.10_{\ .}\) |
| Df | Sum Sq | Mean Sq | F value | Pr | |
|---|---|---|---|---|---|
| Diversity | 3 | 0.013 | 0.004 | 2.836 | 0.04 * |
| Residuals | 125 | 0.197 | 0.002 | ||
| Signif. codes: 0 ‘***’ 0.001 ‘**’ 0.01 ‘*’ 0.05 ‘.’ 0.1 ‘ ’ 1
| |||||
| df = degrees of freedom, sum sq = sum of squares,
| |||||
| mean sq = mean of squares, p = p-value
| |||||
| path | \(coef (se)\) | \(p\) | \(CI[2.5\%]\) | \(CI[97.5\%]\) |
|---|---|---|---|---|
| cohesion \(\sim \) diversity | \(-0.01 (0.00)\) | \(0.02^{\ *}\) | \(-0.02\) | \(-0.001\) |
| performance \(\sim \) cohesion | \(-1.97 (1.52)\) | \(0.20\ \ \) | \(-4.98\) | \(1.04\) |
| Total | \(0.09 (0.08)\) | \(0.30\ \ \) | \(-0.08\) | \(0.25\) |
| Direct | \(0.07 (0.08)\) | \(0.42\ \ \) | \(-0.10\) | \(0.24\) |
| Indirect | \(0.02 (0.02)\) | \(0.30\ \ \) | \(-0.02\) | \(0.07\) |
| \(se\) = Standard Error, \(p\) = \(p\)-value, \(CI\) = Confidence Interval | ||||
4. DISCUSSION
Regarding research question 1, we found a statistically significant impact of cultural diversity on group cohesion. More specifically, the post-hoc analysis highlighted the difference primarily emanating from the most diverse group (level 4) compared to level 2 (\(p = 0.03*\)) and level 3 (\(p = 0.1\)). It’s pivotal to acknowledge a potential influencing factor in these results. The underrepresentation of CDL 4 in our dataset raises concerns about the generalizability of our findings. If researchers work with a more balanced dataset in the future, the significant differences associated with CDL 4 might not remain consistent. This caveat emphasizes the importance of a diversified dataset to ensure findings are representative and replicable.
In response to research question 2, the mediation analysis was employed to explore the mechanisms through which cultural diversity might influence group performance. The visual representation of this mediation model is elucidated in 2. While cultural diversity exhibits a clear and significant influence on group cohesion, the implications of this reduced cohesion on group performance are less straightforward. The 2 suggests that the decreased cohesion doesn’t directly translate to a proportional impact on performance. This presents an intriguing scenario. While one might intuitively assume that greater cohesion would lead to better performance, the data doesn’t necessarily support this. One possibility is that while higher cultural diversity reduces cohesion, the richness and diversity of perspectives it introduces might offset the impact of reduced cohesion on performance. This could potentially explain why the direct relationship between cohesion and performance, as well as the direct link between cultural diversity and performance, appear to be negligible in the current model.
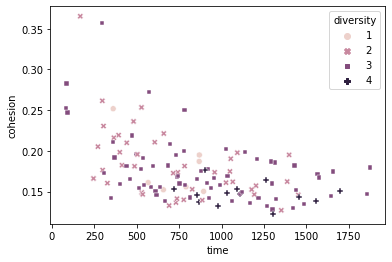
Teams often prioritize establishing common ground and reaching a consensus, especially in decision-making. This emphasis is even more pronounced in CPS, particularly in our study’s context, where teams grapple with a decision-making challenge. The concept of “groupthink” [Janis, 1972], where team members hesitate to voice contradictory ideas for fear of compromising group cohesion, underscores this point. Yet, diverse groups might be less prone to this phenomenon. Teams with pronounced diversity tend to have less common ground due to differences in backgrounds or cognitive styles, leading to reduced cohesion. This environment fosters greater freedom in idea exchange, encouraging innovation. Our findings resonate with this observation, suggesting that teams with more cultural diversity exhibit diminished cohesion levels. Additionally, our prior research associated cultural diversity with heightened entropy, indicating increased complexity and randomness in CPS discussions, aligning with the reduced cohesion in diverse groups [Samadi et al., 2022]. To further explore this idea, we looked at the correlation between cohesion and team discussion time and the visual scatter plot (Figure 3). The results show a negative correlation (Pearson correlation) between the discussion time and team cohesion (\(r (127) = −0.50, p < .001\)), where teams with higher cohesion spent less time discussing ideas, which supports this hypothesis.
The correlation between cultural diversity and performance revealed a direct link in a non-mediated linear regression model, a finding buttressed by existing literature [Horwitz and Horwitz, 2007, Stahl et al., 2010]. This relationship is a “double-edged sword,” offering both benefits and setbacks to team outcomes, rendering the direct relationship’s direction ambiguous. Consequently, several studies have endeavored to disentangle these intertwined effects, spotlighting mediators to explicate the relationship. We posited team cohesion as a mediator, aiming to clarify the nexus between cultural diversity and team performance for potential indirect mediation. Although the cohesion-performance relationship remains statistically nebulous, it denotes a negative tilt.
These findings emphasize the nuanced dynamics of group interactions, especially in culturally diverse settings. They suggest that cohesion, while important, is just one of many factors that influence performance, and its impact may vary depending on the context and the nature of the task at hand.
4.1 Limitations and Future-research
This study highlights several key areas affecting its findings. Firstly, the complex nature of cohesion means its quantification through semantic similarity might not capture its full spectrum, suggesting a more nuanced approach could enhance our understanding. Cohesion’s variability over time also indicates its effects on team performance can shift, underlining the need to consider its temporal dynamics.
A notable limitation is the use of ethnicity as a stand-in for cultural identity, which may not accurately reflect the diversity within ethnic groups. This oversimplification could skew results, pointing to the benefit of separately analyzing ethnicity and cultural identity in future work.
The study’s reliance on text-based communication could limit insights into team dynamics that other forms of communication might reveal. Additionally, evaluating team outcomes solely by performance overlooks other important factors like member satisfaction, suggesting a broader approach could yield a more comprehensive view of the impacts of cultural diversity and cohesion.
In summary, our research delves into how cultural diversity affects group performance, with cohesion playing a mediating role, using MP-Net to assess cohesion through semantic overlap. The findings urge further exploration into cultural diversity’s role in group dynamics and how advanced NLP techniques can better capture and understand these complex relationships.
5. ACKNOWLEDGEMENTS
This research was supported by The Gates Foundation (#INV - 000752) and The Andrew W. Mellon Foundation (1806-05902). The authors would like to thank the Next Generation Undergraduate Success Measurement Project team members for help with data collection. Thanks to Educational Testing Services for the experiment information.
6. REFERENCES
- Beal, D. J., Cohen, R. R., Burke, M. J., and McLendon, C. L. (2003). Cohesion and performance in groups: a meta-analytic clarification of construct relations. Journal of applied psychology, 88(6):989. [Bell et al., 2011]
- Bell, S. T., Villado, A. J., Lukasik, M. A., Belau, L., and Briggs, A. L. (2011). Getting specific about demographic diversity variable and team performance relationships: A meta-analysis. Journal of management, 37(3):709–743. [Blei et al., 2003]
- Blei, D. M., Ng, A. Y., and Jordan, M. I. (2003). Latent dirichlet allocation. Journal of machine Learning research, 3(Jan):993–1022. [Burrus et al., 2013]
- Burrus, J., Jackson, T., Xi, N., and Steinberg, J. (2013). Identifying the most important 21st century workforce competencies: An analysis of the occupational information network (o* net). ETS Research Report Series, 2013(2):i–55. [Care et al., 2016]
- Care, E., Scoular, C., and Griffin, P. (2016). Assessment of collaborative problem solving in education environments. Applied Measurement in Education, 29(4):250–264. [Carron et al., 1985]
- Carron, A. V., Widmeyer, W. N., and Brawley, L. R. (1985). The development of an instrument to assess cohesion in sport teams: The group environment questionnaire. Journal of Sport and Exercise psychology, 7(3):244–266. [Crossley et al., 2019]
- Crossley, S. A., Kyle, K., and Dascalu, M. (2019). The tool for the automatic analysis of cohesion 2.0: Integrating semantic similarity and text overlap. Behavior research methods, 51(1):14–27. [Dowell, 2019]
- Dowell, N. (2019). Preparing for the future: Group communication analysis as a tool to facilitate adaptive support during digitally-mediated team interactions. In Proceedings of the 3rd International Conference on AI+ Adaptive Education. [Dowell et al., 2019a]
- Dowell, N., Lin, Y., Godfrey, A., and Brooks, C. (2019a). Promoting inclusivity through time-dynamic discourse analysis in digitally-mediated collaborative learning. In International Conference on Artificial Intelligence in Education, pages 207–219. Springer. [Dowell et al., 2016]
- Dowell, N. M., Graesser, A. C., and Cai, Z. (2016). Language and discourse analysis with coh-metrix: Applications from educational material to learning environments at scale. Journal of Learning Analytics, 3(3):72–95. [Dowell et al., 2019b]
- Dowell, N. M., Nixon, T. M., and Graesser, A. C. (2019b). Group communication analysis: A computational linguistics approach for detecting sociocognitive roles in multiparty interactions. Behavior research methods, 51(3):1007–1041. [Dowell and Poquet, 2021]
- Dowell, N. M. and Poquet, O. (2021). Scip: Combining group communication and interpersonal positioning to identify emergent roles in scaled digital environments. Computers in Human Behavior, 119:106709. [Dowell et al., 2015]
- Dowell, N. M., Skrypnyk, O., Joksimovic, S., Graesser, A. C., Dawson, S., Gaševic, D., Hennis, T. A., de Vries, P., and Kovanovic, V. (2015). Modeling learners’ social centrality and performance through language and discourse. International Educational Data Mining Society. [Fiore et al., 2018]
- Fiore, S. M., Graesser, A., and Greiff, S. (2018). Collaborative problem-solving education for the twenty-first-century workforce. Nature human behaviour, 2(6):367–369. [Forsyth, 2018]
- Forsyth, D. R. (2018). Group dynamics. Cengage Learning. [Forsyth and Elliott, 1999]
- Forsyth, D. R. and Elliott, T. R. (1999). Group dynamics and psychological well-being: The impact of groups on adjustment and dysfunction. [Goodman et al., 1987]
- Goodman, P. S., Ravlin, E., and Schminke, M. (1987). Understanding groups in organizations. Research in organizational behavior. [Graesser et al., 2017]
- Graesser, A. C., Dowell, N., and Clewley, D. (2017). Assessing collaborative problem solving through conversational agents. In Innovative assessment of collaboration, pages 65–80. Springer. [Graesser et al., 2018]
- Graesser, A. C., Dowell, N., Hampton, A. J., Lippert, A. M., Li, H., and Shaffer, D. W. (2018). Building intelligent conversational tutors and mentors for team collaborative problem solving: Guidance from the 2015 program for international student assessment. In Building intelligent tutoring systems for teams. Emerald Publishing Limited. [Graesser et al., 2011]
- Graesser, A. C., McNamara, D. S., and Kulikowich, J. M. (2011). Coh-metrix: Providing multilevel analyses of text characteristics. Educational researcher, 40(5):223–234. [Gully et al., 1995]
- Gully, S. M., Devine, D. J., and Whitney, D. J. (1995). A meta-analysis of cohesion and performance: Effects of level of analysis and task interdependence. Small group research, 26(4):497–520. [Hao et al., 2017]
- Hao, J., Liu, L., von Davier, A. A., Lederer, N., Zapata-Rivera, D., Jakl, P., and Bakkenson, M. (2017). Epcal: Ets platform for collaborative assessment and learning. ETS Research Report Series, 2017(1):1–14. [Harrison et al., 1998]
- Harrison, D. A., Price, K. H., and Bell, M. P. (1998). Beyond relational demography: Time and the effects of surface-and deep-level diversity on work group cohesion. Academy of management journal, 41(1):96–107. [Harrison et al., 2022]
- Harrison, J., Jain, S. A., Dunbar, T., Gorman, J., and Varma, S. (2022). Toward automated detection of phase changes in team collaboration. In Proceedings of the Annual Meeting of the Cognitive Science Society, volume 44. [Horwitz and Horwitz, 2007]
- Horwitz, S. K. and Horwitz, I. B. (2007). The effects of team diversity on team outcomes: A meta-analytic review of team demography. Journal of management, 33(6):987–1015. [Hoyle and Crawford, 1994]
- Hoyle, R. H. and Crawford, A. M. (1994). Use of individual-level data to investigate group phenomena issues and strategies. Small Group Research, 25(4):464–485. [Janis, 1972]
- Janis, I. L. (1972). Victims of groupthink: A psychological study of foreign-policy decisions and fiascoes. Boston: Houghton, Mifflin. [Klonek et al., 2019]
- Klonek, F., Gerpott, F. H., Lehmann-Willenbrock, N., and Parker, S. K. (2019). Time to go wild: How to conceptualize and measure process dynamics in real teams with high-resolution. Organizational Psychology Review, 9(4):245–275. [Kniffin et al., 2021]
- Kniffin, K. M., Narayanan, J., Anseel, F., Antonakis, J., Ashford, S. P., Bakker, A. B., Bamberger, P., Bapuji, H., Bhave, D. P., Choi, V. K., et al. (2021). Covid-19 and the workplace: Implications, issues, and insights for future research and action. American psychologist, 76(1):63. [Kramer et al., 2014]
- Kramer, A., Bhave, D. P., and Johnson, T. D. (2014). Personality and group performance: The importance of personality composition and work tasks. Personality and Individual Differences, 58:132–137. [Landauer et al., 1998]
- Landauer, T. K., Foltz, P. W., and Laham, D. (1998). An introduction to latent semantic analysis. Discourse processes, 25(2-3):259–284. [Leman, 2015]
- Leman, P. J. (2015). How do groups work? age differences in performance and the social outcomes of peer collaboration. Cognitive science, 39(4):804–820. [Liang et al., 2015]
- Liang, H.-Y., Shih, H.-A., and Chiang, Y.-H. (2015). Team diversity and team helping behavior: The mediating roles of team cooperation and team cohesion. European Management Journal, 33(1):48–59. [Lu et al., 2012]
- Lu, L., Yuan, Y. C., and McLeod, P. L. (2012). Twenty-five years of hidden profiles in group decision making: A meta-analysis. Personality and Social Psychology Review, 16(1):54–75. [Martínez-Huertas et al., 2021]
- Martínez-Huertas, J. Á., Jorge-Botana, G., and Olmos, R. (2021). Emotional valence precedes semantic maturation of words: A longitudinal computational study of early verbal emotional anchoring. Cognitive Science, 45(7):e13026. [McGunagle and Zizka, 2020]
- McGunagle, D. and Zizka, L. (2020). Employability skills for 21st-century stem students: the employers’ perspective. Higher Education, Skills and Work-Based Learning. [Mesgar and Strube, 2018]
- Mesgar, M. and Strube, M. (2018). A neural local coherence model for text quality assessment. In Proceedings of the 2018 conference on empirical methods in natural language processing, pages 4328–4339. [Mikolov et al., 2013]
- Mikolov, T., Sutskever, I., Chen, K., Corrado, G. S., and Dean, J. (2013). Distributed representations of words and phrases and their compositionality. Advances in neural information processing systems, 26. [OECD, 2013]
- OECD (2013). Pisa 2015 collaborative problem solving framework. [Pepitone and Reichling, 1955]
- Pepitone, A. and Reichling, G. (1955). " group cohesiveness and the expression of hostility." hum. [Poquet et al., 2018]
- Poquet, O., Dowell, N., Brooks, C., and Dawson, S. (2018). Are mooc forums changing? In Proceedings of the 8th International Conference on Learning Analytics and Knowledge, pages 340–349. [Putra and Tokunaga, 2017]
- Putra, J. W. G. and Tokunaga, T. (2017). Evaluating text coherence based on semantic similarity graph. In Proceedings of TextGraphs-11: the Workshop on Graph-based Methods for Natural Language Processing, pages 76–85. [Salas et al., 2015]
- Salas, E., Grossman, R., Hughes, A. M., and Coultas, C. W. (2015). Measuring team cohesion: Observations from the science. Human factors, 57(3):365–374. [Samadi et al., 2022]
- Samadi, M. A., Cavazos, J. G., Lin, Y., and Nixon, N. (2022). Exploring cultural diversity and collaborative team communication through a dynamical systems lens. International Educational Data Mining Society. [Sarkar et al., 2016]
- Sarkar, M., Overton, T., Thompson, C., and Rayner, G. (2016). Graduate employability: Views of recent science graduates and employers. International Journal of Innovation in Science and Mathematics Education, 24(3). [Song et al., 2020]
- Song, K., Tan, X., Qin, T., Lu, J., and Liu, T.-Y. (2020). Mpnet: Masked and permuted pre-training for language understanding. Advances in Neural Information Processing Systems, 33:16857–16867. [Stahl and Maznevski, 2021]
- Stahl, G. K. and Maznevski, M. L. (2021). Unraveling the effects of cultural diversity in teams: A retrospective of research on multicultural work groups and an agenda for future research. Journal of International Business Studies, 52(1):4–22. [Stahl et al., 2010]
- Stahl, G. K., Maznevski, M. L., Voigt, A., and Jonsen, K. (2010). Unraveling the effects of cultural diversity in teams: A meta-analysis of research on multicultural work groups. Journal of international business studies, 41(4):690–709. [Tausczik and Huang, 2019]
- Tausczik, Y. and Huang, X. (2019). The impact of group size on the discovery of hidden profiles in online discussion groups. ACM Transactions on Social Computing, 2(3):1–25. [von Davier, 2017]
- von Davier, A. A. (2017). Computational psychometrics in support of collaborative educational assessments. [Wang et al., 2019]
- Wang, J., Cheng, G. H.-L., Chen, T., and Leung, K. (2019). Team creativity/innovation in culturally diverse teams: A meta-analysis. Journal of Organizational Behavior, 40(6):693–708. [Williams and O’Reilly III, 1998]
- Williams, K. Y. and O’Reilly III, C. A. (1998). Demography and. Research in organizational behavior, 20:77–140. [Zhao et al., 2010]
- Zhao, X., Lynch Jr, J. G., and Chen, Q. (2010). Reconsidering baron and kenny: Myths and truths about mediation analysis. Journal of consumer research, 37(2):197–206.