ABSTRACT
In the context of rapid urbanization, India, as a developing nation, faces challenges and opportunities. The key to societal resilience is creating inclusive and sustainable built infrastructure that is integral to the concept of livability. Livability, covering factors like water, food, housing, transport, healthcare, and education, emphasizes the crucial role of education in building a resilient society. This study underscores the urgent need for inclusive education, a global imperative addressing challenges faced by a sizable population with disabilities. Education, a fundamental service, is pivotal for social justice, inclusion, and equal access, aligning with the UN's Sustainable Development Goal 4 and India’s National Educational Plan 2020. This study examines the significance of key indicators for effective inclusive education (IEIE) in the primary schools of Delhi, considering the inclusion of children with disabilities (CwDs), and ranking the same. A paper-based primary survey was taken, and stakeholders from primary school rated the indicators on a five-point Likert scale. Data underwent analysis using established Multi-Criteria Decision Analysis (MCDA): Technique for Order Preference by Similarity to Ideal Solution (TOPSIS) analysis to assess potential variations in derived rankings of indicators. Results consistently show that stakeholders prioritize qualitative aspects of inclusive education, challenging the belief that financial and administrative support is a primary concern in emerging nations like India. The results support the need for improving inclusive education facilities in and surrounding schools, increasing the inclusion of CwDs, and raising awareness among the stakeholders of schools in the study area.
Keywords
INTRODUCTION
India, celebrated as the largest democracy, confronts numerous hurdles in ensuring educational access for over 200 million children aged six to 13 [46]. The dropout rates in India average 4.13% for primary, 4.03% for upper primary, and 17.06% for secondary students [31]. Among contemporary challenges is the dropout rate among children with disabilities (CwDs), who constitute around 47 million of the 301.4 million unenrolled or dropout children. The Census of India 2011 discloses that 1.05% of school-age children (2.13 million) have disabilities, with 28% (588,000) not attending school, notably, 44% of CwDs who are not in school face complex activity limitations and functional challenges [6]. Since they hardly ever go beyond primary school, just 9% of CwDs complete secondary school [40]. Despite the implementation of inclusive education policies such as Education for All [41], Right to Education Act [36], The Rights of Persons with Disabilities (RPWD) Act [37], and National Education Plan (NEP) [29] over the past two decades, a comprehensive, practical approach to implementing inclusive education principles remains elusive. Factors such as poverty, limited accessibility, and the scarcity of inclusive schools significantly contribute to school dropout rates in India [28]. The promotion of inclusive education is crucial for fostering the participation of individuals with disabilities in society, beginning from the primary level.
The efficacy of inclusive education for children with disabilities (CwDs), relies not just on factors like school size, location, and facilities but also on indicators of effective inclusive education (IEIE) within the school environment. Several researchers have underscored the importance of IEIE in promoting the integration of CwDs into mainstream schools. These studies include works such as "Measuring Concerns about Integrating Education in India" [44], "Measuring Indicators of Inclusive Education"[25], "The Concerns about Inclusive Education Scale" [27], "Development of a Set of Indicators for Inclusive Education in Europe" [22], a process for developing and validating disability-inclusive indicators [45], School and classroom indicators of inclusive education [23], and "Enabling Inclusive Education in Hong Kong" [18]. Key components of inclusive schooling include adequate funding, extensive teacher training, public awareness, and fostering a positive attitude [1]. The importance of understanding laws and policies related to CwDs' inclusion stressed by [2], while the significance of creating an accessible built environment in India by [30].
Several investigations have employed various statistical techniques to assess rating data, including the "application of the Relative to an Identified Distribution Integral Transformation (RIDIT) method to Likert scale surveys" [35, 43], the "consumer satisfaction index (CSI)" [14], RIDIT analysis [4, 5, 52], grey relation analysis (GRA) [7, 12, 21], Technique for Order Preference by Similarity to Ideal Solution (TOPSIS) analysis [13, 26, 49], the Pedestrian Level of Service (PLOS) model [33], and "priority on qualitative attributes of transfer facility" [38]. Nevertheless, the influence of these analytical methods on the ranking of inclusive education has not been thoroughly investigated.
Unfortunately, there are notable deficiencies in the implementation of effective inclusive education within regular schools in urban areas of India. Moreover, there has been a lack of effort to understand the current status of regular schools concerning the relative importance of various aspects of effective inclusive education, as perceived by all school stakeholders (including teachers, principals, special educators, staff, parents, and students) in primary education settings. Previous studies have primarily focused on the perspectives and concerns of teachers [44, 27], overlooking considerations related to building accessibility and infrastructure. This research seeks to address this gap by assessing the significance of diverse dimensions of effective inclusive education in regular schools, particularly concerning the integration of children with disabilities (CwDs), while considering viewpoints from all stakeholders involved. In countries like India, where financial and resource constraints are prevalent [2, 39, 28], prioritizing essential inclusive education resources is essential for effectively narrowing the gap. Prioritizing domains and indicators provides insights for officials and administrators to make informed decisions, enhancing accessibility and inclusion for individuals with disabilities. These criteria are crucial for policymaking, strategic planning, and budget allocations to develop inclusive schools in India The study aims to rank indicators based on stakeholder perceptions in Delhi's primary schools.
Method
The study focuses on tier 1 and higher Indian cities, with Delhi as the primary focus (Tier 1 cities in India are major urban centers that drive economic and social development and has a population of 1 lakh and more). Data collection took place in Delhi's primary schools across its 12 zones, randomly selecting the "central" zone to ensure unbiased representation (only regular public schools are considered in this study). Between March and May 2022, stakeholders from 51 primary schools participated in one to one interaction for conducting a paper-based surveys to establish an effective inclusive education model. Participants were fully briefed on the survey's objectives, and their completion of the questionnaire implied informed consent. Approval for conducting this study was received from the Doctoral Scrutiny Committee at Indian Institute of Technology, Kharagpur. This study involves various stakeholders in these primary schools, including teachers, principals, special educators, staff, and students with or without disabilities, ranging from nursery to fifth grade. With a known population size (N= 19848) and a finite population, the study utilizes the Yamane’s formula [52] to determine the appropriate sample size for survey research.
n = ,
where, n= sample size, N= population size, & e = margin of error,
In primary schools, there are 939 teachers for nursery and KG, consisting of 769 regular and 170 contractual teachers. For classes first to fifth, there are 17,374 teachers, consisting of 14,994 regular and 2,380 contractual teachers. The total number of permanent principals is 1,478, while there are 57 on contractual terms [9]. Here, total no of teachers and principals (i.e., population size (N):
Population size (N) = 939+17374+ 1478+57 = 19848
so, sample size (n) = 19848 / 1+19848 x (0.05)2 = 392.09
so, a sample size of 392 school stakeholders is considered statistically valid, taking into account the overall number of diverse stakeholders presently engaged in primary schools [9]. Here, out of the 492 individuals targeted for the survey spanning 51 primary schools (consisting of 421 regular teachers, 20 special educators, and 51 principals), 481 respondents (97.7%) enthusiastically took part in the survey. The data obtained from these participants were digitized and systematically coded. In the data processing phase, participants assessed all dimensions of IEIE. Any incomplete observations were omitted, leading to 481 complete responses in the ultimate dataset.
Variables
Researchers worldwide have emphasized the significance of diverse indicators related to IEIE. These measures encompass elements such as 'academic teaching and learning,' including variables like class size, teaching methods, and curriculum [2, 42, 32]. Furthermore, the 'availability of appropriate support' from both school and government entities encompasses administrative aid, the prevalence of student disabilities [19], financial support [1], policies, and the student-teacher ratio [2]. Additionally, the 'availability of suitable facilities' encompasses services and resources such as therapeutic care centers, paraprofessional staff [32], resources for incorporating accessible features, specialized training [48], and vocational education [27]. The aspect of 'teacher's education and training' includes their educational qualifications, teaching experience, training in handling children with special needs (CWSN), proficiency in using specialized equipment, and awareness of universal learning design [3, 42]. Moreover, 'teacher's attitude' covers their disposition (positive/negative) and their understanding and sensitivity toward disabilities [17, 20, 32]. 'Socio-cultural aspects' entail parental/community engagement and the acceptance and mutual respect among students with and without disabilities and educators [32]. Finally, factors concerning 'infrastructure and built environment accessibility' include entry accessibility to the premises and school facilities, vertical and horizontal mobility, restroom access, exit navigation and communication, academic space accessibility, access to extracurricular activities, and digital infrastructure [30, 37, 3, 47, 32]. Additional indicators were derived from literature and expert insights, refined through an initial pilot survey, and Fuzzy Delphi analysis.
Questionnaire Development Process
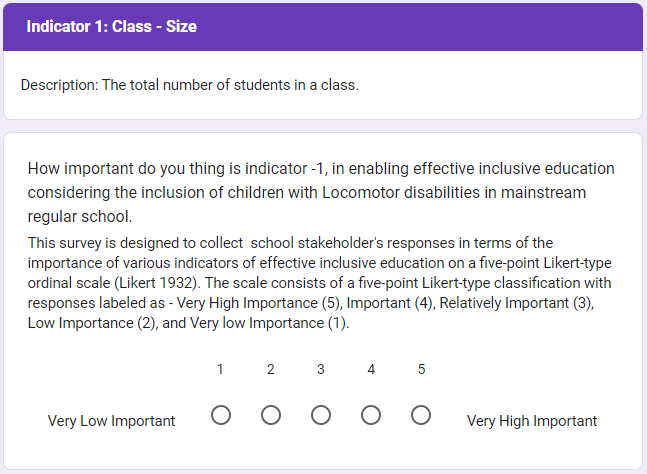
A paper-based survey questionnaire was developed to gather input from key stakeholders in primary schools located in Delhi. The questionnaire creation process involved several steps: initially selecting Indicators of Effective Inclusive Education (IEIE) from existing literature, refining these indicators through a Focus Group Discussion with experts from diverse sectors, utilizing a fuzzy Delphi method along with a Wilcoxon signed rank test to validate indicators, and ultimately constructing a paper-based survey questionnaire for primary school stakeholders. This questionnaire aimed to obtain their perspectives on the importance of various IEIE identified through the Fuzzy Delphi analysis, totaling 33, using a five-point Likert-type ordinal scale [24], and ranging from Very High Importance (5) to Very Low Importance (1). An excerpt from the survey questionnaire is provided below (refer to Figure 1).
Reliability of the Data
In order to evaluate the consistency of the data responses, a statistical analysis utilizing Cronbach's alpha coefficient was performed on the significance of IEIE. Cronbach’s alpha (α), symbolized by the Greek letter α, measures the internal consistency or reliability of aggregated rating scales [10]. It is widely recognized for assessing the consistency of items within a scale by examining the correlation among responses to survey questions [10,11]. The Cronbach Alpha value obtained for the complete dataset was 0.895 (see table 1), categorizing it as 'Good' (0.80 ≥ α ≥ 0.89), surpassing the 0.70 threshold (see table 2). This outcome confirms the reliability of the survey data responses (i.e. survey data responses were consistent) and suggests that the questionnaire effectively captures these indicators.
VARIABLES | VALUES | Internal Consistency |
|---|---|---|
(K) | 33 | Formula (α) = K/K-1* [1-(∑ s2y/∑ s2x)] |
(∑ s2y) | 45.8266 | |
(∑ s2x) | 347.8369 | α= 0.895 |
(α) | 0.8953 | |
Reliability Level | Good as (0.80 ≥ α ≥ 0.89); refer table 2 | |
Note: Here, K: Number of Items, ∑ s2y: Sum of the item variance, ∑ s2x: Variance of total score, α: Cronbach's Alpha,
S. No. | Range of Coefficient of Cronbach's Alpha | Reliability Level |
|---|---|---|
1. | 'α' > 0.90 | Excellent |
2. | 0.80-0.89 | Good |
3. | 0.70-0.79 | Acceptable |
4. | 0.60-0.69 | Questionable |
5. | 'α' < 0.59 | Unacceptable |
Data Analysis
Given the principal aim of this research to prioritize the indicators of effective inclusive education (IEIE) according to the perceptions of school stakeholders, it is essential to employ techniques adept at handling extensive rating data. While a basic user ranking based on mean score is customary, it is unsuitable for Likert-type data due to its limitations as a measure of central tendency. Therefore, the study advocates the utilization of Multi-Criteria Decision-Making (MCDM) techniques tailored to address such data for a more precise analysis. Hence, the selection of Technique for Order Preference by Similarity to Ideal Solution (TOPSIS), as MCDM methods is based on their optimal compatibility with Likert-type scale ordinal data and their widespread application in previous research for ranking attributes and facilitating decision-making across multiple criteria [16, 51]. This choice is justified by their practical advantages, straightforward calculations, and ease of interpretation, as established by prior studies, thereby enabling an accurate estimation of the relative importance of IEIE and their subsequent ranking.
TOPSIS Analysis
TOPSIS, a method for multi-attribute decision-making [8], determines the most favorable alternative by prioritizing proximity to the positive ideal solution and distance from the negative ideal solution [15]. The positive ideal solution encompasses optimal values from criteria, while the negative ideal solution represents the worst possible values [50]. Proximity is evaluated using n-dimensional Euclidean measurement, with attributes weighted according to preference [34]. In this analysis, 33 IEIE were integrated, with importance levels ranging from 1 to 5 and equal weighting indicating equal preference probability. The objective was to maximize levels 3–5 and minimize levels 1 and 2 in the positive ideal solution, while the negative ideal solution aimed for the opposite. TOPSIS scores () were computed for each IEIE using both positive () and negative () ideal solutions, as depicted in Table 3.
Results
The ranking results for IEIE from TOPSIS analysis are presented in Table 3.
Indicators | () | () | () | R |
|---|---|---|---|---|
Class-Size | 0.003761 | 0.005519 | 0.5947 | 12 |
Teaching Strategies | 0.004113 | 0.005242 | 0.5603 | 18 |
Curriculum | 0.003819 | 0.005423 | 0.5867 | 14 |
Student-Teacher Ratio | 0.002314 | 0.005942 | 0.7197 | 4 |
Administrative support | 0.003985 | 0.005028 | 0.5578 | 19 |
Participation in Co-curricular activities | 0.004455 | 0.004718 | 0.5143 | 29 |
Enrolment of Children with Special Needs | 0.002973 | 0.006188 | 0.6755 | 6 |
Are you a differently-abled /special child | 0.001991 | 0.006579 | 0.7677 | 1 |
Type of disability | 0.002859 | 0.006567 | 0.6967 | 5 |
Severity of disability | 0.001968 | 0.006438 | 0.7659 | 2 |
financial support | 0.004216 | 0.004979 | 0.5415 | 24 |
Policies _implementation of inclusive education | 0.004170 | 0.004877 | 0.5391 | 25 |
Availability of Therapeutic care center | 0.003753 | 0.005407 | 0.5902 | 13 |
Availability of Paraprofessional Staff | 0.004105 | 0.004959 | 0.5471 | 21 |
Availability of Resources | 0.004596 | 0.004930 | 0.5175 | 28 |
Availability of Special training for Teachers | 0.004010 | 0.005322 | 0.5703 | 16 |
Availability of Vocational training facilities | 0.003812 | 0.005406 | 0.5865 | 15 |
Teacher- Qualification | 0.004173 | 0.004854 | 0.5377 | 26 |
Teaching Experience | 0.004161 | 0.005008 | 0.5462 | 22 |
Trained /Untrained w.r.t. CWSN | 0.002351 | 0.006261 | 0.7270 | 3 |
Proficient or not in operating Special Devices | 0.004583 | 0.004671 | 0.5047 | 30 |
Awareness about UDL | 0.003868 | 0.005709 | 0.5961 | 11 |
Teacher's Attitude | 0.004691 | 0.004445 | 0.4865 | 32 |
Awareness & Sensitization w.r.t. disability, | 0.004934 | 0.004296 | 0.4654 | 33 |
Parents/ Community Involvement | 0.005780 | 0.005485 | 0.4869 | 31 |
Acceptability & Mutual Respect | 0.004960 | 0.006171 | 0.5544 | 20 |
Accessibility to Site Entry & School Premises | 0.004315 | 0.006499 | 0.6010 | 10 |
Accessibility to Vertical & Horizontal Movement | 0.003282 | 0.006404 | 0.6612 | 7 |
Accessibility to WASH And Other Facilities | 0.004199 | 0.006734 | 0.6159 | 9 |
Accessibility to Exit, Way-finding, Communication | 0.004766 | 0.006202 | 0.5655 | 17 |
Accessibility to Academic Spaces | 0.004157 | 0.006823 | 0.6214 | 8 |
Accessibility to Extra-Curricular Activities | 0.005216 | 0.006164 | 0.5416 | 23 |
Accessibility to Digital Infrastructure | 0.005170 | 0.005823 | 0.5297 | 27 |
Note: Here, (): separation measures from positive ideal solution, (): separation measures from negative ideal solution, represents an index value ranging from 0 to 1 and R: represents Rank. A higher index value indicates superior alternative performance. Here, in this study, all selected indicators should be perceived in light of the inclusion of children with disabilities in regular primary schools (only public schools). For instance, one of the indicators, ‘Are you a differently abled/special child?' (i.e., knowing the status of child that whether he/she is differently abled or not), prompts an exploration of stakeholders' opinions on the importance of this indicator in relation to the inclusion of children with disabilities in regular public primary schools.
Discussion
According to the findings from the TOPSIS analysis presented in Table 3, school stakeholders notably prioritize certain qualitative indicators. These indicators predominantly center around student characteristics, emphasizing the importance of recognizing students and their disabilities, such as whether they are differently-abled/special children (), the severity of their disability (), the type of disability they have (), and the enrollment of children with special needs (). Additionally, attributes related to teachers are considered crucial, including the training status of educators concerning children with special needs (), student-teacher ratio (), and awareness about Universal Design for Learning (UDL) (). Indicators related to accessibility, such as accessibility to vertical and horizontal movement (), accessibility to academic spaces (), and accessibility to Water, sanitation and hygiene (WASH) and other facilities (), and accessibility to the site entry and school premises (), are also deemed significant. Consequently, the TOPSIS analysis suggests that the most critical IEIE encompass aspects related to students with disabilities, teacher-related attributes, and accessibility-related indicators addressing barriers within school premises and buildings.
As per the TOPSIS analysis, indicators of medium importance encompass various aspects such as class size (), the availability of a therapeutic care center (), curriculum (), the availability of vocational training courses and facilities within the school (), the availability of special training for regular teachers and staff (), accessibility to exit, way-finding, and communication (), teaching strategies (), administrative support (), acceptability & mutual respect between students and teachers (), the availability of paraprofessional staff (), and teaching experience () is emphasized to facilitate ongoing student development and inclusion. This indicates that indicators related to facilities, support services, and resources (like the presence of paraprofessional staff, the existence of therapeutic care centers, and the provision of vocational training, the availability of special training for regular teachers and staff, and administrative support) along with the indicators related to the academic teaching; class size, curriculum, teaching strategies, teacher’s experience, acceptability & mutual respect between students and teachers and accessibility to exit, way-finding, and communication are categorized as medium importance indicators based on their relative significance in the analysis.
In the TOPSIS analysis, it is notable that stakeholders attribute lower significance to various indicators, including accessibility to extra-curricular activities (), inadequate financial support (), policies regarding the implementation of inclusive education (), teacher’s educational qualifications (), accessibility to digital infrastructure (), participation of CWSN in co-curricular activities (), proficiency in operating Special Devices & Equipment used by CWSN (), parents/community involvement awareness (), teacher's attitude (negative/positive) (), and awareness & sensitization regarding disability (). This discovery contradicts the common assumption that financial and administrative support, are highly crucial factors for the inclusion of CwDs in inclusive education, especially in developing countries like India. It is worth noting that many primary schools have only one special educator per school to assist CwDs, and the enrollment of these students is relatively low in existing schools. This could elucidate why stakeholders do not prioritize these indicators as highly important compared to the aforementioned ones. The diminished importance attributed to teaching strategies, financial and administrative support, trained teachers, community involvement, and awareness is disconcerting, particularly considering the significantly low enrollment of CwDs in primary schools. This likely signifies a lack of enthusiasm among stakeholders (teachers, principals, special educators, etc.) in actively advocating for the inclusion of CwDs in these schools, as these indicators necessitate their direct involvement and commitment.
Conclusions
This research provides valuable insights into the importance of IEIE in promoting the integration of CwDs within primary schools in Delhi, India. The findings indicate that stakeholders prioritize qualitative indicators concerning students, teachers, resources, and accessibility, while placing less emphasis on financial and administrative support, as illustrated in Table 3. In developing countries like India, there tends to be a disproportionate focus on financial and administrative aspects of inclusive education, often overlooking the qualitative dimension crucial for the inclusion of CwDs. The results highlight the urgency of improving accessibility around schools and giving adequate attention to qualitative factors. The outcomes emphasize the current lack of attention to specific indicators such as awareness and sensitization about disability, parental/community involvement, teacher attitudes (negative/positive), mutual respect between students and teachers, participation of CWSN in extracurricular activities, proficiency in operating special devices and equipment used by CWSN, teachers' educational qualifications, and teaching experience. Conversely, indicators like student characteristics (including disability status, type, and severity), student-teacher ratio, educator training regarding CWSN, awareness of UDL, class size, curriculum, accessibility to academic spaces and facilities, availability of therapeutic care centers, and vocational training opportunities in schools hold greater significance for CwDs inclusion. This variation may arise from the diverse disabilities within CwDs, requiring heightened attention and support compared to typically developing children. Therefore, there is a justified need to enhance awareness among school stakeholders regarding the needs of CwDs for their inclusion in regular schools.
Prioritizing domains and indicators provides insights for officials and administrators to make informed decisions, enhancing accessibility and inclusion for individuals with disabilities. These criteria are crucial for policymaking, strategic planning, and budget allocations to develop inclusive schools in India. Also, finding of this research will be helpful in all the interdisciplinary research fields which are related to education and individual with disabilities.
Limitation and Future Scope
The study emphasizes IEIE's importance, provides a crucial basis for selecting IEIE to include CwDs into mainstream schools and urges further research, to develop an assessment tool to evaluate the current status of these indicators in regular school, aiming to boost children with disabilities' enrollment. This research is limited to primary schools of Delhi (only public school).
REFERENCES
- Aziz, E. 2018. A reflection on the status of inclusive classrooms in MCD schools of South Delhi. Researchers’ Guild, 1(1), 4. DOI= https://doi.org/10.15503/rg.v1i1.459
- Belapurkar, A. M., & Phatak, S. (2013). Comparing inclusive practices in urban and rural schools in Pune. Scholarly Research Journal for Interdisciplinary Studies, 1(4), 813-821. Retrieved from https://www.srjis.com/issues_data/4
- Bhatnagar, N., & Das, A. 2013. Nearly Two Decades after the Implementation of Persons with Disabilities Act: Concerns of Indian Teachers to Implement Inclusive Education. International Journal of Special Education, 28(2), 104–113. http://files.eric.ed.gov/fulltext/EJ1023312.pdf
- Biswal, S. K., Sreekumar, and Panda, A. K. 2011. “Analyzing the factors influencing store image from customer’s perspective—An empirical study in India.” Asian J. Bus. Manage. Stud., 2(3), 144–154. https://idosi.org/ajbms/2(3)11/6.pdf
- Bross, I. D. J. 1958. How to use RIDIT Analysis. Biometrics, 14(1), 18. DOI= https://doi.org/10.2307/2527727
- Census of India. (2011). Provisional population totals. Government of India. Retrieved from https://censusindia.gov.in/nada/index.php/home
- Chan, J. W., & Tong, T. K. 2007. Multi-criteria material selections and end-of-life product strategy: Grey relational analysis approach. Materials & Design, 28(5), 1539-1546.
- Chen, S. J., Hwang, C., Beckmann, M. J., & Krelle, W. 1981. Multiple attribute decision making: methods and applications. http://ci.nii.ac.jp/ncid/BA13989475
- Chettri, S., & Ghosh, S. (2022, March 15). Delhi: Enrolment rises, but MCD schools cannot keep facilities up to speed. The Times of India. Retrieved from https://timesofindia.indiatimes.com/city/delhi/enrolment-rises-but-mcd-schools-cannot-keep-facilities-up-to-speed/articleshow/95541356.cms
- Cronbach, L. J. 1951. Coefficient alpha and the internal structure of tests. psychometrika, 16(3), 297-334.
- Cronbach, L. J., & Shavelson, R. J. 2004. My current thoughts on coefficient alpha and successor procedures. Educational and psychological measurement, 64(3), 391-418. DOI= https://doi.org/10.1177/0013164404266386
- Deng, J. L. 1989. “Introduction to grey system theory.” J. Grey Syst., 1(1), 1–24. https://uranos.ch/research/references/Julong_1989/10.1.1.678.3477.pdf
- Dodangeh, J., Mojahed, M., & Yusuff, R. B. M. (2009). Best project selection by using of group TOPSIS method. In Proceedings of the International Association of Computer Science and Information Technology—Spring Conference (pp. 50–53). IEEE Computer Society Press. https://doi.org/10.1109/IACSIT-SC.2009.119
- Eboli, L., & Mazzulla, G. 2009. A new Customer Satisfaction index for evaluating transit service quality. Journal of Public Transportation, 12(3), 21–37. DOI= https://doi.org/10.5038/2375-0901.12.3.2
- Ertuğrul, İ., & Karakaşoğlu, N. 2009. Performance evaluation of Turkish cement firms with fuzzy analytic hierarchy process and TOPSIS methods. Expert Systems with Applications, 36(1), 702–715. DOI= https://doi.org/10.1016/j.eswa.2007.10.014
- Flora, J. D. 1974. A note on RIDIT analysis. Technical Rep. Ann Arbor, MI: Univ. of Michigan
- Forlin, C., & Chambers, D. 2011. Teacher preparation for inclusive education: increasing knowledge but raising concerns. Asia-pacific Journal of Teacher Education, 39(1), 17–32. DOI= https://doi.org/10.1080/1359866x.2010.540850
- Forlin, C., & Rose, R. 2010. Authentic school partnerships for enabling inclusive education in Hong Kong. Journal of Research in Special Educational Needs, 10(1), 13–22. DOI= https://doi.org/10.1111/j.1471-3802.2009.01139.x
- Gupta, V. (2016). Educational planning: Dropout of CWSN and SLD children in India. IAFOR Journal of the Social Sciences, 2(2), 59-74. https://doi.org/10.22492/ijss.2.2.05
- Hemmings, B., & Woodcock, S. 2011. Preservice Teachers’ Views of Inclusive Education: A content analysis. Australasian Journal of Special Education, 35(2), 103–116. DOI= https://doi.org/10.1375/ajse.35.2.103
- Kung, C. Y., & Wen, K. L. 2007. Applying grey relational analysis and grey decision-making to evaluate the relationship between company attributes and its financial performance—a case study of venture capital enterprises in Taiwan. Decision support systems, 43(3), 842-852.
- Kyriazopoulou, M., & Weber, H. 2009. Development of a set of indicators-for inclusive education in Europe. Odense: European Agency for Development in Special Needs Education, https://www.european-agency.org/resources/publications/development-set-indicators-inclusive-education-europe
- Lancaster, J. (2014). School and Classroom Indicators of Inclusive Education. In F. Kiuppis & R. S. Hausstätter (Eds.), Measuring Inclusive Education (International Perspectives on Inclusive Education, Vol. 3), Emerald Group Publishing Limited, Leeds, (pp. 227-245). https://doi.org/10.1108/S1479-363620140000003027
- Likert, R. 1932. A technique for the measurement of attitudes. https://psycnet.apa.org/record/1933-01885-001
- Loreman, T., Forlin, C. and Sharma, U. (2014). Measuring Indicators of Inclusive Education: A Systematic Review of the Literature. In F. Kiuppis & R. S. Hausstätter (Eds.), Measuring Inclusive Education (International Perspectives on Inclusive Education, Vol. 3), Emerald Group Publishing Limited, Leeds, pp. 165-187. https://doi.org/10.1108/S1479-363620140000003024
- Lotfi, F. H., Fallahnejad, R., and Navidi, N. 2011. “Ranking efficient units in DEA by using TOPSIS method.” Appl. Math. Sci., 5(17), 805–815. https://www.m-hikari.com/ams/ams-2011/ams-17-20-2011/lotfiAMS17-20-2011-1.pdf
- Lozano, C. S., Wüthrich, S., Büchi, J. S., & Sharma, U. 2022. The concerns about inclusive education scale: Dimensionality, factor structure, and development of a short-form version (CIES-SF). International Journal of Educational Research, 111, 101913. DOI= https://doi.org/10.1016/j.ijer.2021.101913
- Mathew J. 2017. A report on “Reasons-for-School-Dropouts-Survey”. https://mes.ac.in/wp-content/uploads/2017/10/Reasons-for-School-Dropouts-Survey-Report-by-Jomon.pdf
- Government of India. (2020). National Education Policy 2020. Ministry of Education. Retrieved from https://www.education.gov.in/sites/upload_files/mhrd/files/NEP_Final_English_0.pdf
- Ministry of Housing and Urban Affairs [MoHUA], Government of India. (2021). Harmonized Guidelines & Standards for Universal Accessibility in India. Retrieved from https://cpwd.gov.in/Publication/HarmonisedGuidelinesUA2021.pdf
- Mutisya, C. M. S. 2011. Factors influencing inclusion of learners with special needs in regular primary school in Rachuonyo district, Kenya. https://ir-library.ku.ac.ke/handle/123456789/903
- Nag, D., & Goswami, A. K. 2019. Identification of Measures of Effectiveness (MOEs) for developing Pedestrian Level of Service (PLOS). International Review for Spatial Planning and Sustainable Development, 7(4), 56–82. DOI= https://doi.org/10.14246/irspsd.7.4_56
- Olson, D. L. 2004. Comparison of weights in TOPSIS models. Mathematical and Computer Modelling, 40(7–8), 721–727. DOI= https://doi.org/10.1016/j.mcm.2004.10.003
- Pradhan, B. K. 2009. Service Quality Indicators in Education Setting: Application of RIDIT Method to Likert Scale Surveys - ethesis. http://ethesis.nitrkl.ac.in/1518/1/PDF.pdf
- Government of India. (2009). The Right of Children to Free and Compulsory Education Act, 2009 (No. 35 of 2009). Retrieved from https://www.education.gov.in/sites/upload_files/mhrd/files/upload_document/rte.pdf
- Government of India. (2016). Rights of Persons with Disabilities Act, 2016 (No. 49 of 2016). Retrieved from https://lddashboard.legislative.gov.in/sites/default/files/A2016-49_1.pdf
- Sadhukhan, S., Banerjee, U. K., & Maitra, B. 2015. Commuters’ Perception towards Transfer Facility Attributes in and Around Metro Stations: Experience in Kolkata. Journal of Urban Planning and Development, 141(4), (pp. 04014038-1-04014038-8). DOI= https://doi.org/10.1061/(asce)up.1943-5444.0000243
- Sanjeev, Kumar, & Kumar, Khagendra. (2007). Inclusive Education in India. Electronic Journal for Inclusive Education, 2(2), (pp. 1-15), Article 7. Retrieved from SSRN: https://ssrn.com/abstract=3499954
- Sarkar, T. (2020, August 26). Examining disability inclusion in India’s new national education policy. UKFIET's Education and Development Forum. Retrieved from https://www.ukfiet.org/2020/examining-disability-inclusion-in-indias-new-national-education-policy/
- Sarva Shiksha Abhiyan. (2001). Ministry of Human Resource Development, Government of India. Retrieved from https://www.education.gov.in/sites/upload_files/mhrd/files/upload_document/SSA-Frame-work.pdf
- Scruggs, T. E., & Mastropieri, M. A. 1996. Teacher Perceptions of Mainstreaming/ Inclusion, 1958–1995: A Research Synthesis. Exceptional Children, 63(1), 59–74. DOI= https://doi.org/10.1177/001440299606300106
- Şener, S. 2020, July 1. A view on teacher training programs in Turkey. https://dergipark.org.tr/en/pub/bssocialscience/issue/52086/658587
- Sharma, U., & Desai, I. 2002. Measuring concerns about integrated education in India. Asia-Pacific Journal on Disability, 5(1), 2–14. https://www.dinf.ne.jp/doc/english/asia/resource/z00ap/vol5no1/measure.html
- Sharma, U., Jitoko, F., Macanawai, S. S., & Forlin, C. (2018). How do we measure implementation of inclusive education in the Pacific Islands? A process for developing and validating disability-inclusive indicators. International Journal of Disability, Development and Education, 65(6), 614-630. DOI= https://doi.org/10.1080/1034912x.2018.1430751
- Social & Rural Research Institute. (2014). National Sample Survey of Estimation of Out-of-School Children in the Age 6-13 in India. Ministry of Education India. Retrieved from https://www.education.gov.in/sites/upload_files/mhrd/files/upload_document/National-Survey-Estimation-School-Children-Draft-Report.pdf
- UNESCO. (2004). Education for All: The Global Monitoring Report 2004. Oxford University Press. DOI: https://doi.org/10.54676/HFRH4626
- United Nations. 2006. Convention on the Rights of Persons with Disabilities. Article 24: Education. https://www.un.org/development/desa/disabilities/convention-on-the-rights-of-persons-with-disabilities/article-24-education.html
- Wang, T., Nguyễn, T., & Phan, B. N. 2022. Analyzing higher education performance by entropy - TOPSIS method: A case study in Viet Nam private universities. Measurement & Control, 55(5–6), 385–410. DOI= https://doi.org/10.1177/00202940221089504
- Wang, Y. M., & Elhag, T. 2006. Fuzzy TOPSIS method based on alpha level sets with an application to bridge risk assessment. Expert Systems with Applications, 31(2), 309–319. DOI= https://doi.org/10.1016/j.eswa.2005.09.040
- Wang, Y. M., and Y. Luo. 2009. “On rank reversal in decision analysis.” Math. Compute. Modell. 49 (5): 1221–1229. DOI= https://doi.org/10.1016/j .mcm.2008.06.019.
- Wu, C. H. 2007. On the application of grey relational analysis and RIDIT analysis to Likert scale surveys. In International Mathematical Forum (Vol. 2, No. 14, pp. 675-687). Hikari, Ltd.
- Yamane, T. 1967. Yamane, Taro. (1967). Statistics: An Introductory Analysis, 2nd Edition, New York: Harper and Row.