ABSTRACT
University course grades are quite important and are used for evaluating student performance, gauging course difficulty, assessing student preparedness, measuring instructor effectiveness, and as selection criteria for graduate school admissions. However, education researchers and practitioners often raise concerns about the validity of grades, the impact of grade inflation, and inconsistent grading policies across instructors, academic departments, and universities. Research in grade analysis has been limited due to the lack of high quality and publicly accessible datasets that cover multiple institutions. Without such datasets one cannot accurately characterize and analyze general grading trends and issues. In this study, grades from 33 public U.S. colleges and universities were collected, organized, merged into a common format, and posted in a publicly available repository. The dataset and associated information are described in detail in this paper. In addition, analyses of the grading data were performed at the institutional, academic major, department, and instructor level, with several interesting and notable results (e.g., academic departments assign very different grades, and this trend is relatively consistent across institutions). The dataset described in this paper can serve as a resource for educational researchers interested in grading and can be used to develop, evaluate, and test hypotheses related to grading and grading policies.
Keywords
INTRODUCTION
Grades can be used to evaluate student performance, serve as a selection criterion for graduate programs and employment, and determine scholarship eligibility. University administrators may also use grades to evaluate curricula success and make decisions regarding tenure track and adjunct instructors’ employment.
Several studies have found variability in undergraduate grades that are not entirely attributable to student ability. A 2018 study observed that when “controlled for student ability and course characteristics” there was a significant difference between departmental average grades, suggesting a department-led policy on grade assignments [15]. Another study showed that grades in the sciences and economics are lower than grades in the humanities [8], while a study of three public universities showed that undergraduate K-12 education departments assign significantly higher grades, with one of every five classes assigning A’s to all students [7]. Another study found that the “average grade difference between STEM and non-STEM course grades and GPAs is around four tenths of a grade point” and that students of the same academic caliber (based on ACT scores and other course grades) receive lower grades in STEM courses [12]. One study found that academic departments with lower student enrollments assign higher grades [10]. Chen et al. found a correlation between instructors’ temporary or part-time employment status and high grades, without an improvement in learning outcomes [14].
Despite the purported lack of consistency in grades, they serve as a major decision-making force in higher education. Regardless of aptitude, students often interpret low grades as an “academic mismatch,” resulting in higher major withdrawal rates in low grade departments like Physics [6]. Lower grades in STEM departments have been found to disproportionately impact female students, resulting in a higher major attrition rate compared to their male counterparts earning the same (low) grades [2]. Grades also play an important role in the professor-student relationship: studies have found that students often “punish” instructors by giving them lower ratings when they receive lower grades than expected, but rarely “reward” following a higher grade [4].
Prior research on analyzing grade patterns has been limited by the amount, and time span, of the available data. Concerns about student and instructor privacy also limits the availability of data, as privacy of student grades is legally mandated in the U.S. by the Family Educational Rights and Privacy Act (FERPA) [5].
This paper describes a large dataset of student grade data in 33 U.S. public universities and provides a high-level analysis of the grade data. To our knowledge, the dataset that we generated [11] is the largest unified grading dataset that is publicly available. This is one major contribution of our study. The original sources of the data for the 33 institutions were published and publicly distributed online by institutional research boards or as a result of Freedom of Information Act (FOIA) requests. However, each dataset has its own format and cannot be combined without time-consuming data processing. Our dataset will allow researchers to quickly evaluate grading-related hypotheses across geographically and academically varied institutions. Note that FOIA requests only apply to public institutions, which is why our data are all from public universities.
Our unified grading dataset was used to analyze grading patterns at the institutional, academic major, and departmental level. This allowed us to validate interesting patterns from past studies that relied on single-institution datasets [15][4][7][9][10]. A key findings is that, across the 33 universities, grades and grade distributions vary substantially based on academic field and department, which suggests a large gap in student ability or marked differences in grading policies and practices.
Dataset description
This section describes the methods and references used in collecting, aggregating, processing, and formatting the grade datasets. All data described here is publicly available for download [11].
Data Collection and Manipulation
Grade data was obtained from 33 U.S public universities by conducting an extensive search for FOIA requests for grade data to state universities as well as official publications issued by institutional research departments. Data obtained through FOIA requests were available via CSV and Excel files posted to the Internet, while data in interactive tools from institutional webpages were obtained through direct download or web-scraping using Python scripts. Due to FERPA restrictions, grade data from course sections with fewer than 10 to 15 students (depending on institution policy) were not available. We include the source of the original data in our dataset.
Each dataset was converted into a unified tabular format, where each entry represents the letter grade distributions of a course or section during a particular semester. Institution-specific course names and codes were retained excluding special characters. Table 1 describes the unified dataset format, which contains 28 columns, along with sample data entries.
Column | Description |
|---|---|
Year | {2009, …, 2022} |
Semester | {Spring, Summer, Fall, Winter} |
Dept. Name | {Computer Science, Spanish, …} |
Dept. Code | 2-5 letter code for the department offering the course. Varies by school. {CS, SPAN, …} |
Course # | 2-6 digit # representing course. {228, 101, …} |
Course Name | {Discrete Structures II, Calculus I, …} |
Section | Numerical or alphabetical index of a section. E.g. CS 228 in Spring 2017 has sections 1, 2, and 3. |
CRN | Unique identifier for course. May be recycled across different semesters. Only filled if explicitly provided in the university's original dataset. |
Instructor | Name or identification number of the instructor. |
Enrollment | Number of individual students/grade instances. |
Avg. GPA | Average GPA of a section. Only filled if explicitly provided in the university's original dataset. |
Letter grade % | {A+, A, …, F, Pass, Fail, W}. Sums to 100. |
Other | Uncommon fields or notes by researchers. |
Depending on the level of detail provided by the institution, data may be provided for only a subset of the columns in Table 1. If the original dataset explicitly provided section level data, then “Section” will be filled in. If the dataset did not explicitly provide this information but included unique CRNs for each course section in a given semester, then we generated artificial section numbers.
All but one school had a letter grading scheme. Letter grades were mapped to their numerical equivalent with A corresponding to 4.0, F corresponding to 0.0, and with each letter grade transition yielding a 0.33 drop in value (e.g., A- is 3.7). Michigan State University had a unique grading scale that included values 4.0, 3.5, 3.0, 2.5, 2.0, 1.5, 1.0, and 0.0. To maintain consistency within other data, these grades were mapped to A, B+, B, C+, C, C-, D, and F. Several institutions, such as Brooklyn College, assign + and – grades but only released the base grade (i.e. A+, A, and A- are mapped to A). Universities generally used ascending numerical order for Course #, where the first digit represents the course level (1=Freshman and 4=Senior). Exceptions are UC Berkeley, UCLA, and UCSB, where 0-99 are lower-level undergraduate, 100-199 are higher level undergraduate, and >200 are graduate courses.
Twenty-six of the datasets (a subset of schools with data at the section level) published instructor names. Although these names are already publicly available online, we anonymized them (e.g., Instructor 1, Instructor 2, …) as the instructors likely did not explicitly agree to the release of this information.
Institutional Information
Each csv file in our dataset is titled with the institution name, consistent with NCES (National Center for Educational Statistics) naming. Table 2 shows the details for the 33 institutions represented in our dataset. The “Period” column indicates the time span for the data set, with F (Fall), S (Spring), and U (Summer). The Level (“Lvl.”) column indicates if the grade data is provided at the Course (“C”) or Section (“S”) level and the Instructor (“Inst”) column has a checkmark if instructor-level grade data is provided. The last two columns specify the average unweighted and weighted GPAs for the institution (these terms are defined in Section 2.3).
School | Period | Entries | Lvl. | Inst. | uwGPA | wGPA |
|---|---|---|---|---|---|---|
Brooklyn Col. | 15F-22F | 16113 | C | | 3.52 | 3.35 |
Cal. State LA | 14F-22S | 63201 | S | 3.17 | 2.94 | |
Chicago State | 11F-15F | 6376 | C | 2.77 | 2.69 | |
George Mason | 11F-16S | 50102 | S | ✔ | 3.14 | 3.01 |
Georgia Tech | 13U-22F | 25817 | C | 3.60 | nan | |
GV State | 11F-15F | 33012 | S | ✔ | 3.20 | 3.11 |
Illinois State | 11F-15F | 22836 | S | ✔ | 3.24 | 3.07 |
IU Bloomington | 09F-15F | 84485 | S | ✔ | 3.37 | 3.22 |
James Madison | 10F-21F | 70817 | S | ✔ | 3.23 | 3.11 |
Kennesaw State | 15F-22F | 74555 | C | 3.16 | 3.01 | |
Kent State | 11F-15F | 59036 | S | ✔ | 3.05 | 2.90 |
Michigan State | 11F-22F | 107283 | S | ✔ | 3.34 | 2.97 |
NC State Raleigh | 11F-15F | 24153 | S | ✔ | 3.23 | 2.92 |
Northern Illinois | 11F-15F | 27010 | S | ✔ | 3.09 | 2.88 |
Parkland College | 11F-15F | 11764 | S | 2.81 | nan | |
Purdue | 16F-22F | 104038 | S | ✔ | 3.39 | nan |
Texas Tech | 10F-15S | 33600 | S | ✔ | 3.09 | 2.92 |
UC Berkeley | 09F-14F | 20959 | S | ✔ | 3.43 | 3.09 |
UC Irvine | 10F-15F | 28910 | S | ✔ | 3.31 | 2.96 |
UCLA | 10F-15F | 29789 | S | ✔ | 3.40 | 3.21 |
UCSB | 09F-22S | 85218 | S | ✔ | 3.45 | 2.90 |
U of Houston | 11F-15S | 54952 | S | ✔ | 3.38 | 2.88 |
U of IL Chicago | 10F-15F | 31586 | S | ✔ | 3.30 | 2.73 |
UIUC | 10F-22S | 64048 | S | ✔ | 3.36 | 3.31 |
U of Kentucky | 10F-15F | 51690 | S | ✔ | 3.30 | 3.11 |
UMD CP | 12F-16F | 64021 | S | ✔ | 3.33 | 3.23 |
UM Twin Cities | 17F-20F | 39124 | S | ✔ | 3.44 | 3.27 |
UNC Charlotte | 09F-15F | 46827 | S | ✔ | 3.21 | nan |
U of S. Carolina | 18F-23U | 77951 | S | 3.31 | 3.19 | |
UVA | 11F-21S | 45537 | S | ✔ | 3.53 | 3.43 |
UW Seattle | 10F-16W | 39242 | S | ✔ | 3.47 | 3.34 |
Virginia Tech | 11F-15F | 35174 | S | ✔ | 3.31 | 3.21 |
West Virginia | 11F-15F | 34197 | S | ✔ | 3.14 | 2.96 |
GPA and Enrollment Computation
Average GPA is used to compare grade levels at the institution, field, and departmental levels (it is never used to describe the performance of individual students since grade data is not available at that level). When the average GPAs of various units (e.g., sections, courses) are combined, both an unweighted and weighted average GPA are computed. The average weighted GPA weighs each unit by the number of enrolled students while the unweighted average GPA weighs each unit equally. Grades corresponding to W (“Withdrawn”) and “Pass/Fail” were excluded. The GPA calculations use the following mapping:
A+ (4.3), A (4.0), A- (3.67), B+ (3.33), B (3.0), B- (2.67), C+ (2.33), C (2.0), C- (1.67), D+ (1.33), D (1.0), D- (0.67), and F (0.0).
Hierarchy of Academic Disciplines
In this section we describe the classification hierarchy of academic fields that is utilized for high level analysis at the department or major level. We first needed to identify the department name associated with each course, as some schools in our study provide a department code (e.g. “CISC”) but no department name (e.g., “Computer and Information Sciences”). Institution website scraping and internet searches were employed to identify department names in such cases. In 2.2% of the cases the department name could not be located, and the field was marked as “NA.”
The classification hierarchy used in this study, shown in Table 3, maps departments into five categories and fourteen subcategories. These classifications are based on the College Board’s informational guide “College Majors by Academic Area” and the NCES subject codes [1][17].
We conducted a thorough survey of institution-specific department names using Python language processing tools to match departments to their corresponding subcategories. Departments such as ROTC (Reserve Army Training Corps) and interdisciplinary studies (e.g. Agricultural Science and Economics) were placed in the “Miscellaneous” category. The “Uncategorized” subcategory of the “Miscellaneous” category was excluded from analyses. For each institution, the mappings between the department code, department name, and subcategory are stored and included in an excel file included in the dataset. Note that STEM is an acronym for Science, Technology, Engineering, and Math.
analysis of Grading Data
In this section the compiled dataset is analyzed to identify interesting patterns at the institutional, academic discipline, and department level. All analyses utilize the entire dataset.
Institutional-Level Grading Trends
We begin by examining the distribution of average GPAs over the 33 schools included in our dataset. Figure 1 shows the unweighted average GPA of each institution (orange) and the weighted average GPA of 29 of the 33 schools (blue); the weighted GPA is unavailable for four schools as their data did not provide course/section level enrollment data. When the two metrics overlap the color that is used is a mixture of orange and blue. The mean of the weighted GPA averages is 3.07 and peaks in the 2.9-3.0 band, while the mean of the unweighted averages is 3.27 and peaks in the 3.3-3.4 band. The 0.20 difference in global averages indicates that lower enrolled sections/courses assign higher grades than the higher enrolled sections/courses. This finding agrees with prior research which found a negative correlation between class size and grade [8].
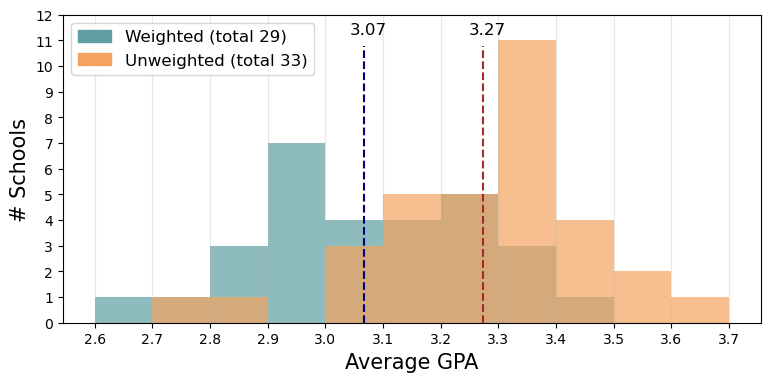
The average weighted schoolwide GPAs center at a point higher than 3.0, which corresponds to a B, which is inconsistent with U.S. universities’ grading guidelines which typically define a C as “average performance.” Those guidelines seem to reflect grading policies of the past, prior to grade inflation. Figure 1 also shows that there is wide variance in the average grades by institution. Institutional average weighted GPA’s vary from 2.69 (Chicago State University) to 3.43 (University of Virginia). The differences in GPA averages could be due to many factors, such as differences in student achievement levels, disparities in instructional quality, and institutional pressures to refrain from giving low grades. The grade data shows that institutions with higher average GPAs also have higher course withdrawal rates, typically in the 7-10% range, which may be partially responsible for the higher GPAs. Some schools may offer a much more liberal course withdrawal policy (e.g., later withdrawal deadlines that have no grade penalty) specifically to allow students to avoid low grades.
The next analysis examines the distribution of letter grades. Of the institutions that provide section or course level enrollment data, the most common grade is an A (within the A range for schools that drop the + and – when reporting grade data). Even Chicago State University, which had the lowest average weighted GPA at 2.69, assigns 35.8% of the grades in the A range. As expected, institutions with higher weighted GPA (above 3.2) gave many A or A‑range grades; in fact, at many high GPA institutions like the University of Virginia, the majority of assigned grades are an A.
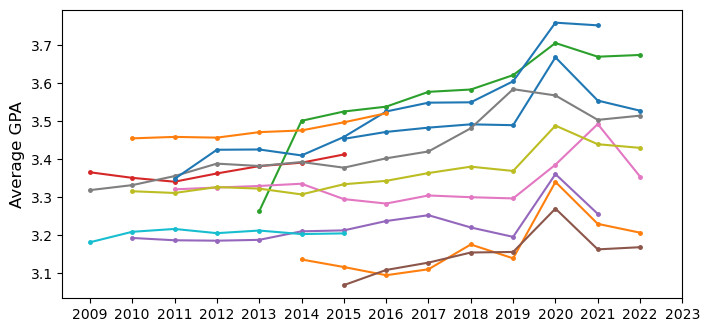
Figure 2 investigates changes in GPA over time and depicts the average institutional GPA per year, with each line representing one school. Only schools with 7 or more years of data (12 schools in total) were represented on the graph. A general increase in average GPA is observed across schools with 5+ years of data available, consistent with prior research’s findings of “grade inflation” where the average grade awarded increases over time [3]. The figure also shows a relatively abrupt increase in average GPA between 2019 and 2020 (of 0.131 GPA points), and a following drop which returns the trend to the original. This may be attributed to the “Covid effect,” which states that the collective transition to online courses in higher education in the Spring 2019 semester due to Covid-19 caused an increase in grading leniency [16].
Grading Trends Across Disciplines
This section looks at grading trends and patterns across academic disciplines at the category and subcategory levels defined in Table 3. Table 4 depicts the average unweighted GPA over all institutions at the category level. We observe that the STEM category has the lowest average GPA.
Category | STEM | Arts & Humanities | Business | Social Sciences | Misc. |
|---|---|---|---|---|---|
Avg. GPA | 3.160 | 3.282 | 3.287 | 3.349 | 3.491 |
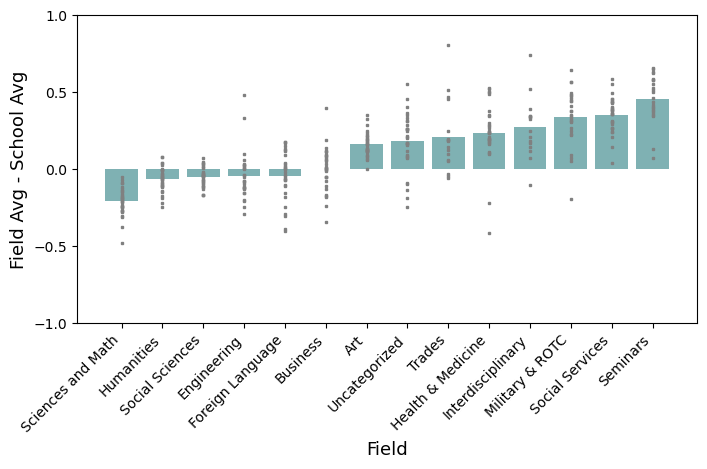
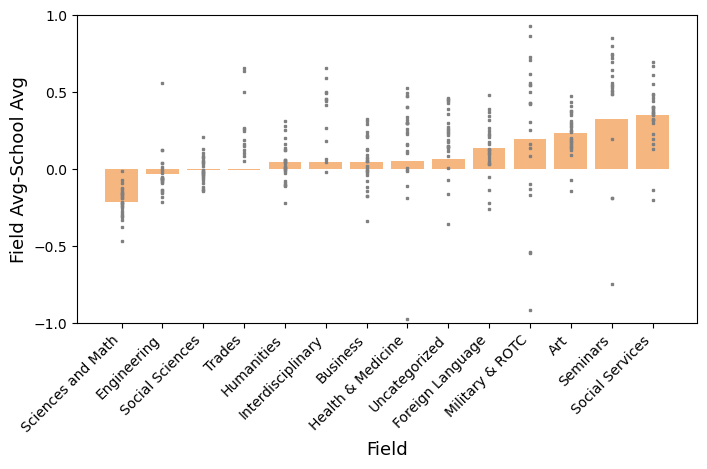
Figures 3 and 4 depict the difference in average GPA between the academic subcategory at a school and the school’s overall average GPA, for the weighted and unweighted cases. The entries are sorted from right to left by increasing differences in GPA. Each grey dot corresponds to one school’s subcategory and the blue and orange bars represent the average GPA shift for that subcategory over all the schools (i.e., average of grey dot values). One outlier was excluded from each figure due to a grade shift with magnitude exceeding 1 for the “Trades,” “Interdisciplinary,” Uncategorized,” and “Seminars” subcategories, usually because of the small number of classes at Chicago State University in those areas.
We observe that “Sciences and Math” has the lowest average GPAs compared to institutional averages, with an average -0.21 (downward) weighted GPA shift. Furthermore, every institution showed a below-institutional-average GPA (i.e., negative shift) for “Sciences and Math”, with Chicago State and Northern Illinois State University having a -0.47 and -0.38 shift, respectively. As seen in Figure 4, “Engineering” has the second lowest average weighted GPA and generally has a downward shift. These findings are consistent with prior research that STEM disciplines have lowest average GPAs within an institution [10]. The “Humanities” subcategory was found to have large variance in grade shift from the institutional average, with a positive GPA shift of 0.05. The discrepancy between the unweighted and weighted GPA shift is especially notable for the humanities department, indicating higher grades in the higher enrollment courses.
Department Level Grading Trends
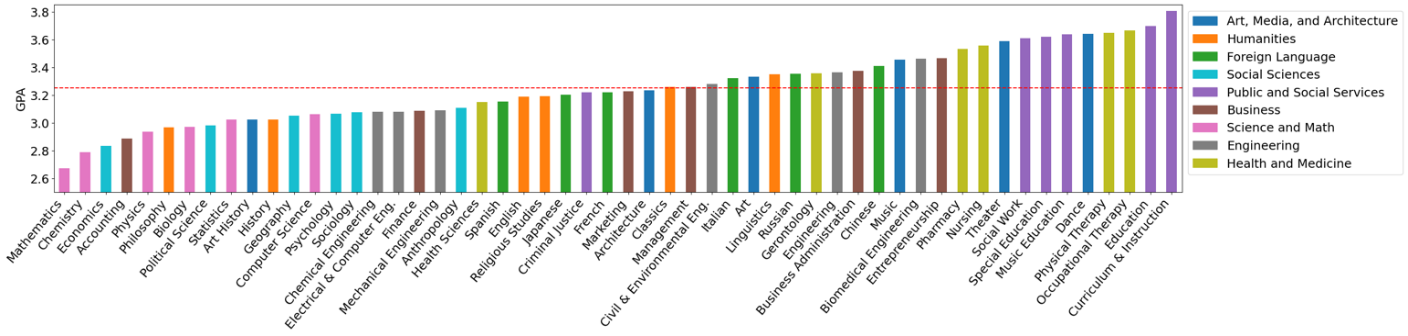
In this section we consider grades at the department level. Figure 5 shows GPA weighted by enrollment for six departments for the nine subcategories best represented in the dataset. The mean unweighted GPA over the departments is 3.25 and is denoted in Figure 5 by a red dashed horizontal line. The departmental GPAs, aggregated across all of the 33 schools that have the department, vary from a low of 2.67 for “Mathematics” to a high of 3.81 for “Curriculum and Instruction.” The “Science and Math” departments and “Social Sciences” departments all have GPAs below the mean departmental GPA. Meanwhile, all but one of the “Health and Medicine” and “Public and Social Services” departments have GPAs greater than the mean. These results are consistent with those from our prior study of grading trends at Fordham University that found STEM departments had lower GPAs than departments in Arts, Humanities, and Languages or Communications and Social Sciences [10]. These findings also agree with another study that indicated “courses emphasizing quantitative and factual learning tend to have assigned lower grades” [13].
We next analyze the relationship between total department enrollment and grades. The scatter plot in Figure 6 relates a particular department’s percentage of total enrollment within its university to its average GPA. Each point represents one department at one university. Three university departments with GPAs below 2.0 do not appear in the figure. One university with over 11% university enrollment also does not appear. The red dashed horizontal line in Figure 6 identifies the departments with GPAs above 3.8. The results indicate that the very highest GPAs are associated with the departments with the lowest enrollments at a university, although small departments also assign low grades. In fact, only departments with enrollments below 3% appear in the upper grade band. Thus, very high GPAs are associated with (relatively) small departments, but low GPAs are not necessarily associated with either small or large departments. This observation is consistent with what was found in prior research at a single private university [10].
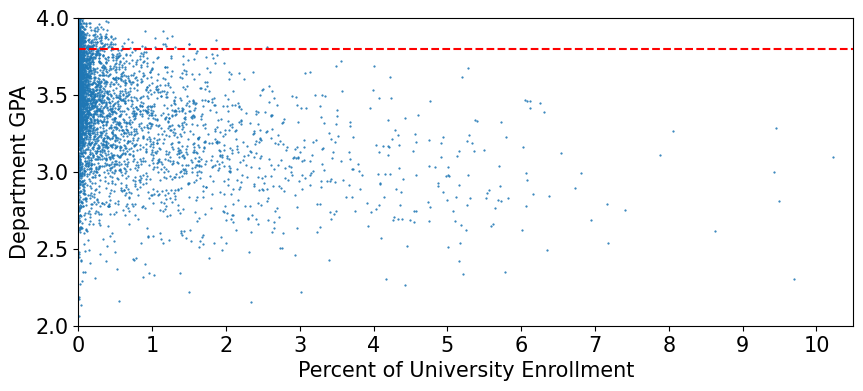
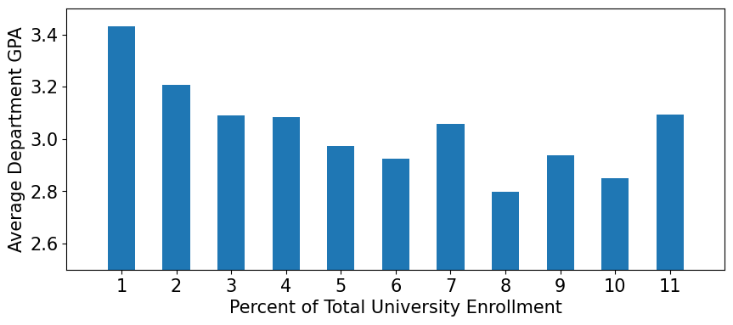
Figure 7 further investigates the relationship between department GPA and enrollment but aggregates all departments with similar percentages of total university enrollment. As can be seen, average GPA initially decreases monotonically as enrollment increases, but then fluctuates. This figure further supports the conclusion that the departments with the smallest enrollments at a university assign the highest grades. One reason for this phenomenon may be that these departments may feel pressure to attract students to fill their classes. Since average grades and information about faculty grading habits are often available to students through institutional channels or through peers’ word-of-mouth, departments with fewer majoring students may intentionally offer higher grades. However, it is also possible that professors in smaller departments form closer relationships with students, resulting in higher quality of instruction and retention. Such rapport may also cause instructors’ reluctance to assign lower grades, as they have formed a more personal relationship with students.
conclusion and future work
This study collected data from 33 U.S. public universities, represented the data using a common format, documented the data, and made it easily available for public use [11]. This dataset can be used to investigate grading patterns at various levels and can be used to validate or refute the finding of smaller studies, especially the many studies that involve only a single university. Our publicly available dataset repository will also accept data submissions from additional universities, and thus can become an even more important resource for education researchers. We provide a hierarchy of academic disciplines that can be utilized to further standardize work in the area.
The dataset is limited due to privacy issues, in that grade data is not provided at the student level, so analysis of individual student grading patterns is not possible. However, we can still perform useful analyses, such as identifying instructors who assign statistically different grades than colleagues at the course, department, or institution level. Department heads and administrators can use this to improve fairness and ensure grades reflect student learning. Comparing instructor-associated grade variability across different universities may also lead to guidelines about interpreting specific grades.
This paper also provides some analysis of the data. In Section 3.1, we showed that A’s are the most awarded grade and that there is grade inflation, which surged temporarily due to remote learning due to the Covid pandemic. We further showed that science and math departments have markedly lower grades than most other departments and that there are very large differences in grading across departments and these differences are relatively consistent across universities. Our analysis also showed that departments with the very highest average GPAs tend to be the smaller departments within their universities. The dataset that we released can be used to conduct many additional analyses, and as mentioned, can be used to validate the results of smaller studies.
REFERENCES
- “College Majors by Academic Area of Study (for Field 32).” [Online]. Available: https://satsuite.collegeboard.org/media/pdf/college-majors-academic-area-study-regular-print.pdf. (Accessed: Feb. 02, 2024).
- A. D. Kugler, C. H. Tinsley, and O. Ukhaneva, “Choice of Majors: Are Women Really Different from Men?,” working paper, National Bureau of Economic Research, MA, USA, 2017, Available: https://doi.org/10.2139/ssrn.3029818.
- A. Nierenberg, “Nearly Everyone Gets A’s at Yale. Does That Cheapen the Grade?,” The New York Times, Dec. 05, 2023, Available: https://www.nytimes.com/2023/12/05/nyregion/yale-grade-inflation.html.
- B. W. Griffin, “Grading leniency, grade discrepancy, and student ratings of instruction,” Contemporary Educational Psychology, vol. 29, no. 4, pp. 410–425, Oct. 2004, Available: https://doi.org/10.1016/j.cedpsych.2003.11.001.
- C. A. Ramirez. FERPA clear and simple: The college professional's guide to compliance. John Wiley & Sons, 2009.
- C. Astorne-Figari and J. D. Speer, “Are changes of major major changes? The roles of grades, gender, and preferences in college major switching,” Economics of Education Review, vol. 70, pp. 75–93, Jun. 2019, Available: https://doi.org/10.1016/j.econedurev.2019.03.005.
- C. Koedel, “Grading Standards in Education Departments at Universities”, EPAA, vol. 19, p. 23, Aug. 2011.
- D. G. Freeman, “Grade Divergence as a Market Outcome,” The Journal of Economic Education, vol. 30, no. 4, p. 344, 1999, Available: https://doi.org/10.2307/1182948.
- E. C. Kokkelenberg, M. Dillon, and S. M. Christy, “The effects of class size on student grades at a public university,” Economics of Education Review, vol. 27, no. 2, pp. 221–233, Apr. 2008, Available: https://doi.org/10.1016/j.econedurev.2006.09.011.
- G. M. Weiss, L. A. L. Rosa, H. Jeong and D. D. Leeds, "An Analysis of Grading Patterns in Undergraduate University Courses," 2023 IEEE 47th Annual Computers, Software, and Applications Conference (COMPSAC), Torino, Italy, 2023, pp. 310-315, doi: 10.1109/COMPSAC57700.2023.00048.
- H. Jeong, G. M. Weiss, A. Leung, D. D. Leeds. Course Grades from 33 Public Universities [Dataset], 2024. https://www.kaggle.com/datasets/hyunjeong2023/edm-grading-dataset
- J. H. Tomkin and M. West, “STEM courses are harder: evaluating inter-course grading disparities with a calibrated GPA model,” International Journal of STEM Education, vol. 9, no. 1, Mar. 2022, Available: https://doi.org/10.1186/s40594-022-00343-1.
- J.E. Prather, and G. Smith, “A study of the relationships between faculty characteristics, subject field, and course grading patterns.” Research in Higher Education, vol. 5, pp. 351–363, 1976.
- K. Chen, Z. Hansen, and S. Lowe, “Why Do We Inflate Grades? The Effect of Adjunct Faculty Employment on Instructor Grading Standards,” Journal of Human Resources, vol. 56, pp. 0518-9493R2, Oct. 2019, Available: https://doi.org/10.3368/jhr.56.3.0518-9493r2.
- M. Beenstock, and D. Feldman, “Decomposing university grades: a longitudinal study of students and their instructors," Studies in Higher Education, vol. 43, no. 1, pp. 114-133, 2018, Available: https://www.sciencedirect.com/science/article/pii/S0272775707000271
- N. Rodríguez-Planas, “COVID-19, College Academic Performance, and the Flexible Grading Policy: A Longitudinal Analysis,” Journal of Public Economics, vol. 207, p. 104606, Jan. 2022, Available: https://doi.org/10.1016/j.jpubeco.2022.104606.
- National Center for Education Statistics. Integrated Postsecondary Education Data System. [Online]. Available: https://nces.ed.gov/ipeds/datacenter/. [Accessed Feb. 02, 2024].