ABSTRACT
The University of Buenos Aires has implemented distance education for postgraduate courses since 2015, facilitated by the Embedded Systems Laboratory of the Engineering Faculty. Dropout remains a challenge in distance education, prompting research into early warning systems using Learning Analytics and Educational Data Mining. Their ongoing research aims to identify student attributes linked to dropout, emphasizing the temporal aspect for timely intervention. By analyzing enrollment data and academic performance, machine learning algorithms, decision tree algorithms, are employed to identify key indicators of dropout. The research underscores the importance of context-specific and tailored solutions in the studied distance education postgraduate courses.
Keywords
1. INTRODUCTION
Thanks to technology, it is becoming possible to manage distance courses in educational institutions that have traditionally been face-to-face. An example is the University of Buenos Aires (UBA). The Embedded Systems Laboratory (in Spanish Laboratorio de Sistemas Embebidos (LSE))1 has a long history of teaching postgraduate courses since 2009, expanding its offerings to encompass a diverse range of disciplines and context. Since 2015, although standardized data has only been available since 2018 for this research, LSE of the UBA Faculty of Engineering has offered postgraduate courses with a distance education methodology.
Dropout is a important problem in a distance education [8]. Some research has proposed detecting reasons and behavioral patterns of students with thoughts of abandonment, and developing an intelligent system that alerts tutors [5]. It is important that the proposal can be an early warning system (EWS), which can be based on predictive models to predict students with difficulties and notify instructors so that they can obviously intervene early. However, building EWS is complicated and requires the preparation of some initial conditions, such as selecting the set of indicators that can best reflect the student’s behavior or selecting the best algorithm to predict possible failures [4]. Many systems that use Learning Analytics (LA) or Educational Data Mining (EDM) techniques have emerged in recent years as indicated in the publication by [6]. It is important to establish indicators that provide early warning of possible cases of dropout, although there are technical and methodological restrictions due to the information that the distance education system can offer [6].
The LSE distance education methodology does not use a standard distance educational platforms or an Learning Management Systems. LSE has proposed its own methodology guided by experience and available means. LSE has been a pioneer in distance education within the UBA. Thus, enough data has been collected to carry out a Data Mining study with the motivation of discovering the most common reasons why students dropped out. We describe the research that is currently being carried out and the first results in this poster. Our objectives are:
- Identify the student attributes or characteristics that are most important in identifying dropout;
- Study the temporal component of the identification of abandonment to notify as soon as possible;
- Propose an EDM system that adapts to the circumstances of the LSE educational system and that can work automatically.
In the realm of education, the interpretability of the results holds paramount significance [3]. Therefore, it stands as a pivotal concept guiding the mining process and is the main motivation that has guided the first objective. The research is in process. For this reason, this poster delineates our focus solely on achieving the first objective. Then, we are using enrollment data and their academic results before starting the final work. From this data a set of students’ features have been obtained. In addition to a class attribute that indicates whether the student completed the postgraduate degree or dropped out. We have trained machine learning algorithms, specifically decision tree algorithms in this instance, is to pinpoint the student features most critical to shaping the resultant model. The most important attributes in the model will describe the most representative features related to dropout.
The next section delves into the current research on dropout using data mining. We then explore the teaching and learning methodology used in LSE’s postgraduate courses, which is particularly relevant to the data and attributes employed in our research, which are escribe in section fourth. Subsequently, we describe the data mining process itself, followed by the initial results and their discussion. Finally, we conclude by outlining our findings and future research directions.
2. RELATED WORK
Dropout is a significant and extensively researched issue in higher education [2]. In the context of distance education, where students often experience increased feelings of isolation, this issue becomes even more salient [7]. Although our investigation focuses on determining appropriate student information and analysis techniques, it is rooted in this broader context.
[1] identified 112 factors for predicting university dropout, categorizing them across five dimensions: personal, academic, economic, social, and institutional. Additionally, they identified 14 data mining techniques, classifying them into artificial intelligence techniques and statistical methods. Decision trees have been widely proposed due to their flexibility in handling both numerical and categorical data, as well as their straightforward interpretability [11]. Algorithms such as ID3 (Decision Tree Classifier) have shown effectiveness in classifying students’ historical records, exhibiting higher sensitivity compared to alternative algorithms [10].
[8] underscored the importance of identifying the most informative attributes for early school leaving prediction to be utilized by suitable learning algorithms. This emphasizes the potential development of a support tool for tutors in preemptively identifying student dropout. The transparent nature of resulting models, facilitated by white box machine learning algorithms, is highlighted by [7] as crucial, considering that educators will need to implement appropriate measures. Both perspectives underscore the dynamic nature of the problem.
While our ongoing research prioritizes the identification of crucial characteristics using teacher-understandable analysis techniques, we have yet to delve into the temporal relationship aspect. Nevertheless, we recognize its significance in crafting a practical early warning tool [6].
3. POST GRADE METHODOLOGY
Since its establishment in 2009, the Embedded Systems Laboratory has been at the forefront of providing postgraduate courses. Over the years, the laboratory has expanded its offerings to encompass a diverse range of disciplines, thereby witnessing a steady increase in student enrollment. This growth underscores the laboratory’s commitment to fostering academic excellence and meeting the evolving demands of the field. Central to the success of the postgraduate program is its methodological approach, which serves as the cornerstone for effective teaching and learning.
- The postgraduate courses are structured into bimesters, each comprising a series of eight classes, one per week. Students are encouraged to enroll in three courses per bimester, with the aim of completing the program within five bimesters, provided they can dedicate sufficient time to their studies. This modular approach allows for a comprehensive understanding of the subject matter while accommodating the diverse needs and commitments of the students.
- Depending on demand, a new cohort for each career is opened every bimester. This flexible scheduling ensures that students have ample opportunities to join the program and progress through their chosen course of study at their own pace.
- The enrollment process for the program consists of several stages, which vary depending on the specific postgraduate program to which the student is applying. However, common to all pathways is an administrative interview and an assessment to ensure that the applicant possesses the minimum requisite knowledge to embark on the chosen program. These initial stages serve as a means of gauging the candidate’s suitability for the program and provide an opportunity for prospective students to learn more about the expectations and requirements of the Embedded Systems Laboratory’s postgraduate offerings.
- The course is delivered through synchronous virtual classes, each lasting three hours, held at fixed times throughout the duration of the program. Leveraging the Google Meet platform, students engage in real-time interactions with instructors and peers, fostering active participation and collaborative learning. To streamline attendance monitoring, an automated check-in system developed using a custom Apps Script ensures accurate tracking of student presence in each session. This technological integration enhances administrative efficiency and enables instructors to focus on delivering high-quality instruction while maintaining accountability within the virtual classroom environment.
- Each course instructor delineates the assessment methodology for their respective courses. This methodology is communicated to the students during the initial class session of the course. By providing clear guidance on evaluation criteria and expectations from the outset, instructors empower students to navigate their academic journey with clarity and confidence.
- Students are encouraged to commence work on their final project during the course of their studies. Recognizing the substantial commitment required for the successful completion of both coursework and the final project, students are allotted a maximum of 10 bimesters to finalize and present their final project. To support students in this endeavor, faculty members provide guidance and mentorship throughout the writing process, particularly in two specific courses. This structured approach ensures that students have access to the necessary resources and expertise to produce high-quality output within the stipulated timeframe.
- Upon commencement of their final project, students are closely monitored through monthly follow-ups on the interaction between the student and their assigned supervisor. This proactive approach enables ongoing assessment of the student-supervisor relationship, allowing for timely identification of any potential issues or challenges. In the event that concerns arise, the postgraduate program intervenes by facilitating communication between the involved parties and offering support and guidance to address and resolve the issue effectively.
- In order to present their final project, students must successfully complete the two courses associated with this requirement. The process of selecting the examination panel, or jury, for the final presentation follows two avenues: students may propose potential jurors, or faculty members may actively seek out suitable candidates during the course duration.
4. DATA AND STUDENTS ATTRIBUTES
According to the methodology explained above, information has been extracted from the students. Although a lot of information can be obtained, for this research we have focused on:
- The enrollment process. The student provides information related to: age; country; city; postgraduate (Yes 1/No 0), if the student has previously studied a postgraduate degree; type-job (0-No, 1-Student, 2-Developer, 3-Teacher, 4-Engineer, 5-Analyst, 6-Self employed worker, 7-Manager, 8-Others).
- From points 4 and 5 of the previous section the attributes are obtained for evaluations. A preprocessing has been carried out, calculating the average and standard deviations to carry out the analyzes. The attributes are: study; cohort; year; grade (average of all the evaluations); sd-grade (standard deviation); attendance (percentage of attendance in virtual classes); sd-attendance (standard deviation of attendance).
- The student’s condition, which says whether the student dropped out or finished. We only used two possible values: dropout or postgraduate. The attribute is: condition.
According to the dimension identified by [1], the first point in the above list is related to personal information need to register in the courses, while the second point pertains to academic information relation to the evaluations. The third point identifies class value. Due to the post grade methodology, the number of students in each cohort was around 20. Instances with any null value in any of the features were removed. Thus, the number of instances has been 175. It is important to clarify that this number does not refer to the number of students, but to the number of students who carried out a study in a certain cohort. The same student may have completed different studies in different cohorts. Therefore, multiple instances can refer to the same student.
5. DATA MINING PROCESS
The same data mining process has been carried out with three data sets. The mining process has been as follows: once the data has been cleaned, a decision tree algorithm, which haws been selected due to its interpretavility [3], has been trained to calculate the accuracy of the resulting model; The importance of each of the attributes of the data set has been calculated. The datasets used have been:
- Dataset-1-3: the data from The enrollment process and the current condition of the student, that is, the attributes gathered in points 1 and 3 of the previous section ;
- Dataset-2-3: the evaluation data and the current condition of the student, that is, the attributes gathered in points 2 and 3 of the previous section;
- Dataset-1-2-3: the data from The enrollment process, the evaluation data and the current status of the student, that is, the attributes gathered in points 1, 2 and 3 of the previous section.
We have trained the models, a decision tree algorithms, and we have tested the trained models, with each of the datasets, according to a standard process. Decision tree algorithms have the advantage of showing the results and the process of obtaining them. They are, therefore, understandable by humans. These algorithms show the reasoning followed to obtain the results in the form of a decision tree [3] and are capable of indicating the importance of the characteristics used in the classification quantitatively. The accuracy of the models has been calculated through cross validation. The resulting confusion matrix and accuracy after using a test subset of the datasets are also shown.
The objective of this ongoing research is to identify the important features in model training [9]. These features may be used by teaching teams, or the managers of postgraduate courses, to identify students at risk of dropping out. For this reason, the important thing about the mining process has been to quantify the importance of the datasets attributes for each of the models.
It has also been important to show the resulting decision tree. The decision tree reports the quantitative values of the attributes that indicate the limits to classify the instances in the class values: dropout or postgraduate.
6. RESULTS
Table 1 shows the accuracy of each model depending of the different dataset. The best accuracy (B accuracy) is the best results in the accuracy in the iterations through cross validation in the training process. The average accuracy (A accuracy) is the mean of the values obtained through cross validation. In addition, we have tested the models in the test process. The obtained accuracy is shown in Test accuracy (T accuracy).
| Dataset-1-3 | Dataset-2-3 | Dataset-1-2-3 | |
|---|---|---|---|
| B accuracy | \(0.857\) | \(1.0\) | \(1.0\) |
| A accuracy | \(0.707\) | \(0.836\) | \(0.807\) |
| T accuracy | \(0.6\) | \(0.686\) | \(0.743\) |
The confusion matrix is a useful tool to show how the model has classified for each value. In this case there are two values: Dropout or Postgraduate. The Table 2 shows the confusion matrices for each model. In the table, the letter D means Dropout and the letter P means Postgraduate.
| Dataset-1-3 | Dataset-2-3 | Dataset-1-2-3 | ||||
|---|---|---|---|---|---|---|
| D | P | D | P | D | P | |
| D | \(8\) | \(7\) | \(9\) | \(6\) | \(11\) | \(4\) |
| P | \(7\) | \(13\) | \(5\) | \(15\) | \(5\) | \(15\) |
Table 3 shows the importance of each model’s features. We can observe that the features are different for each dataset and the Dataset-1-2-3 contains the all of them. The importance of each value ranges from 0 to 1 within each dataset, summing up to 1 in total. This metric elucidates the extent to which the model relies on each characteristic. A value of 0.0 denotes non-utilization of the characteristic, thereby contributing to the model’s transparency and interpretability.
| Dataset-1-3 | Dataset-2-3 | Dataset-1-2-3 | |
|---|---|---|---|
| study | \(0.066\) | \(0.034\) | \(0.062\) |
| cohort | \(0.141\) | \(0.225\) | \(0.199\) |
| year | \(0.129\) | \(0.0\) | \(0.006\) |
| grade | \(0.290\) | \(0.288\) | |
| sd-grade | \(0.056\) | \(0.0\) | |
| attendance | \(0.182\) | \(0.163\) | |
| sd-attendance | \(0.212\) | \(0.212\) | |
| age | \(0.235\) | \(0.019\) | |
| country | \(0.108\) | \(0.0\) | |
| city | \(0.177\) | \(0.036\) | |
| postgraduate | \(0.0\) | \(0.014\) | |
| type job | \(0.143\) | \(0.0\) |
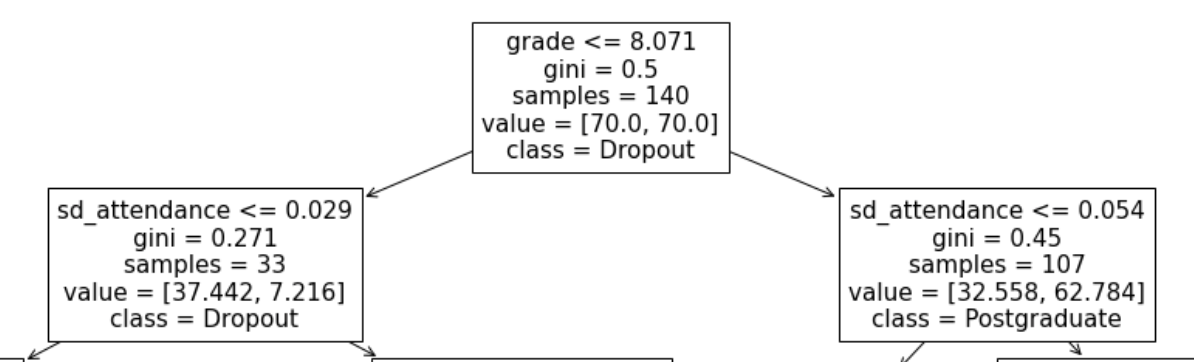
According to the results, the Dataset-1-2-3 model has an accuracy a little higher than the others, especially in the testing process. The representation of its decision tree is a bit complex to show on this poster. Then, we show only the first two levels of the decision tree. The Figure 1 shows the first three nodes of the first two levels.
7. DISCUSSION
The results indicate that the decision tree model using dataset-1-2-3 has achieved better accuracy than the other models. The differences between the different datasets are the features. The dataset-1-2-3 is a compendium of the others. There are features of the enrollment process and academic performance. When these features are taken into account together, the model is more accurate, although the characteristics of academic performance seem to have greater importance.
We can see in Table 3 that the grade and standard deviation of attendance are of great importance for the generated models. In addition, Figure 1, which is an extract of the decision tree, also reflects the importance of both characteristics.
The advantages of these features are that they can be calculated during the course. That is, it is not necessary to finish the course for the characteristics to become indicators of dropout. As seen in Figure 1, the grade feature, when it has a high value, is an indicator of good performance and that there will most likely not be dropped out. The sd-attendance characteristic indicates the variability in attendance in virtual classes that are part of the academic methodology of LSE postgraduate courses. It can be deduced that good performance and consistency or regularity are features that indicate that there will most likely not be dropped out.
However, the research, which is being developed, has clear disadvantages. The accuracy of the models (see Table 1), whose average does not exceed 0.75 with the test data, and the confusion matrices (see Table 2) also indicate that there may be significant errors when making decisions following the results of the models. This can be resolved taking into account that the objective of the research is to become an EWS [4] so that the teaching teams, or the managers of postgraduate courses, take the necessary measures that they consider appropriate to avoid dropout.
The research results, in their current state, suggest that the analysis process is capable of monitoring students throughout the course, with grades and attendance standard deviation as its main characteristics. Furthermore, as the analysis employs decision tree algorithms, teaching teams can comprehend the reasoning [11], facilitating decision-making deemed appropriate, considering the accuracy of the results, which is not particularly high. Thus, the analysis process could be generalized to other courses methodologies.
8. CONCLUSIONS AND FUTURE WORKS
We consider that the research, which is still in process, obtains appropriate results to continue with its objectives. Given the educational methodology of LSE postgraduate courses, the research has been focusing on the data that can be extracted and on proposing indicators. With these restrictions, the research has detected probable quantitative features related to dropout. Furthermore, these features can be measured during the course.
There are many issues that the research has not yet taken into account and that are part of the objectives. We are referring to the time factor. If the goal is to develop an EWS, the next steps of the research will have to consider the temporal analysis of the data while the courses are carried out. Furthermore, once the features most related to dropout have been identified, we have the possibility of using other classification algorithms that can do their job more accurately. We no longer have the restriction of using white box algorithms and having their processes understood by humans.
9. REFERENCES
- M. Alban and D. Mauricio. Predicting university dropout through data mining: A systematic literature. Indian Journal of Science and Technology, 12(4):1–12, 2019.
- A. B. Altamimi. Big data in education: Students at risk as a case study. Engineering, Technology & Applied Science Research, 13(5):11705–11714, 2023.
- A. R. Anaya, M. Luque, and M. Peinado. A visual recommender tool in a collaborative learning experience. Expert Systems with Applications, 45:248–259, 2016.
- R. Boudjehem and Y. Lafifi. An early warning system to predict dropouts inside e-learning environments. Education and Information Technologies, pages 1–21, 2024.
- R. M. M. F. Luis, M. Llamas-Nistal, and M. J. F. Iglesias. On the introduction of intelligent alerting systems to reduce e-learning dropout: a case study. Smart Learning Environments, 9(1):29, 2022.
- Nurmalitasari, Z. Awang Long, and M. F. Mohd Noor. The predictive learning analytics for student dropout using data mining technique: A systematic literature review. Advances in Technology Transfer Through IoT and IT Solutions, pages 9–17, 2023.
- A. Ortigosa, R. M. Carro, J. Bravo-Agapito, D. Lizcano, J. J. Alcolea, and O. Blanco. From lab to production: Lessons learnt and real-life challenges of an early student-dropout prevention system. IEEE Transactions on Learning Technologies, 12(2):264–277, 2019.
- C. Pierrakeas, G. Koutsonikos, A.-D. Lipitakis, S. Kotsiantis, M. Xenos, and G. A. Gravvanis. The Variability of the Reasons for Student Dropout in Distance Learning and the Prediction of Dropout-Prone Students, pages 91–111. Springer International Publishing, Cham, 2020.
- M. Saarela and S. Jauhiainen. Comparison of feature importance measures as explanations for classification models. SN Applied Sciences, 3:1–12, 2021.
- S. Sivakumar, S. Venkataraman, and R. Selvaraj. Predictive modeling of student dropout indicators in educational data mining using improved decision tree. Indian Journal of Science and Technology, 9(4), Jan. 2016.
- Yasmin. Application of the classification tree model in predicting learner dropout behaviour in open and distance learning. Distance Education, 34(2):218–231, 2013.