ABSTRACT
Collaborative game-based learning environments offer opportunities for students to participate in small group learning experiences that foster knowledge sharing, problem-solving, and engagement. Student satisfaction with their collaborative experiences plays a pivotal role in shaping positive learning outcomes and is a critical factor in group success during learning. Gauging students’ satisfaction within collaborative learning contexts can offer insights into student engagement and participation levels while affording practitioners the ability to provide targeted interventions or scaffolding. In this paper, we propose a framework for inferring student collaboration satisfaction with multimodal learning analytics from collaborative interactions. Utilizing multimodal data collected from 50 middle school students engaged in collaborative game-based learning, we predict student collaboration satisfaction. We first evaluate the performance of baseline deep learning models on individual modalities for insight into which modalities are most informative for understanding collaboration satisfaction. We then devise a multimodal deep learning model that leverages a cross-attention mechanism to attend to the salient information across modalities to enhance student collaboration satisfaction prediction. Finally, we conduct ablation and feature importance analysis to understand which specific combination of modalities and features is most effective. Our findings indicate that our multimodal model significantly outperforms its unimodal counterparts, underscoring the importance of diverse data sources in collaboration satisfaction prediction.
Keywords
Game-Based Learning
1. INTRODUCTION
Collaborative game-based learning environments represent a dynamic approach for creating interactive and immersive learning experiences, providing students with engaging opportunities for collaboration. In these environments, students actively contribute to shared learning objectives [42], which not only facilitates the development of critical thinking and communication skills but also fosters the construction of a robust knowledge base [43, 13, 27, 17]. Student satisfaction derived from collaborative endeavors plays a pivotal role in shaping teamwork dynamics, enhancing knowledge acquisition, and contributing to overall positive learning experiences [42]. Understanding student satisfaction can aid in the development of engaging learning environments that support positive learning outcomes. However, much work relies on post-hoc analysis of survey information with automated methods of assessment being relatively under explored.
Multiple signals, including gaze synchronization and physiological responses, offer valuable insights into the dynamics of collaboration, aiding in the understanding of student behaviors [33, 12]. Leveraging multimodal data sources offers promise to enable researchers to better capture and analyze student interactions within collaborative game-based learning environments. While previous studies have successfully predicted peer satisfaction in dyadic settings [25] from multimodal data, there remains a gap in exploring the prediction of multimodal student collaboration satisfaction in non-dyadic groups.
Our study aims to address this gap by focusing on the prediction of student satisfaction during collaborative learning in small group scenarios. Specifically, our aim is to develop predictive models capable of discerning collaboration satisfaction levels during collaborative interactions within a game-based learning environment. This entails leveraging a diverse array of data channels, including visual cues and interaction logs, to gain comprehensive insights into the dynamics of collaboration satisfaction. By undertaking this endeavor, we seek to contribute insights into the complexities of collaborative learning experiences and pave the way for enhanced support mechanisms aimed at fostering positive educational outcomes. These efforts can aid in our understanding of diverse types of collaboration that may be more difficult to carry out with conventional methods of analysis. Our research seeks to address the following three questions:
- RQ1: What are the individual modalities that contribute most significantly to the prediction of student collaboration satisfaction in collaborative game-based learning environments?
- RQ2: How does the integration of multiple modalities through a multimodal deep learning model, particularly employing a cross-attention mechanism, enhance the accuracy of predicting student collaboration satisfaction compared to unimodal approaches?
- RQ3: What specific combinations of modalities and features within the multimodal deep learning model are most effective in predicting student collaboration satisfaction, and what insights can be gained from feature importance analysis regarding their contribution to the prediction accuracy?
Motivated by our research questions, we conducted an in-depth analysis of multimodal data gathered from interactions among 50 middle school students within a collaborative game-based learning setting. Video recordings from laptop cameras captured facial expressions, eye gaze patterns, and head pose information, while trace logs documented student interactions within the learning environment. We temporally aligned and pre-processed the collected information for subsequent analysis. Our investigation into collaboration satisfaction was guided by Likert-scale survey responses collected within the game-based learning environment at the end of each gameplay challenge. Addressing our first research query, we delved into the performance of recurrent models across individual modalities, establishing baseline benchmarks for comparison with multimodal approaches. In response to our second research question, we formulated deep learning architectures incorporating cross-attention mechanisms to bolster collaboration satisfaction prediction and perform an ablation study to examine which specific combination of modalities most contributes to the models predictive performance. Additionally to answer our third research question, a comprehensive SHAP value examination [23] is conducted that elucidated the significance of features within the multimodal model and shed light on the attention mechanism’s ability to discern relevant data channels. Notably, our results demonstrate a marked enhancement in predictive accuracy achieved by the multimodal model compared to its unimodal counterparts. Furthermore, the SHAP value analysis underscores the model’s capacity to effectively leverage diverse data sources, despite variations in feature importance across modalities and collaborative cohorts. This improvement in predictive performance accentuates the potential advantages of leveraging a multitude of data channels for predicting student collaboration satisfaction in educational contexts
The remainder of this paper is structured as follows: Section 2 provides a review of prior research pertinent to student satisfaction, collaborative interactions in game-based learning environments, and multimodal learning analytics. Following this, Section 3 outlines the data collection, pre-processing, and alignment derived from student engagements within a game-based learning framework. In Section 4, we expound upon the experimental setup, delineating the architecture of the proposed multimodal model. Sections 5 and 6 delve into the experimental findings, examining how they address our research inquiries. Sections 7 and 8 cast light on potential limitations inherent in our study and chart promising avenues for future research endeavors.
2. RELATED WORK
This research lies at the intersection of student satisfaction analysis and collaborative game-based learning. We build upon the following body of literature.
2.1 Collaborative Game-Based Learning
Collaborative game-based learning environments offer significant promise in fostering collaborative learning experiences while providing insights on student collaborative dynamics, as extensively evidenced in literature [8, 20, 22, 18, 10]. By engaging students actively and promoting teamwork, these environments have proven instrumental in cultivating collaborative skills [31]. Moreover, digital games serve as a conduit to explore the relationship between learning outcomes and students’ preferences for cooperative versus collaborative gameplay. Notably, research suggests that in gender-balanced settings, collaborative gameplay can significantly enhance group learning outcomes [2]. However, efforts to delineate the theoretical underpinnings of collaboration within game-based learning contexts have been fragmented. While some studies integrate specific frameworks into their game design, a systematic framework elucidating the elements of collaborative learning remains elusive [39]. Conversely, a recent systematic review conducted by [13] underscores the role of game-based learning in fostering playful and enjoyable activities that bolster individual cooperation and collaboration skills. Crucially, the review highlights the pivotal importance of student satisfaction and motivation in the design of educational tools, emphasizing their impact on learning outcomes.
2.2 Student Satisfaction
Prior work has investigated the intricate relationship between student satisfaction and learning processes, whether facilitated through social media interfaces, online learning platforms, or hybrid instructional settings [1, 19, 35]. This research has shown that satisfaction with collaborative learning experiences can play a significant role in the perceived effectiveness of their learning experiences and is often associated with higher learning outcomes. A review of the literature by Yunusa & Umar [41] elucidates critical predictive factors (CPFs) that shape satisfaction and perceived learning outcomes, drawing insights from a comprehensive review of 53 research articles. Notably, collaborative engagement and instructional quality emerge as pivotal determinants influencing student satisfaction levels. While extant research underscores the positive association between satisfaction and academic achievement, recent inquiries have delved deeper into the nuanced effects of different learning environments on student satisfaction. For instance, Yu et al. [40] explore the impact of gamified elements on different aspects of student satisfaction, emphasizing their significance while also cautioning against premature conclusions regarding the relative effectiveness of distinct game-based learning environments. However, a significant gap exists in prior research, which predominantly relies on post-hoc surveys and overlooks automated methodologies for assessing learner satisfaction. The first work in this direction [25] represents a notable departure, focusing on predicting peer satisfaction in dyadic learning contexts through the analysis of linguistic, acoustic, and visual cues using regression models. Although initial findings regarding the efficacy of multimodal prediction remain inconclusive, this research serves as a precursor to our efforts, which extend beyond dyadic interactions to develop an automated framework for evaluating student collaboration satisfaction in small group scenarios within a collaborative game-based learning environment. Understanding student satisfaction with their collaborative experiences during game-based learning can help practitioners identify potential gaps or improvements to the underlying system.
2.3 Multimodal Learning Analytics
Multimodal learning analytics can provide a broad range of indicators pertinent of students’ collaborative engagement [36, 24, 5, 37]. Multimodal data can be effective in predicting affective states during collaborative activities [11], model cognitive load using physiological signals [6], and been used to uncover causal relationships between teacher actions and student responses during one-on-one coaching sessions [7]. Notably, Griffith et al. [14] undertake a comprehensive analysis of dialogue states and system interactions within dyadic groups, shedding light on how models of co-creative processes influence partner satisfaction. Their framework delineates actionable insights, pinpointing areas where support interventions can foster a more positive creative coding experience. Moreover, investigations into group speech and non-verbal audio cues exhibit promising potential in discerning quality collaborative interactions within co-located environments [30]. Leveraging Epistemic Network Analysis, researchers navigate epistemic and social spaces to understand role-to-role interactions and evolving collaboration patterns. By harnessing a variety of multimodal data [29], researchers demonstrated that integrating features at finer time scales serves as precise predictors of students’ learning gains. Despite the strides made in multimodal learning analytics, particularly in delineating collaboration dynamics, the exploration of student collaboration satisfaction within collaborative game-based learning environments remains relatively under explored.
3. DATASET
This work utilizes a collaborative game-based learning environment to develop an automated framework for predicting student satisfaction with their collaborative experiences. We detail the data collection process, learning environment, and pre-processing procedures in the following sections.
3.1 EcoJourneys Learning Environment
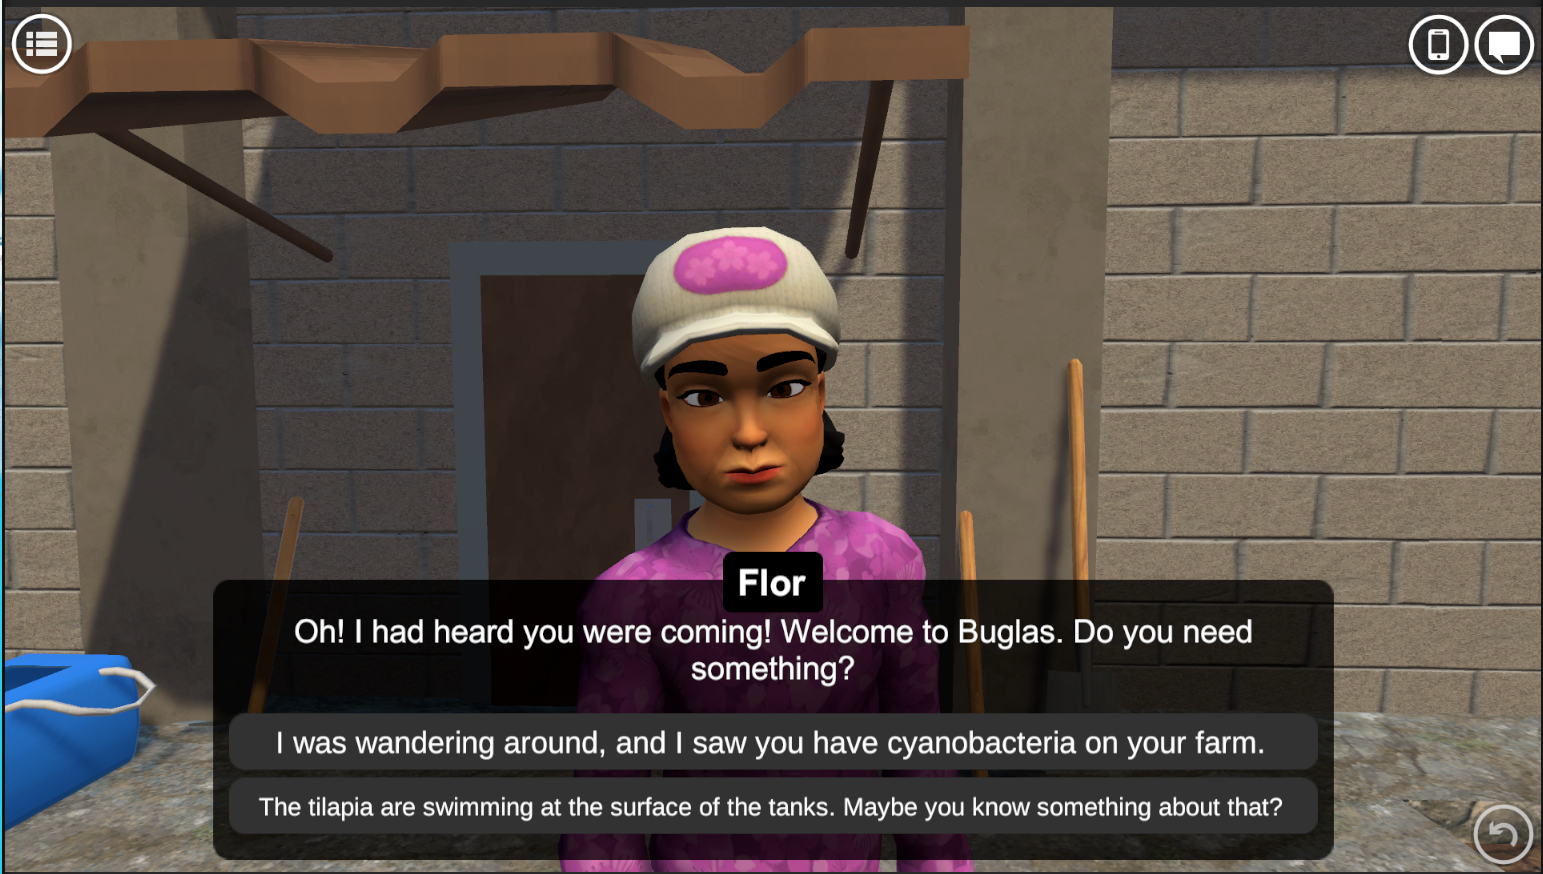
EcoJourneys is a collaborative game-based learning environment where small groups of middle school students work together to determine the cause of an unknown illness spreading amongst the fish population on a small island in the Philippines. At the start of the game, students learn from local farmers, non-player characters in the game, that the fish on their farms are showing signs of being ill. The students are tasked with helping the local stakeholders investigate why the fish are sick (Figure 1).
EcoJourneys incorporates a problem-based learning (PBL) inquiry cycle to guide students through the investigative process. Students use the TIDE cycle — consisting of Talk, Investigate, Deduce, and Explain — which serves as a scaffold for students to engage in specific actions aimed at understanding and solving the diagnostic problem presented in the game. Throughout the cycle, students utilize a virtual app for collaborative data analysis and a virtual whiteboard for collaborative reasoning, facilitating group discussions and decision-making processes. The incorporation of the PBL framework enhances the educational value of the game by promoting critical thinking, data analysis, and communication skills among students as they work together to solve complex ecosystem problems.
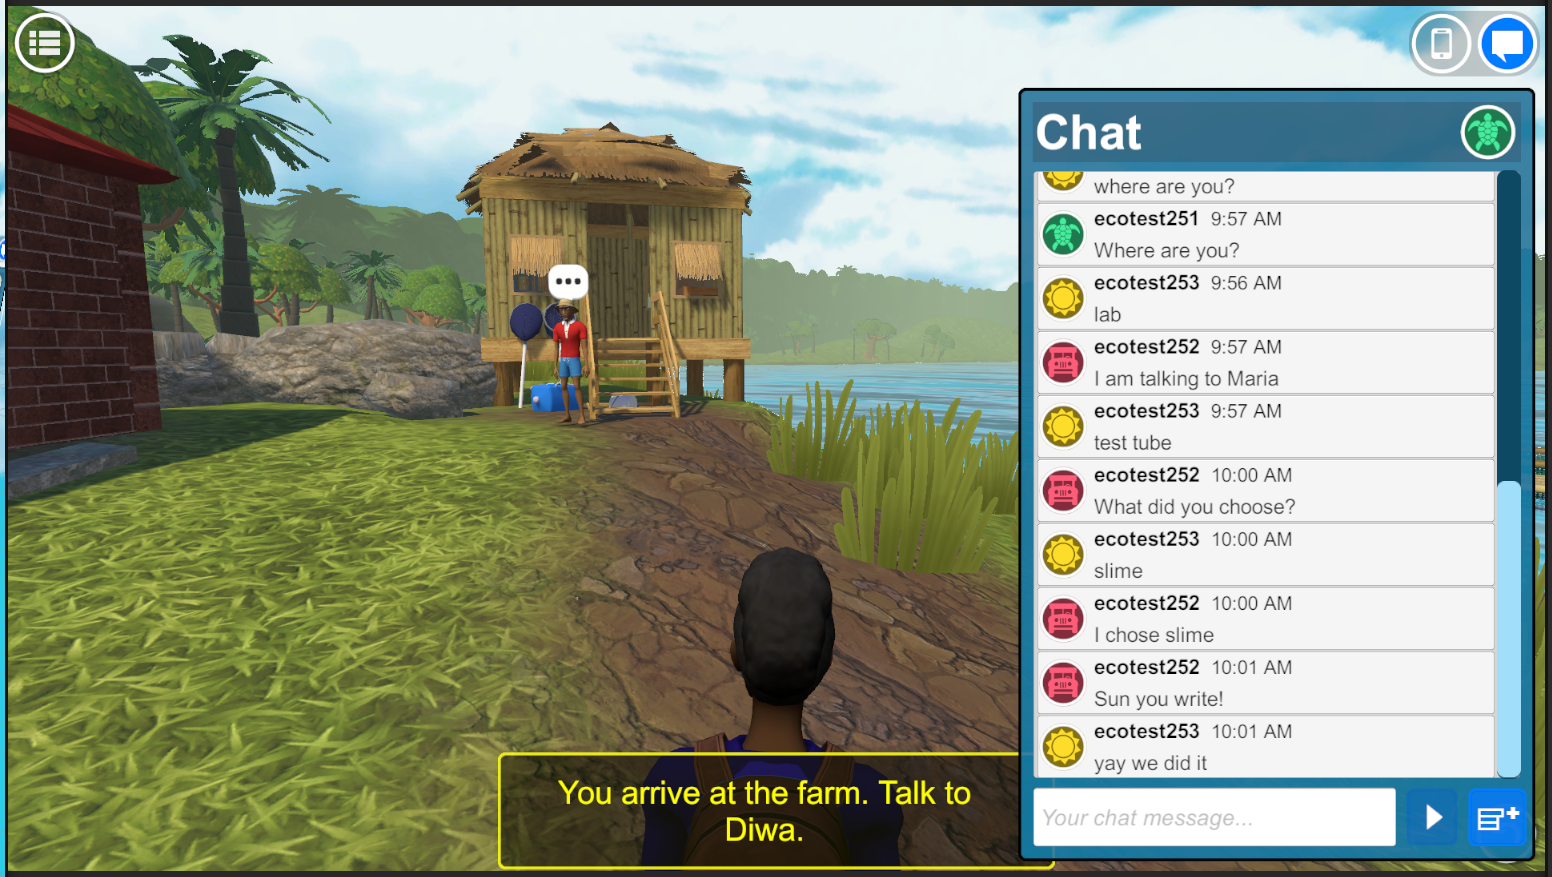
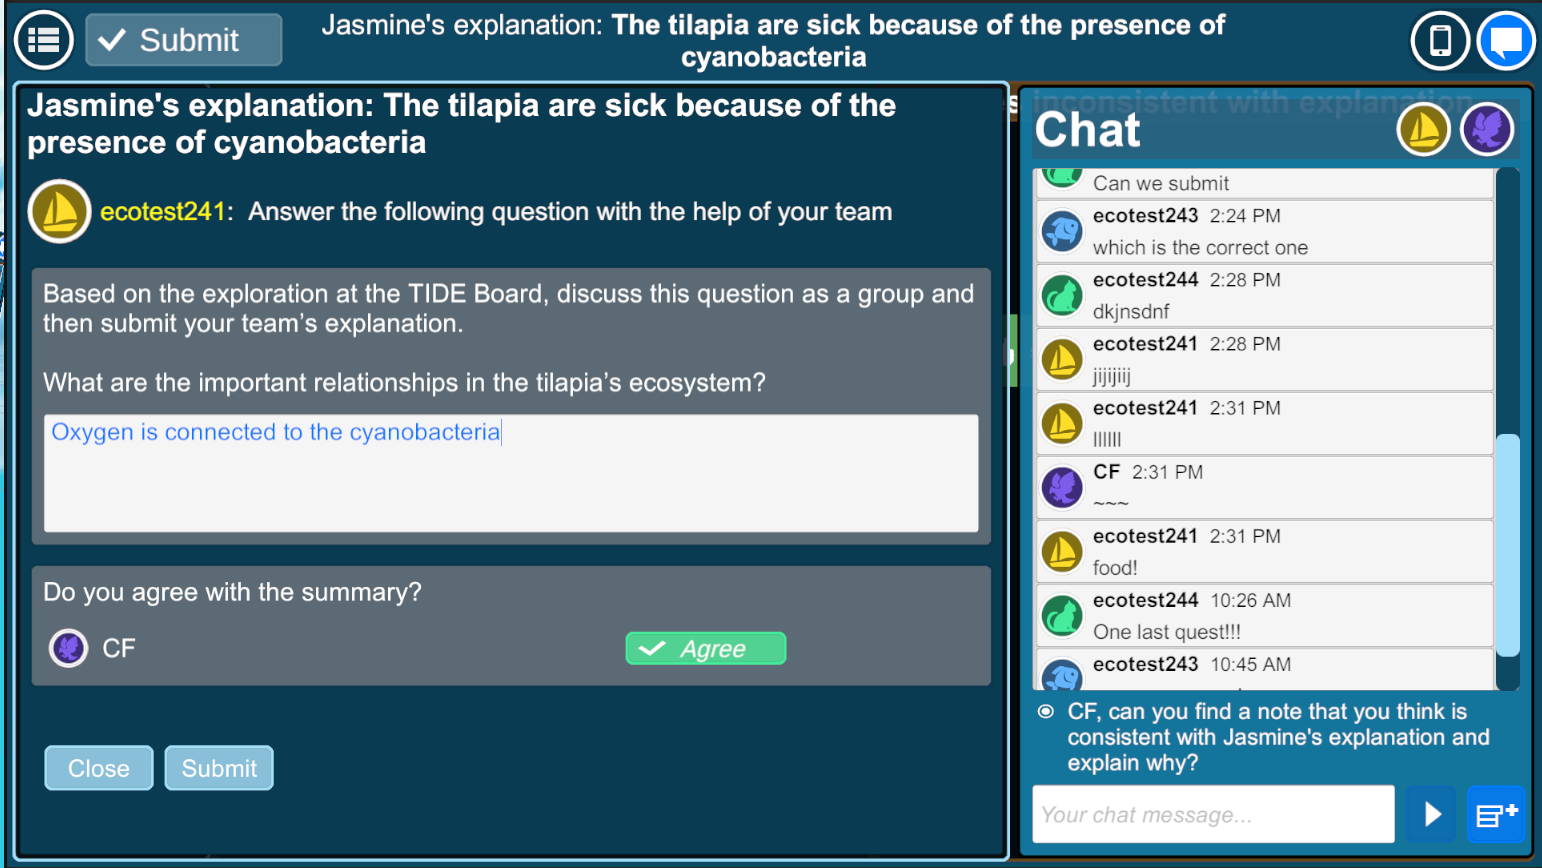
The game-based learning environment engages middle school students in understanding factors affecting ecosystems. Students spend time conversing with non-playable characters who disseminate knowledge and progress through the story line while also exploring the island, collecting, and analyzing information. As more information is gathered students discuss the evidence through the in-game chat interface to negotiate and support their hypotheses and arrive at a consensus on their conclusions regarding what is afflicting the fish (Figure 2 a). At predetermined intervals in the narrative, students come together at the virtual whiteboard within the game environment to organize the information they have collected and undertake collaborative discussions focused on their findings (Figure 2 b). Students must progress through four distinct activities within the game (a tutorial and 3 quests) to complete the game. After each activity students respond to an in-game exit survey that gathers information about students’ sentiments regarding their interactions.
Additionally, EcoJourneys collects extensive game play data, including students’ interactions, decision-making processes, and learning outcomes, which can be analyzed to gain insights into students’ problem-solving strategies and inform instructional design decisions for future iterations of the game. Overall, EcoJourneys provides an immersive and engaging learning experience that promotes collaboration, critical thinking, and scientific inquiry skills in students while exploring real-world environmental issues.
3.2 Data Collection and Demographics
We collected multimodal data with consent from 55 middle school students (6th-8th grade) aged 11-14 as they interacted with the EcoJourneys learning environment. There were 27 male, 22 female, and 6 non-binary students who participated in the study. Students interacted with the game environment over the period of 5-6 days and while most students completed all activities, on average 3.2 activities were completed by each student. After processing and removing students with missing post-survey information this resulted in 50 students having 164 activities containing video and trace log information that were used to predict their collaboration satisfaction at the end of each activity.
3.3 Data Alignment and Feature Processing
Prior work has shown the efficacy of video-based features with multimodal learning analytics. Facial action units have enhanced a variety of student modeling approaches to identify confusion [26], detecting impasse during collaboration [24], and elucidating the social norms that underlie creative collaboration [32]. Eye gaze information has been shown to perform well in assessing team collaboration [15], identifying characteristics of successful vs non-successful group collaborative recall [16], and can be an effective proxy for cognitive mechanisms underlying collaboration [34]. There has also been recent work that has utilized head pose information in predicting student engagement levels [38] and has been shown to be a valuable indicator of collaboration quality [9]. Our research utilizes video-based features extracted using the OpenFace v2.0 toolkit [3] from video recordings obtained via front-facing cameras. From OpenFace we extracted features including head pose, eye gaze and facial action unit information.
Facial action units (AUs) refer to the contractions or relaxations of one or more facial muscles. OpenFace v2.0 derives AU features in the form of continuous valued intensity information ranging from 0 (no intensity) to 5 (high intensity) as well as a binary valued AU presence data indicating whether a particular AU is present or not. For the purposes of our work, we utilize only the AU intensity information resulting from 17 distinct facial action units. Head pose information referring to students’ head location and direction contains translation and rotation based 3-dimensional coordinates. This information offers insights into the orientation and positioning of students’ heads with respect to the front-facing camera resulting in 6 head pose based features. Finally, eye gaze information details the direction that a person is looking in relation to the camera. It consists of three direction-based features (x, y, z coordinates) for each eye resulting in a total of 6 gaze-based features.
In tandem with facial analysis, students’ interactions within the learning environment are captured in detail through trace log data, documenting in-game actions such as NPC interactions, locations visited, evidence collected, and chat messages exchanged. Leveraging this rich textual data as an additional modality, we employ a pre-trained sentence embedding model derived from a BERT-based architecture, fine-tuned through unsupervised learning to produce robust text embeddings specifically tailored to the nuances of the trace log information. Employing a Byte-pair encoding-based tokenizer, we ensure the generation of unique encodings for trace log events, enhancing the model’s capacity to capture semantic and contextual nuances inherent in the data.
Following pre-training, the model weights are frozen, allowing for the encoding of trace log information, wherein each event is represented as a 768-dimensional vector, encapsulating the semantic essence of student interactions during game play. This approach ensures a nuanced representation of student interactions, facilitating comprehensive analysis and interpretation within the context of collaborative learning. Since the trace log information and facial feature data are sampled at different rates, with the former being slower, we performed synchronization to produce a uniform dataset. Specifically, we treated trace log events as the base sampling rate and averaged the facial feature values in between successive events.
We generate an encoding for each trace log event arising from students’ game play. Given the disparate sampling rates between trace log information and facial feature data, we needed to apply synchronization to ensure dataset uniformity. To this end, we devised a methodical approach for harmonizing these datasets by adopting trace log events as the baseline sampling rate and employing averaging techniques to synchronize facial feature values between successive events. Formally, denoting facial feature data as \(A(t)\) and trace log information as \(B(t')\), where \(t\) represents time and \(t'\) denotes the slower sample rate, we aligned the time steps to ensure correspondence [\(t = t'\)] for each interval \(I=[t_i, t_{i-1}]\): \begin {equation} A'(t) = \frac {1}{N_i} * \sum _{j=1}^{N_i}{A(t_j)} \end {equation} Here, \(A'(t_i)\) denotes the average of values within interval \(N_i\), with \(N_i\) representing the count of values in \(A\) within interval \(I\). This approach yields a synchronized dataset, wherein each trace log event \(B(t')\) corresponds to an average \(A'(t)\), representing the mean of values between successive events. Leveraging this synchronized dataset empowers us to delve into the nuanced interplay between different modalities in augmenting collaboration satisfaction prediction within the EcoJourneys learning environment.
3.4 Collaboration Satisfaction Survey
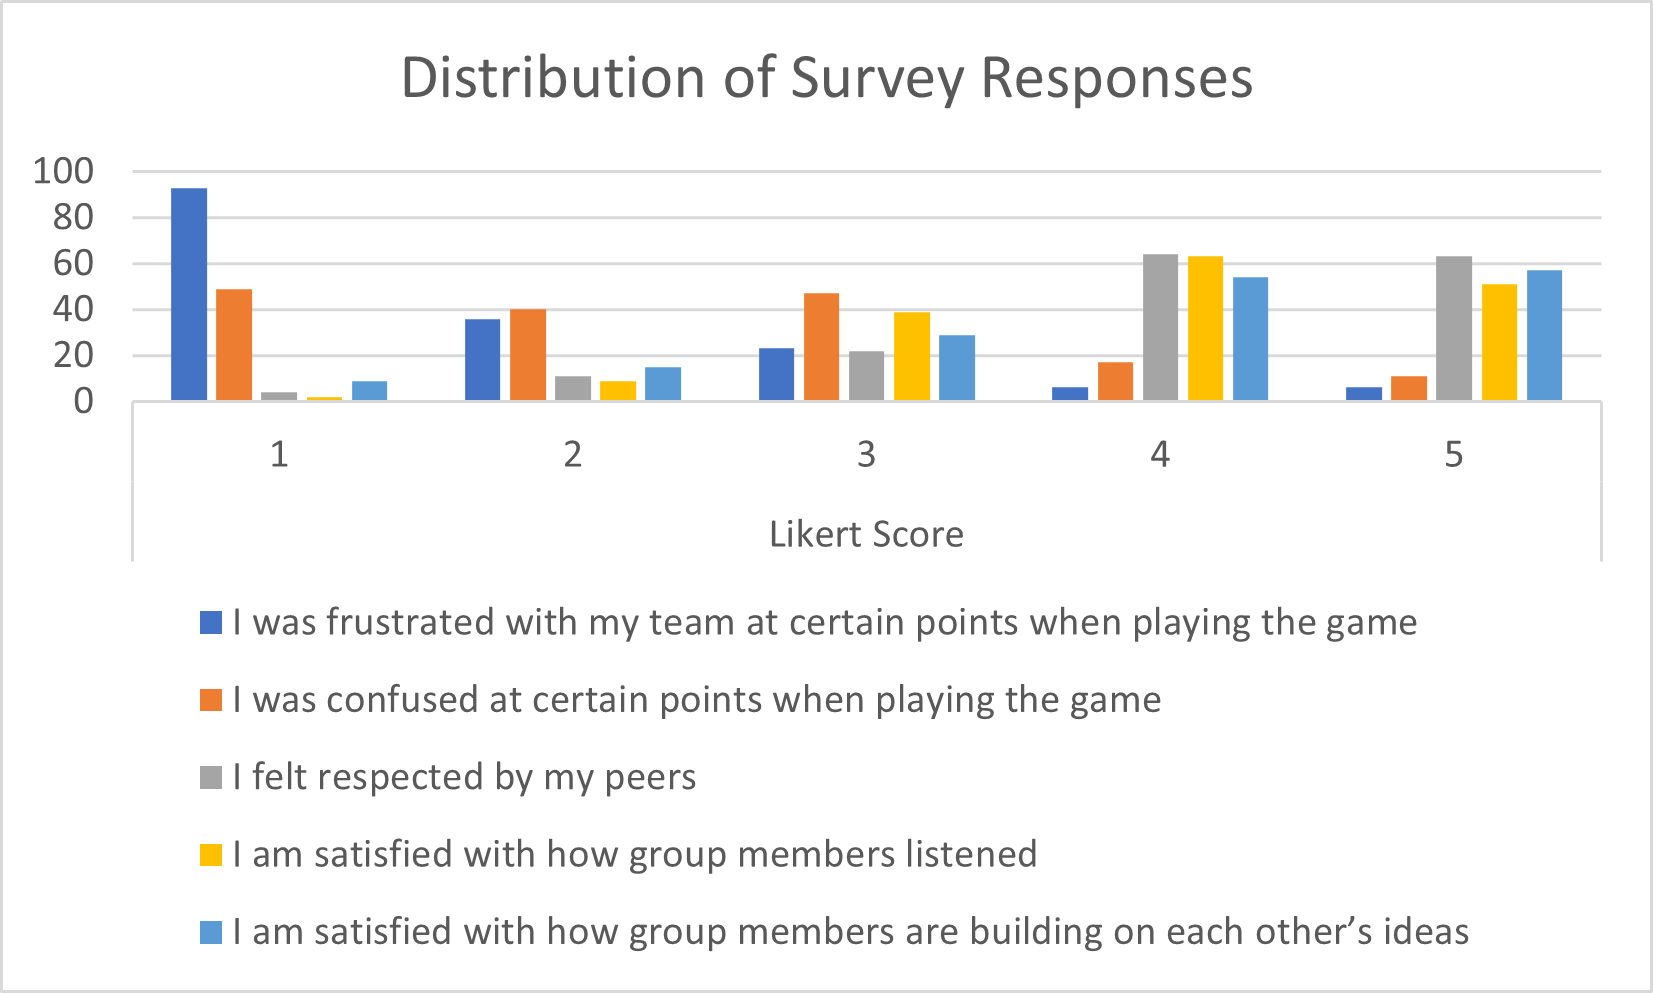
Within the EcoJourneys collaborative learning environment, students navigate through four activities, comprising one tutorial activity and three quests, culminating in the administration of an exit ticket survey at the conclusion of each activity. This survey encompasses five questions graded on a Likert scale, aimed at gauging students’ perceptions of their collaborative interactions. Referencing Figure 3, we delineate the content of each question, with our focus directed towards the following statements: 1) I am satisfied with how group members listened, 2) I am satisfied with how group members are building on each other’s ideas, for the purposes of student collaboration satisfaction prediction. The first statement probes students’ sentiments regarding the efficacy of group listening, whereas the second delves into the group’s aptitude in building upon one another’s ideas. These specific inquiries offer valuable insights into the dynamics of student collaboration within the learning environment, serving as pivotal metrics in our predictive framework.
We extend our problem formulation to encompass student satisfaction prediction, achieved by categorizing their responses to both statements into four distinct categories. A response scoring above 3 on both statement 1 and 2 denotes high satisfaction, whereas a score below 3 on both statements signifies low collaboration satisfaction. In instances where statement 1 scores below 3 but statement 2 scores above 3, students are classified as experiencing low listening/high building interactions, whereas the converse scenario indicates high listening/low building interaction. Despite a slight imbalance in class distribution, with students exhibiting high satisfaction levels constituting 59.7% of interactions and those with low satisfaction levels comprising 22.5%, the data reveals a nuanced spectrum of collaborative experiences. Interactions categorized as low listening or low building account for only 7.9% and 9.7%, respectively, out of a total of approximately 164 completed activities. This classification framework provides a lens through which to analyze and predict student satisfaction within the educational context.
Within this framework, we can develop predictive models to anticipate these class labels, offering insights into two pivotal factors: group listening behavior and idea building, both crucial in shaping student collaboration satisfaction. This annotation scheme zooms in on collaborative communication practices within each group, and leveraging automated methodologies to evaluate student collaboration satisfaction empowers educators to pinpoint potential shortcomings in group communication dynamics. This nuanced approach holds promise in enhancing the efficacy of collaborative learning environments, fostering more robust and productive interactions among students.
4. METHODOLOGY
Our research is concerned with comparing and contrasting the predictive performance of unimodal and multimodal modeling approaches. In the following sections we outline the setup of the unimodal modeling approaches as wells as provide details on the architecture of our proposed multimodal modeling technique employing cross-attention mechanisms.
4.1 Unimodal Modeling
This research explores the assessment of various modalities’ effectiveness in predicting student collaboration satisfaction. Initially, we investigate the predictive performance of each modality employing baseline recurrent neural networks, particularly long short-term memory networks (LSTMs). These baseline models are individually trained utilizing unimodal features to anticipate student collaboration satisfaction. The architectural schema of the unimodal models encompasses an LSTM encoder comprising 200 hidden units and 2 RNN neurons, with a dropout rate of 0.1. Additionally, a 2-layer feedforward neural network with ReLU activation is integrated as a classification head. The LSTM encoder processes normalized inputs from a given modality, with the final hidden state forwarded as input to the fully connected classification head for collaboration satisfaction prediction. Each model is trained on a single modality, and the resultant predictive performance is documented in Table 1. Through this line of inquiry, we aim to discern the optimal modalities for bolstering student collaboration satisfaction prediction within educational contexts.
4.2 Multimodal Modeling
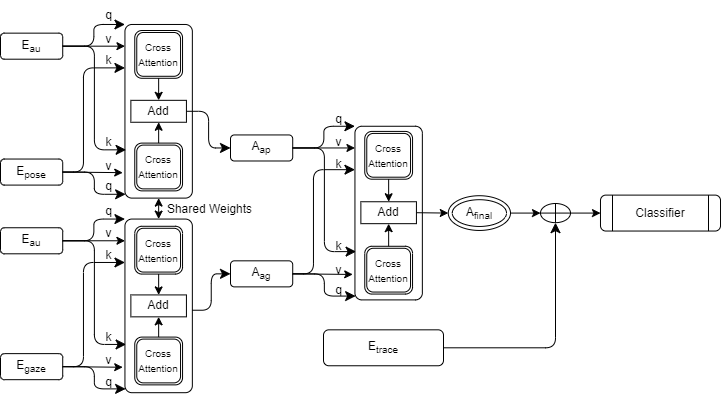
Recent research has illuminated the benefits of incorporating diverse data sources for student modeling and analysis. This study seeks to expand upon this foundation by conducting a comparative analysis between unimodal deep learning models and multimodal counterparts in predicting student collaboration satisfaction. Our multimodal approach incorporates a deep learning architecture with a cross-attention mechanism, facilitating a deeper understanding of the interactions among different data sources, which in turn enhances predictive accuracy. The architecture, detailed in Figure 4, employs GRU-based encoders with 2 RNN neurons to project data into a 32-dimensional embedding space for each video-based feature. These embeddings are then fed into an initial cross-attention layer. Formally, given video-based features \(X = {X_{au}, X_{pose}, X_{gaze}}\) and trace log information \(X_{trace}\), we derive modality-specific encodings. \begin {align} E_{au} &= GRU(X_{au}) \\ E_{pose} &= GRU(X_{pose}) \\ E_{gaze} &= GRU(X_{gaze}) \end {align}
The initial cross-attention layer utilizes two RNN-encoded modalities, designating one as the key and the other as the queries and values, which are then inputted into a multi-head attention layer. It then passes the inverse combination of modalities before summing the two representations. Formally, to generate the cross-attention representation for (AU, Pose), \(A_{ap}\), the following operation is performed by the first cross-attention layer: \begin {align} \begin {split} A_{ap} &= softmax(\frac {q(E_{pose})k(E_{au})}{\sqrt {d^k}})v(E_{pose}) \\ &+ softmax(\frac {q(E_{au})k(E_{pose})}{\sqrt {d^k}})v(E_{au}) \end {split} \end {align}
Similarly, the representation for the (AU, Gaze) based features can be obtained by: \begin {align} \begin {split} A_{ag} &= softmax(\frac {q(E_{gaze})k(E_{au})}{\sqrt {d^k}})v(E_{gaze}) \\ &+ softmax(\frac {q(E_{au})k(E_{gaze})}{\sqrt {d^k}})v(E_{au}) \end {split} \end {align}
These two sets of learned features are generated by the same cross-attention layer thus sharing the weights of this operation. Subsequently, these attention representations are combined utilizing a second cross-attention layer, this time attending to the important features across all modalities, culminating in a final attention map utilized for downstream processing. The final attention maps are produced by: \begin {equation} \begin {split} A_{final} &= softmax(\frac {q(A_{ap})k(A_{ag})}{\sqrt {d^k}})v(A_{ap}) \\ &+ softmax(\frac {q(A_{ag})k(A_{ap})}{\sqrt {d^k}})v(A_{ag})\\ \end {split} \end {equation} The attention map undergoes averaging along the sequence dimension to yield a fixed-length embedding of the video features. Concurrently, trace log information undergoes processing through a feedforward layer to project the data into a lower-dimensional space, aligning with the dimensions of the attention matrix. \begin {equation} E_{trace} = FFNN(X_{trace}) \end {equation} The projected trace log data and the derived attention map are added together before being processed by a 2-layer feedforward classification head, mirroring the unimodal architecture. \begin {equation} \hat {Y} = softmax(FFNN(A_{final} + E_{trace})) \end {equation}
Our architecture draws inspiration from the Self-Doc framework [21], particularly in the implementation of the cross-attention mechanism. However, we omit the self-attention block immediately following each cross-attention layer due to observed over-fitting which we attribute to the increased model complexity relative to our dataset size. In low-resource settings, where datasets may be limited, excessive model complexity can lead to over-fitting, diminishing generalization performance. Consequently, simplifying the architecture by removing redundant components, such as the self-attention block in our case proved to be beneficial. Moreover, as our architecture treats individual visual features as their own modality we perform additive fusion by adding cross-attention outputs from different combinations of keys, queries, and values to create the intermediate attention maps in our cross-attention layer. This process helps the model to learn two representations for each modality pair that when aggregated together, impart to the model information about how the two modalities are related and what parts of the combined features should be attended to. We train the model using cross-entropy loss and apply a dropout rate of 0.1 to the GRU encoders, serving as regularization for the cross-attention outputs to further mitigate over-fitting risks.
5. RESULTS
All models were trained and evaluated using student level 10-fold cross validation with the average results reported in tables 1 & 3. As a form of regularization models employed early stopping with a patience of 3 for monitoring the validation loss and were trained for a maximum of 500 epochs. All models utilized the Adam optimizer with a learning rate of 1e-3 and utilized a scheduler to reduce the learning rate when the loss plateaus.
5.1 Unimodal Results
The analysis depicted in Table 1 highlights the varying performance of individual modalities, with pose and AU features demonstrating relatively higher performance, with an accuracy of 66% (F1-score = 0.66), compared to gaze and trace features, which exhibit an accuracy of 65% (F1-score = 0.65), on average. The observed improvement (p-value < 0.05) in predictive performance compared to a majority classifier underscores the efficacy of these unimodal models for collaboration satisfaction prediction. However, Wilcoxon tests (Table 2) reveal no significant difference in performance between the unimodal models across various cross-validation folds, except for pose and gaze features (p-value < 0.05). Notably, the multimodal cross-attention model emerges as the front runner, significantly outperforming all other unimodal models, with an accuracy of 72%(F1-score = 0.72). These results underscore the effectiveness of leveraging multiple modalities for predicting student collaboration satisfaction.
| Unimodal vs Multimodal | ||
|---|---|---|
|
Model | F1-Score | Accuracy |
| AU | 0.66 | 0.66 |
| Pose | 0.66 | 0.66 |
| Gaze | 0.65 | 0.65 |
| Trace | 0.65 | 0.65 |
| Multimodal | 0.72 | 0.72 |
| Wilcoxon Tests | |||||
|---|---|---|---|---|---|
| AU | Pose | Trace | Gaze | Cross Attention | |
| AU | 1 | 0.69 | 0.27 | 0.105 | 0.003 |
| Pose | - | 1 | 0.064 | 0.015 | 0.001 |
| Trace | - | - | 1 | 0.51 | 0.001 |
| Gaze | - | - | - | 1 | 0.001 |
| Cross Attention | - | - | - | - | 1 |
5.2 Multimodal Results
Considering the enhanced performance observed in the multimodal cross-attention model compared to the unimodal baselines, we conducted an ablation study to pinpoint the crucial feature combinations contributing to this improvement. As depicted in Table 3, the full multimodal model significantly outperforms (p-value < 0.01) various ablated models, including combinations of trace log with visual features and other permutations of visual features alone. This underscores the substantial enhancement in collaboration satisfaction prediction facilitated by the integration of multiple modalities with the cross-attention mechanism. While there exists no significant disparity in performance between the full multimodal model and the trace log + AU only model, notable differences (p-value < 0.05) emerge between these two models and all other feature combinations except trace+AU+gaze. Notably, it is important to highlight that several models incorporating gaze features exhibit markedly lower (p-value < 0.05) predictive performance (accuracy and F1-score ranging from 0.64 to 0.65) compared to models excluding gaze features, except for the full multimodal model.
| Multimodal Ablation | ||
|---|---|---|
|
Model | F1-Score | Accuracy |
| Full Multimodal | 0.72 | 0.72 |
| Trace+AU | 0.70 | 0.70 |
| Trace+Pose | 0.69 | 0.69 |
| Trace+Gaze | 0.65 | 0.65 |
| AU + Pose | 0.68 | 0.67 |
| AU+Gaze | 0.65 | 0.65 |
| Pose+Gaze | 0.64 | 0.64 |
| Trace+AU+Pose | 0.70 | 0.70 |
| Trace+AU+Gaze | 0.67 | 0.66 |
| Trace+Pose+Gaze | 0.68 | 0.67 |
| AU+Pose+Gaze | 0.67 | 0.67 |
6. DISCUSSION
In this work we explored the efficacy of using video and trace log information in the task of student collaboration satisfaction prediction. For this purpose, we utilized facial action units, head pose, and gaze location information extracted from students faces along with trace logs produced during their interactions with the EcoJourneys game-based learning environment.
6.1 Role of Unimodal Features
RQ1: What are the individual modalities that contribute most significantly to the prediction of student collaboration satisfaction in collaborative game-based learning environments?
Upon deeper examination of our findings, we observe that unimodal LSTM models exhibit a significant improvement over a naive baseline (p-value < 0.05), demonstrating the effectiveness of unimodal RNN models in predicting collaboration satisfaction from individual modalities. However, when subjected to Wilcoxon tests during cross-validation, the performance disparity among these models appears to be insubstantial. Notably, the divergence between pose and gaze-based features (p-value < 0.05) implies a potential informational asymmetry, suggesting that pose features, capturing information on students’ body postures and movements, may provide more discernible cues pertaining to collaboration dynamics. This disparity underscores the potential complementary nature of these two modalities.
Despite the higher accuracy of pose features, the significant differences between gaze and pose modalities suggest that both contribute distinct information to the predictive task. Furthermore, these unique contributions potentially hint at interactions between the modalities. The comparable performance of AU and pose-based features may suggest a similarity in the information captured by these features for identifying student collaborative behaviors, while still offering valuable insights from each modality. Our analysis specifically addressing RQ1 reveals that each modality demonstrates comparable predictive prowess, with no single modality significantly outperforming others. The distinction between pose and gaze features underscores their complementary nature, a trait leveraged in the multimodal setting, as evidenced by its improved performance.
6.2 Multimodal Feature Ablation
RQ2: How does the integration of multiple modalities through a multimodal deep learning model, particularly employing a cross-attention mechanism, enhance the accuracy of predicting student collaboration satisfaction compared to unimodal approaches?
To better understand the contribution of individual modalities to the multimodal model, we initially performed an ablation study comparing the complete multimodal model to methods using different permutations of modalities. From Table 3 we see that the complete multimodal model consistently outperformed or performed comparably to ablated versions. Significant improvement is seen across all ablated methods that do not include both trace log and facial action units with the notable exceptions of the model that also included the pose information. Synergistic contributions from the combination of trace log, AU, and pose information may be learned by the model that enhances its discriminative ability. Specifically, this highlights the complementary nature of different modalities suggesting that each modality captures different aspects of collaborative interactions and contributes to a more comprehensive understanding for the model. A trend of poor performance is seen with all models that included gaze features, indicating that they may not be particularly suited for the task of collaboration satisfaction prediction. Interestingly, the inclusion of gaze features into the complete multimodal model did not impact its performance. This shows that the cross-attention mechanism is well suited for filtering out non-relevant information across individual modalities.
In addressing RQ2, we see that the multimodal cross-attention model can identify key synergies within each modality to enhance its predictive performance. Moreover, the proposed architecture can handle the incremental addition of modalities and if given the correct combination of modalities, it can allow it to identify a wider range of cues that are informative for collaboration satisfaction prediction. However, some modality combinations decrease the performance of the multimodal model, which highlights the importance of effectively integrating features to ensure that the model can leverage the diverse information provided by each modality. Similarly, it highlights the importance of choosing complementary information that avoids redundancy and conflicting signals. It is important to note that the observed decrease in performance for some sets of modalities shows the importance of balancing model complexity with predictive performance. While integrating more modalities may theoretically improve the models predictive capabilities there is a trade-off between complexity and performance.
6.3 Feature Importance Analysis
RQ3: What specific combinations of modalities and features within the multimodal deep learning model are most effective in predicting student collaboration satisfaction, and what insights can be gained from feature importance analysis regarding their contribution to the prediction accuracy?
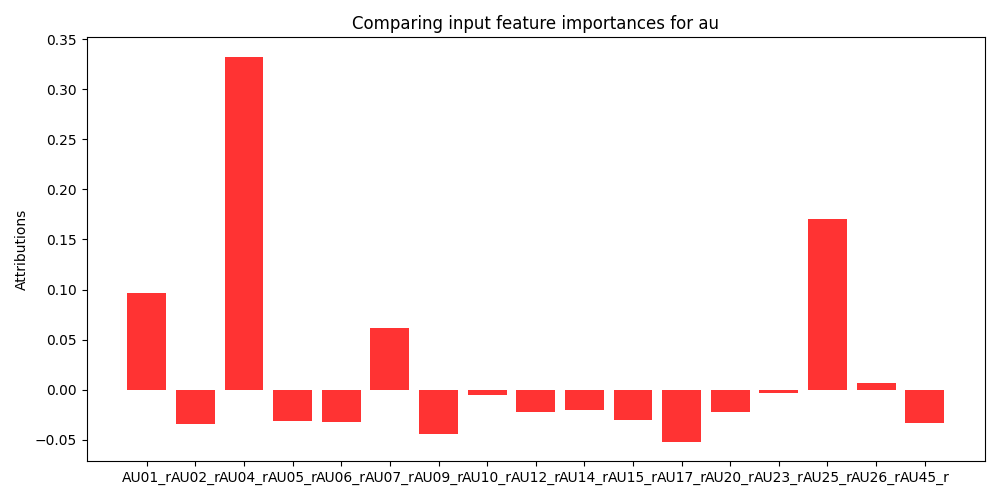
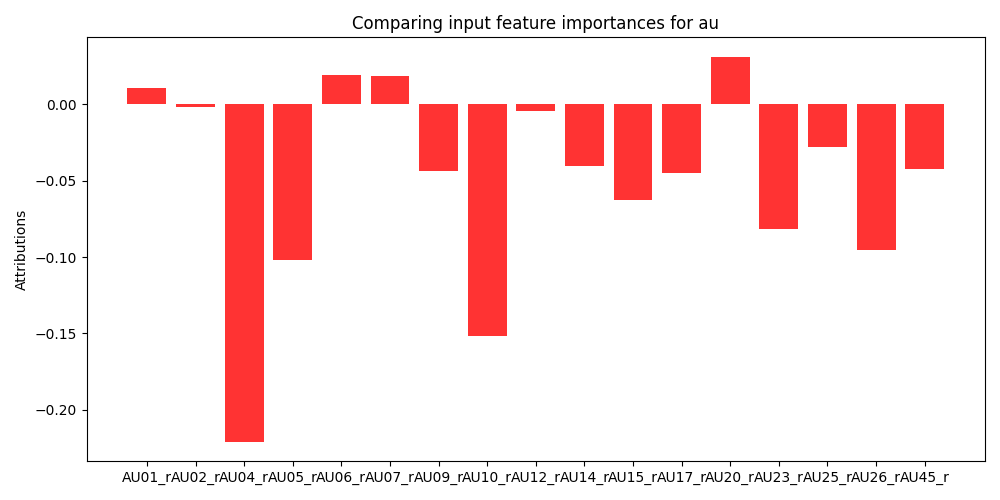
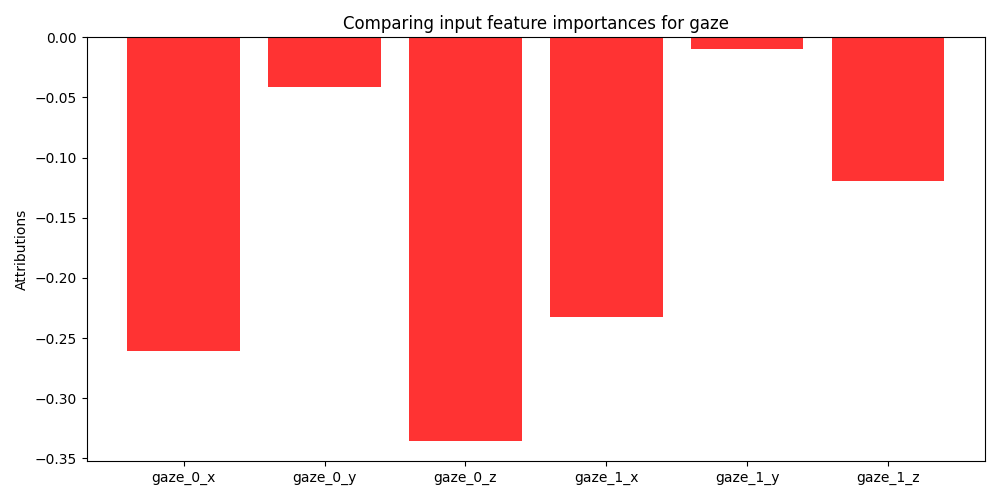
To further analyze the contribution of individual modalities we choose to perform a feature importance analysis. Specifically, we utilize Gradient SHAP to gather Shapley values generated by the model on the cross-validation folds with the highest and lowest performance (76% and 68% accuracy respectively). Shapley values are a game theoretic approach for identifying the contribution of different factors towards a cooperative goal. Specifically, traditional SHAP values represent feature importance for linear models in the presence of multicollinearity [23]. Since the proposed method utilizes non-linear models, we employ Gradient SHAP to estimate feature importance. Gradient SHAP approximates Shapley values by sampling from the baseline distribution to compute the expectations for gradients [23]. In Figure 5 we see the expected value of the gradients with respect to the input features for each modality used in the multimodal model. These figures demonstrate the difference in feature importance for different collaborative cohorts. We omit SHAP values from the trace log information because it consists of a 768-dimensional embedding where each dimension has no human-readable mapping. A thorough investigation into the quality of the textual embeddings within the trace log data is beyond the scope of the present work but offers a valuable avenue for future research.
In Figure 5 we see that for the \(8^{th}\) cross validation fold (Figure 5a) the model finds AU1, AU4, AU7, and AU25 are most informative while other action units are not very informative for this set of students. In contrast the model finds AU1, AU6, AU7, and AU20 to be most informative in the \(6^{th}\) cross validation fold (Figure 5b). Moreover, the model finds many more features to negatively contribute to the overall prediction task. Variation in informative AUs suggests that the importance of specific AUs may vary depending on the student cohort or interaction context. Accordingly, this variation may also show differences in student interaction dynamics such as facial expressions associated with engagement, attentiveness, or emotional states. Despite this variation there are specific AUs (AU1, AU7) that consistently emerge as positively contributing to predictive performance which may indicate that they capture essential facial expressions or emotional cues that are indicative of collaboration satisfaction. Prior work has observed that AU1 and AU7 can be associated with confusion, boredom, and surprise [28, 4]. The presence of large negative contributions from various action units underscores the importance of mitigating the impact of irrelevant features. Despite the challenge of manually identifying which features are most informative to predict student collaboration satisfaction, the proposed multimodal cross-attention model can ignore irrelevant information even when presented with noisy data.
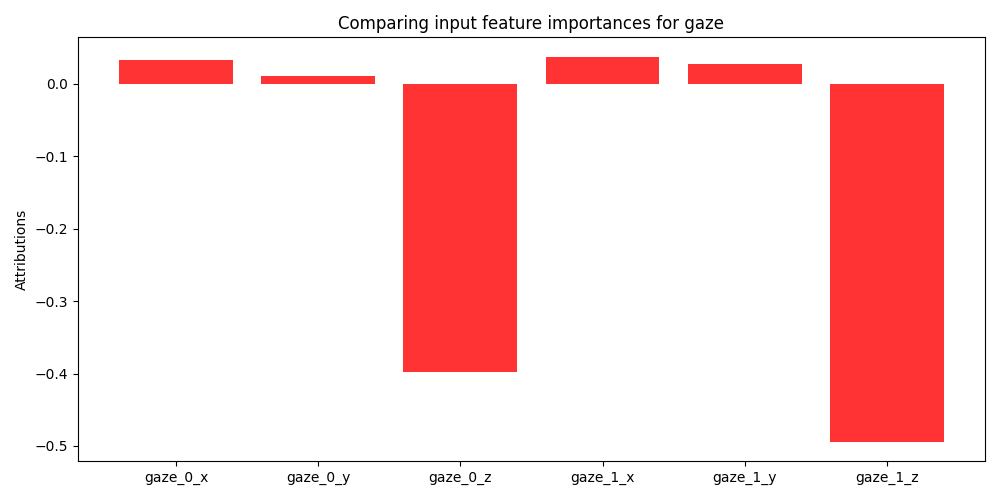
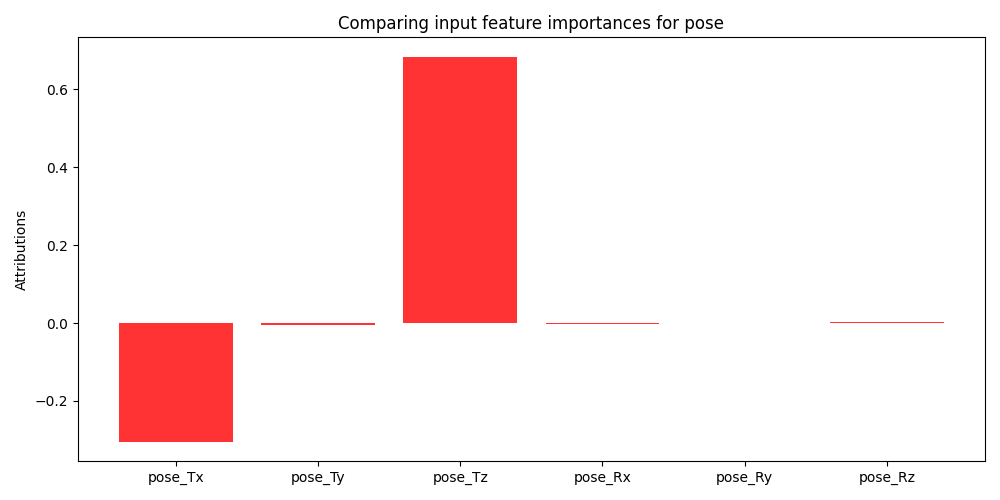
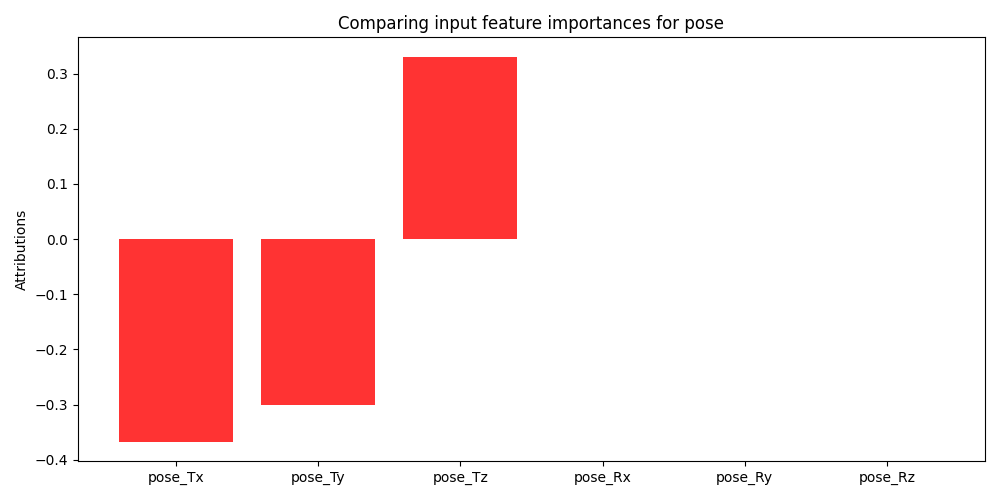
Examining the SHAP values for gaze features in Figure 6 we can clearly see why multimodal and unimodal methods that were dependent on gaze performed worse than models without, exclusive of the full multimodal model. For the \(8^{th}\) cross validation fold (Figure 6a), we see the model finds several features marginally important, x, y coordinates for each eye, while finding the z coordinate to be uninformative. This suggests that the horizontal and vertical positioning of gaze may be marginally more informative than the depth component (i.e., distance from the screen) of the data which may not capture aspects of collaboration dynamics. In contrast, none of the gaze features were found to be useful for the \(6^{th}\) cross-validation fold (Figure 6b) further elucidating the lack of contribution of the gaze-based features. However, looking at performance of the complete multimodal model compared to the ablated models, we see that the cross-attention mechanism can adapt to the gaze contributions of different interaction cohorts in conjunction with highly informative features. Finally, an examination of the SHAP values produced by pose-based features (Figure 7) reveals that the z coordinate corresponding to students’ head distance from the camera is seen to be the most informative. This suggests that head tilt or nodding behavior plays a crucial role in collaborative dynamics and may convey significant cues regarding their engagement or attentiveness during collaboration activities.
In addressing RQ3, we have shown that there are specific combinations of multimodal features that hold strategic importance in enhancing their predictive performance. Specifically, we find that AU1, AU7 are common important features across the best and worst performing multimodal models. Additionally, the horizontal movement of eye gaze (x and y coordinates for each eye) marginally contributed to model performance although overall gaze features were not shown to be particularly beneficial in predicting student collaboration satisfaction. Head tilt and nodding behavior associated with the z coordinate of head poses is consistently shown to be an informative feature and enhances the predictive capabilities of multimodal models.
7. LIMITATIONS
In this research we explore the task of predicting student collaboration satisfaction in small groups using multimodal data. However, there are a few limitations to our work. We derive collaboration satisfaction through a rule-based discretization of student responses to Likert valued questions. This measures an individual’s attitudes toward their group interaction; however, it does not specifically measure how well the group was satisfied with their collaborative efforts. It’s important to generate a holistic understanding of collaborative interactions by considering how each individual member contributed to overall group satisfaction. Additionally, we utilize data from a single game-based learning environment with 50 middle school students from 2 different schools with predominantly homogeneous ethnic backgrounds therefore it is important to note that the proposed method may not generalize well to learners in other populations or learning environments. Finally, during feature alignment we utilize trace data to discretize the facial feature information. The trace log information has an irregular temporal nature and therefore by averaging facial feature data in between trace events can skew values if there are long periods of time in between consecutive trace events. Small changes in facial feature information may be subsumed by long periods of time in between consecutive events leading to information loss.
8. CONCLUSION
We contrasted unimodal and multimodal deep learning models to predict student collaboration satisfaction while they interacted with a game-based learning environment. We contribute to the current body of research by exploring how various unimodal features contribute to the predictive performance of multimodal models. Additionally, we devised a multimodal deep learning model utilizing a cross-attention mechanism to attend to the most salient parts of the multimodal data that enhanced collaboration satisfaction prediction. We concluded by performing feature importance analysis for the highest and lowest performing multimodal models utilizing gradient SHAP to estimate the expected contribution of each input feature in relation to the final prediction outcome. We find that within each modality there is a smaller subset of features that are consistently important to model performance. Moreover, we find that the proposed cross-attention model can effectively mitigate the inclusion of extraneous and possibly noisy inputs.
There are several promising avenues to explore in future work. An important next step would be to investigate group level measures of student satisfaction with their collaborative experiences. As noted in the limitations above, this work utilizes only individual responses from Likert valued questions regarding their satisfaction levels. Deriving a group level metric based on student responses can lead to a more robust and holistic understanding of collaboration quality within groups. From an architectural standpoint exploring transfer learning of multimodal models to unimodal context can help bridge the gap in scenarios where one or more modalities are difficult or prohibitive to obtain. In our work, trace log information is a more stable modality as it is non-intrusive to collect and does not contain identifying information showing critical importance for privacy-preserving educational platforms. Distilling knowledge gained from the multimodal setting to the unimodal models additionally provides the benefit of reducing model complexity and increasing its range of deployment such as in low resource environments.
9. ACKNOWLEDGEMENTS
Part of the work on this project was funded by the National Science Foundation (NSF) under grant numbers ?, ? and ?
10. REFERENCES
- W. M. Al-Rahmi and M. S. Othman. Evaluating student’s satisfaction of using social media through collaborative learning in higher education. International Journal of advances in engineering & technology, 6(4):15–41, 2013.
- Y. Baek and A. Touati. Comparing collaborative and cooperative gameplay for academic and gaming achievements. Journal of Educational Computing Research, 57(8):2110–2140, 2020.
- T. Baltrusaitis, A. Zadeh, Y. C. Lim, and L.-P. Morency. Openface 2.0: Facial behavior analysis toolkit. In 2018 13th IEEE international conference on automatic face & gesture recognition (FG 2018), pages 59–66. IEEE, 2018.
- N. Borges, L. Lindblom, B. Clarke, A. Gander, and R. Lowe. Classifying confusion: Autodetection of communicative misunderstandings using facial action units. In 2019 8th International Conference on Affective Computing and Intelligent Interaction Workshops and Demos (ACIIW), pages 401–406, 2019.
- M. Bradford, I. Khebour, N. Blanchard, and N. Krishnaswamy. Automatic detection of collaborative states in small groups using multimodal features. In Proceedings of the 24th International Conference on Artificial Intelligence in Education, pages 767–773, 2023.
- M. Cai and C. D. Epp. Modeling cognitive load and affect to support adaptive online learning. In A. Mitrovic and N. Bosch, editors, Proceedings of the 15th International Conference on Educational Data Mining, pages 799–804, Durham, United Kingdom, July 2022. International Educational Data Mining Society.
- M. Cai and C. D. Epp. Modeling cognitive load and affect to support adaptive online learning. In Proceedings of the 15th International Conference on Educational Data Mining, page 799, 2022.
- D. Carpenter, A. Emerson, B. W. Mott, A. Saleh, K. D. Glazewski, C. E. Hmelo-Silver, and J. C. Lester. Detecting off-task behavior from student dialogue in game-based collaborative learning. In Artificial Intelligence in Education: 21st International Conference, AIED 2020, Ifrane, Morocco, July 6–10, 2020, Proceedings, Part I 21, pages 55–66. Springer, 2020.
- P. Chejara, L. P. Prieto, M. J. Rodríguez-Triana, A. Ruiz-Calleja, R. Kasepalu, I.-A. Chounta, and B. Schneider. Exploring indicators for collaboration quality and its dimensions in classroom settings using multimodal learning analytics. In European Conference on Technology Enhanced Learning, pages 60–74. Springer, 2023.
- X. Chen, D. Zou, H. Xie, G. Cheng, and F. Su. A bibliometric analysis of game-based collaborative learning between 2000 and 2019. International Journal of Mobile Learning and Organisation, 16(1):20–51, 2022.
- I. Daoudi, E. Tranvouez, R. Chebil, B. Espinasse, and W. L. Chaari. An EDM-based Multimodal Method for Assessing Learners’ Affective States in Collaborative Crisis Management Serious Games. In 13th International Conference on Educational Data Mining (EDM 2020), on line, France, 2020.
- Y. Dich, J. Reilly, and B. Schneider. Using physiological synchrony as an indicator of collaboration quality, task performance and learning. In Artificial Intelligence in Education: 19th International Conference, AIED 2018, London, UK, June 27–30, 2018, Proceedings, Part I 19, pages 98–110. Springer, 2018.
- I. Fonseca, M. Caviedes, J. Chantré, and J. Bernate. Gamification and game-based learning as cooperative learning tools: A systematic review. International Journal of Emerging Technologies in Learning (iJET), 18(21):4–23, 2023.
- A. E. Griffith, G. A. Katuka, J. B. Wiggins, K. E. Boyer, J. Freeman, B. Magerko, and T. McKlin. Investigating the relationship between dialogue states and partner satisfaction during co-creative learning tasks. International Journal of Artificial Intelligence in Education, 33(3):543–582, 2023.
- Z. Guo and R. Barmaki. Deep neural networks for collaborative learning analytics: Evaluating team collaborations using student gaze point prediction. Australasian Journal of Educational Technology, 36(6):53–71, 2020.
- C. B. Harris, P. Van Bergen, S. A. Harris, N. McIlwain, and A. Arguel. Here’s looking at you: eye gaze and collaborative recall. Psychological Research, 86:769–779, 2022.
- K. Hava, T. Guyer, and H. Cakir. Gifted students’ learning experiences in systematic game development process in after-school activities. Educational Technology Research and Development, 68:1439–1459, 2020.
- A. İlhan. The impact of game-based, modeling, and collaborative learning methods on the achievements, motivations, and visual mathematical literacy perceptions. SAGE Open, 11(1):21582440211003567, 2021.
- S. J. Lee, S. Srinivasan, T. Trail, D. Lewis, and S. Lopez. Examining the relationship among student perception of support, course satisfaction, and learning outcomes in online learning. The internet and higher education, 14(3):158–163, 2011.
- J. Li, Y. Lin, M. Sun, and R. Shadiev. Socially shared regulation of learning in game-based collaborative learning environments promotes algorithmic thinking, learning participation and positive learning attitudes. Interactive Learning Environments, 31(3):1715–1726, 2023.
- P. Li, J. Gu, J. Kuen, V. I. Morariu, H. Zhao, R. Jain, V. Manjunatha, and H. Liu. Selfdoc: Self-supervised document representation learning. In Proceedings of the IEEE/CVF Conference on Computer Vision and Pattern Recognition, pages 5652–5660, 2021.
- H.-Y. Liang, T.-Y. Hsu, G.-J. Hwang, S.-C. Chang, and H.-C. Chu. A mandatory contribution-based collaborative gaming approach to enhancing students’ collaborative learning outcomes in science museums. Interactive Learning Environments, 31(5):2692–2706, 2023.
- S. M. Lundberg and S.-I. Lee. A unified approach to interpreting model predictions. In I. Guyon, U. V. Luxburg, S. Bengio, H. Wallach, R. Fergus, S. Vishwanathan, and R. Garnett, editors, Advances in Neural Information Processing Systems, volume 30. Curran Associates, Inc., 2017.
- Y. Ma, M. Celepkolu, and K. E. Boyer. Detecting impasse during collaborative problem solving with multimodal learning analytics. In LAK22: 12th International Learning Analytics and Knowledge Conference, pages 45–55, 2022.
- Y. Ma, G. A. Katuka, M. Celepkolu, and K. E. Boyer. Investigating multimodal predictors of peer satisfaction for collaborative coding in middle school. International Educational Data Mining Society, 2022.
- Y. Ma, Y. Song, M. Celepkolu, K. E. Boyer, E. Wiebe, C. F. Lynch, and M. Israel. Automatically detecting confusion and conflict during collaborative learning using linguistic, prosodic, and facial cues. arXiv preprint arXiv:2401.15201, 2024.
- W. Mao, Y. Cui, M. M. Chiu, and H. Lei. Effects of game-based learning on students’ critical thinking: A meta-analysis. Journal of Educational Computing Research, 59(8):1682–1708, 2022.
- B. McDaniel, S. D’Mello, B. King, P. Chipman, K. Tapp, and A. Graesser. Facial features for affective state detection in learning environments, Jan 2017.
- J. K. Olsen, K. Sharma, N. Rummel, and V. Aleven. Temporal analysis of multimodal data to predict collaborative learning outcomes. British Journal of Educational Technology, 51(5):1527–1547, 2020.
- S. Praharaj, M. Scheffel, M. Schmitz, M. Specht, and H. Drachsler. Towards collaborative convergence: quantifying collaboration quality with automated co-located collaboration analytics. In Lak22: 12th international learning analytics and knowledge conference, pages 358–369, 2022.
- R. U. Puga. Game-based learning. a tool that enhances the collaborative work. case study: undergraduate students. In European Conference on Games Based Learning, volume 16, pages 570–577, 2022.
- J. Santuber, B. Owoyele, R. Mukherjee, S. Ghosh, and J. Edelman. Using body signals and facial expressions to study the norms that drive creative collaboration. In Digital Transformation of Collaboration: Proceedings of the 9th International COINs Conference, pages 17–32. Springer, 2020.
- B. Schneider and R. Pea. Toward collaboration sensing. International Journal of Computer-Supported Collaborative Learning, 9:371–395, 2014.
- K. Sharma, I. Leftheriotis, and M. Giannakos. Utilizing interactive surfaces to enhance learning, collaboration and engagement: Insights from learners’ gaze and speech. Sensors, 20(7):1964, 2020.
- H.-J. So and T. A. Brush. Student perceptions of collaborative learning, social presence and satisfaction in a blended learning environment: Relationships and critical factors. Computers & education, 51(1):318–336, 2008.
- E. L. Starr, J. M. Reilly, and B. Schneider. Toward using multi-modal learning analytics to support and measure collaboration in co-located dyads. International Society of the Learning Sciences, Inc.[ISLS]., 2018.
- A. E. Stewart, Z. Keirn, and S. K. D’Mello. Multimodal modeling of collaborative problem-solving facets in triads. User Modeling and User-Adapted Interaction, 31(4):713–751, 2021.
- Ö. Sümer, P. Goldberg, S. D’Mello, P. Gerjets, U. Trautwein, and E. Kasneci. Multimodal engagement analysis from facial videos in the classroom. IEEE Transactions on Affective Computing, 14(2):1012–1027, 2021.
- C. Wang and L. Huang. A systematic review of serious games for collaborative learning: Theoretical framework, game mechanic and efficiency assessment. International Journal of Emerging Technologies in Learning, 16(6), 2021.
- Z. Yu, M. Gao, and L. Wang. The effect of educational games on learning outcomes, student motivation, engagement and satisfaction. Journal of Educational Computing Research, 59(3):522–546, 2021.
- A. A. Yunusa and I. N. Umar. A scoping review of critical predictive factors (cpfs) of satisfaction and perceived learning outcomes in e-learning environments. Education and Information Technologies, 26:1223–1270, 2021.
- J. Zambrano, P. A. Kirschner, and F. Kirschner. How cognitive load theory can be applied to collaborative learning. Advances in cognitive load theory: Rethinking teaching, 30, 2019.
- C. Zhu. Student satisfaction, performance, and knowledge construction in online collaborative learning. Journal of Educational Technology & Society, 15(1):127–136, 2012.