ABSTRACT
ALEKS is an adaptive learning and assessment system, with courses covering subjects such as math, chemistry, and statistics. In this work, we focus on the ALEKS math courses, which cover a wide range of content starting at second grade math and continuing through college-level precalculus. To help instructors and students navigate this content, the system recently introduced an adaptive placement assessment for its K–12 users in the U.S. This assessment evaluates a student’s mathematical knowledge and recommends the most appropriate ALEKS course for that student. In what follows, we present several evaluations of this placement assessment. After first analyzing the performance of the assessment with standard classifier metrics, such as AUROC, we next look in more detail at the accuracy of the knowledge states—that is, we look at the accuracy of the assessment when classifying problem types as being known or not known by students. For our last analysis, we look at student outcomes in their ALEKS courses after taking the placement assessment. We then finish with a discussion of these results and their implications for the assessment.
Keywords
1. INTRODUCTION
The ALEKS adaptive learning and assessment system is based on knowledge space theory (KST), a mathematical framework for modeling and assessing student knowledge [8, 9]. ALEKS course products cover subjects such as chemistry, statistics and, of particular importance for this study, mathematics. The ALEKS math courses start at second grade and continue through college-level precalculus. Due to this large selection of available courses, recently there has been an increasing number of requests from ALEKS K–12 users for guidance on how to select the most appropriate courses for students. While an ALEKS placement assessment for colleges and universities has existed for a number of years, at the time no equivalent assessment existed for K–12 students. As such, an adaptive placement assessment was designed specifically for K–12 students and released in the spring of 2022.
In this work, we evaluate the ALEKS K–12 placement assessment by analyzing its performance from several viewpoints. After giving background info on the ALEKS system and the placement assessment, our first analysis looks at the performance of the assessment using standard classifier metrics, such as area under the receiver operating characteristic curve (AUROC) and point biserial correlation. Next, we evaluate the knowledge states returned by the placement assessment—in particular, we look at the accuracy of the assessment when problem types are classified as being known or not known by students. For our last evaluation, we then focus on student performance in their ALEKS courses after taking the placement assessment, as the ultimate goal of the assessment is to place students in courses they can learn appropriately in. We conclude with a discussion of the results and some possible directions for improvement to the placement assessment.
2. BACKGROUND
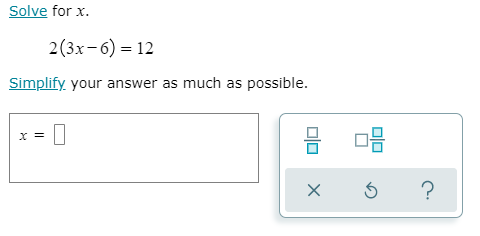
A topic in the ALEKS system is a problem type covering a discrete unit of an academic subject. Rather than employing multiple choice questions, the majority of ALEKS topics require open-ended responses. An example topic, titled “Introduction to solving an equation with parentheses,” is shown in Figure 1. At the heart of the ALEKS system is an adaptive assessment that focuses on identifying a student’s knowledge state—that is, the topics a student most likely knows. Adaptive assessments based on knowledge space theory (KST) have a rich history in education [5, 6, 13, 15], and over the years the ALEKS assessment in particular has been evaluated in several studies; these include evaluations of the general ALEKS assessment [3, 4, 19], as well as analyses specific to the placement assessment used by colleges and universities [1, 4, 7, 19, 22].
The focus of our study is the ALEKS K–12 placement assessment, an assessment designed to evaluate a student’s mathematical knowledge and recommend the most appropriate ALEKS K–12 math course for the student. The placement assessment is powered by a neural network model that, for each topic, estimates the probability the student can answer the topic correctly [19], and it is currently available for students in a selection of ALEKS course products, starting with Sixth-Grade Mathematics and continuing up to Algebra 2. The assessment is adaptive, as the questions that are asked depend on the student’s previous responses, with at most 16 questions being asked during one assessment. At the end of the assessment, the system uses the aforementioned probability estimates, along with the student’s responses, to determine the student’s knowledge state. This knowledge state is computed on a set of up to 501 topics, with the exact set of topics being determined by the student’s starting course product. We define a student’s placement score to be the proportion of the topics from this set that are classified as being in the student’s knowledge state at the end of the placement assessment. Based on this score, an ALEKS course is then recommended to the student. If the student’s score is below a certain threshold, a preparatory course is recommended, with this course being designed to teach the student the prerequisite material needed to successfully complete the material in the course they started in. Additionally, it may be recommended that the student stay in their starting course, or the recommendation might be to move them to a higher course—this higher course could either be the next course or, in some cases, a course two or even three levels up.
For example, suppose the student starts in the course Sixth-Grade Mathematics. Based on their placement performance, the student can either be recommended a preparatory course (0), the starting course of Sixth-Grade Mathematics (1), Seventh-Grade Mathematics (2), Eighth-Grade Mathematics (3), or Algebra 1 (4). In comparison, suppose a student starts in Algebra 2. They can receive a recommendation for a preparatory course (0), the starting Algebra 2 course (1), or Precalculus (2). However, as no higher ALEKS course exists, students starting in Algebra 2 cannot receive a recommended course higher than Precalculus.
After a student takes the placement assessment, they next work in a specific ALEKS course product; this could be their starting course, or a different one, depending both on what course was recommended by the assessment and whether the instructor chose to follow that recommendation. (It should be mentioned that instructors are not obligated to follow the recommendations of the placement assessment.) In all cases, within an ALEKS course students are grouped into classes—that is, groups of students who share the same instructor. While each class consists of students from the same institution, an institution may have multiple classes, and these classes may or may not correspond to the physical classes used on campus. Regardless of what course the student ends up working in, they start by taking an initial assessment, which has the goal of identifying the student’s knowledge state for the topics in the course. After the initial assessment, the student then enters the learning mode, where they work on topics one at a time, until they demonstrate sufficient mastery of the topic. Periodically during the student’s work in the learning mode, a progress assessment is given to check the student’s understanding of the material, as well as to act as a mechanism for spaced practice and retrieval practice [17, 18].
3. EVALUATING THE PLACEMENT ASSESSMENT
In order to analyze the performance of the placement assessment, we make use of an extra problem that is chosen randomly from all the possible topics in the placement assessment and asked as one of the (at most 16) assessment questions. However, the response to this extra problem does not affect the student’s placement results and is instead used to evaluate the performance of the assessment. For our analyses, the responses to the extra problems constitute our labeled data—1 for a correct answer and 0 otherwise. Using the probability estimates returned by the placement assessment, we can then measure the performance of the assessment by applying standard techniques for evaluating binary classification models.
To start, we evaluate the probabilities using the area under the receiver operating characteristic curve (AUROC) and point biserial correlation (\(r_{pb}\)). AUROC is widely used to evaluate binary classifiers, and it is known for being robust to class imbalances [10]. Point biserial correlation is a special case of the Pearson correlation coefficient, where it is applied to one dichotomous variable (the student response) and one continuous variable (the probability estimate). We apply these measures to all 116,276 placements assessments taken during the time period from March 2022 through January 2024. While we do not have demographic information on any ALEKS users, we can say that, overall, the program is used at a wide variety of K–12 schools across the U.S., with a total K–12 user base of over 3 million students. Additionally, appropriate consents are collected and notice provided to all our users via our Terms of Service and Privacy Notice, which specify the use of the data for research purposes and product improvements.
The results are shown in Table 1, along with the correct answer rate to the extra problems. Additionally, the 95% confidence intervals for these values are shown in parentheses. Because the students in our data are clustered into classes, the confidence intervals are computed using 100,000 cluster bootstrap samples [11], with each of the 8,442 classes representing an individual cluster in our data.1 To give some context for the AUROC and point biserial correlation values, they are comparable to those obtained from previous evaluations of the ALEKS college placement assessment [4] and standard (i.e., non-placement) ALEKS products [4, 19].
| N | Correct rate | AUROC | \(r_{pb}\) |
|
116,276 | 0.483 | 0.889 | 0.682 |
| (0.478, 0.489) | (0.887, 0.891) | (0.678, 0.685) |
To get a sense for how the performance varies by topic, we next compute the AUROC scores separately for each of the 501 topics. Specifically, we find all of the topics that appear at least 300 times as the extra problem. For each of these topics, we then compute the AUROC value for the specific cases when the topic appears as the extra problem. The results are shown in Figure 2, where we plot the AUROC score for each topic against the extra problem correct answer rate for that topic. Of the 248 topics that appear at least 300 times, the AUROC scores range from a minimum of 0.65 to a maximum of 0.94, with the mean and median values both being 0.84. While there appears to be a slight degradation in the AUROC values for the topics with higher correct answer rates, overall the vast majority of the topics are performing acceptably. However, there are two outlier topics that, as measured by AUROC, have lower performing probability estimates. As the reason for this poor performance is not obvious to us, this information has been passed on to our placement assessment content experts, who are now looking at this issue in more detail.

4. ACCURACY OF THE KNOWLEDGE STATE
For our next analysis, we look at the classification of the extra problem made by the placement assessment. As mentioned previously, the student’s knowledge state is derived by identifying the topics that the placement assessment deems to be most likely known by the student; these topics are classified in the “Known” category. Additionally, the assessment classifies the topics into two other categories: “Unknown” items are those the placement assessment strongly believes the student has not learned yet, while all the remaining topics that are neither “Known” or “Unknown” are then classified in the “Uncertain” category. In Table 2 we show statistics based on these classifications—in particular, for each category we show the proportion of, and correct answer rate for, the extra problems in that category. Since the extra problem is sampled uniformly from all of the available topics, these statistics measure the average behavior of the placement assessment and, as such, give a good summary of its overall performance. Lastly, as before, the confidence intervals are computed using 100,000 cluster bootstrap samples, with each ALEKS class corresponding to an individual cluster.
| Classification | Proportion | Correct rate |
|
Known | 0.424 | 0.834 |
| (0.418, 0.430) | (0.830, 0.837) | |
|
Unknown | 0.336 | 0.084 |
| (0.330, 0.342) | (0.081, 0.087) | |
|
Uncertain | 0.240 | 0.422 |
| (0.237, 0.243) | (0.416, 0.428) |
We begin by looking at the extra problems classified in the “Known” category, which contains just under 43% of the data. As the assessment believes students know how to solve these topics, the higher the correct answer rate is, the more accurate the assessment is. Here, we can see the correct answer rate to these topics is 0.834. Given that the ALEKS topics typically require open-ended responses, rather than being multiple choice, we expect a fair amount of “careless errors”—or, “slips”—even when students know how to solve the given topic. As such, we believe this correct answer rate is reasonable, as it is comparable to that of the existing ALEKS placement assessment for college students [4]. Next, we look at the extra problems in the “Unknown” category. In contrast to the previous category, for “Unknown” topics we want to see a low correct answer rate, as the assessment believes these are topics the students do not know. In this case, the low correct answer rate of 0.084 is comparable to, or even slightly better than, the ALEKS college placement assessment [4].


Finally, the extra problems in the “Uncertain” category are topics the assessment is unsure if students know or do not know. In this case—again accounting for careless errors—a correct rate of 0.422 is reasonable, as it indicates we have a roughly balanced mix of topics that students know and do not know, which is desired for this category. If, for example, the correct answer rate was very high, this would indicate that the assessment is wrongly classifying many topics as “Uncertain” that should instead be in the “Known” category. Conversely, if the correct answer rate was very low, the assessment would be incorrectly classifying many topics as “Uncertain” that should instead be in the “Unknown” category.
5. ANALYZING STUDENT OUTCOMES
When the placement assessment recommends a course to a student, the goal for that student is to successfully learn and make progress in the course—at the same time, the course must be appropriately challenging for the student, neither too easy nor too hard. As such, in this section we investigate the relationship between the placement recommendations and the performance of the students in their courses. Recall that, after taking the placement assessment, a student begins their work in an ALEKS course by taking the initial assessment. Based on the knowledge state returned by the initial assessment, we define the student’s initial score to be the proportion of topics from the course that are classified as being in the student’s knowledge state. As currently implemented in the ALEKS system, the information from the placement assessment is not used by the subsequent initial assessment taken by the student. Thus, for the purposes of this study, we treat these as independent evaluations of the same student. While this is suboptimal from the user’s perspective, as it requires they take multiple assessments,2 the upside is that this implementation allows us to make a cleaner analysis of the relationship between the placement recommendations and the subsequent performance of the student, as their starting knowledge state in the course is not based on the results of the placement assessment.
We begin by finding all students who took a placement assessment and, after this assessment, did some work in the system—this work could either be in the same course the student started in, or in the course recommended by the placement assessment. Additionally, we restrict ourselves to students who took the placement assessment from August through October of 2022, so that we can consider data from the full academic year, and we only look at courses that contain at least 100 topics, ensuring there is a reasonable amount of material for students to learn.3 This leaves us with a total of 22,859 students from 2,259 different classes.
A complicating factor with this analysis is that not all instructors follow the placement recommendations. In fact, when the recommended course differs from the student’s starting course, the majority of the time the student actually stays in the same course. This is somewhat understandable, as moving students to the recommended courses would require the instructor to manage multiple courses, possibly increasing their workload. Thus, to separate these different behaviors, we first restrict ourselves to classes that have at least one student with a recommendation different from the starting course. Then, we split these classes further based on whether or not any of these students were moved to a different course. Specifically, we now have the following two groups of classes.
- Stay: at least one student in the class was recommended a different course, but no students were moved (i.e., all the students stayed in their starting course)
- Follow: at least one student in the class was both recommended a different course and moved to the recommended course
| “Stay” classes | “Follow” classes
| |||||||||
| Recommendation | 0 | 1 | 2 | 3 | 4 | 0 | 1 | 2 | 3 | 4 |
| N | 3700 | 12031 | 2818 | 805 | 62 | 518 | 1227 | 172 | 30 | 1 |
| Placement score | 0.09 | 0.39 | 0.70 | 0.78 | 0.85 | 0.10 | 0.37 | 0.67 | 0.83 | 0.99 |
| Initial score | 0.07 | 0.22 | 0.42 | 0.55 | 0.73 | 0.18 | 0.21 | 0.34 | 0.26 | 0.44 |
| Final score | 0.21 | 0.42 | 0.69 | 0.81 | 0.90 | 0.47 | 0.47 | 0.66 | 0.53 | 0.46 |
| Topics learned | 63.1 | 97.0 | 126.7 | 120.6 | 74.2 | 54.8 | 112.9 | 147.3 | 133.6 | 12.0 |
| Hours worked | 9.3 | 11.7 | 14.9 | 14.9 | 8.7 | 8.6 | 13.5 | 17.0 | 16.7 | 1.8 |


While it is unfortunate that many classes are not following the placement recommendations, an unintended benefit is that this affords us an opportunity to directly compare students with very different course recommendations. That is, for the classes that do not move students to the recommended course(s)—i.e., those classes in the “Stay” category—we can compare the performance of students in the same course, even if their recommendations are very different, removing the complication of comparing students across different ALEKS courses.4 To that end, there are 19,416 students in classes from the “Stay” category. Motivated by the standardized testing field—where it is common practice to evaluate a test by looking at the linear relationship between the test and another measure of academic performance [14]—in Figure 2a we show a heat map comparing the placement scores for these students with their initial scores, with the resulting Pearson correlation coefficient being 0.75. (Recall that, as currently implemented in the ALEKS system, the initial assessment is independent of the placement assessment, as it does not use any information obtained by the placement assessment.) Note that the placement scores tend to be higher than the corresponding initial scores. This is expected, as the placement assessment has a larger proportion of low-level, prerequisite material in comparison to the normal ALEKS products.
Importantly, we also want to evaluate the course outcomes for these same students. As ALEKS courses do not have specific passing or grading criteria associated with them, we instead use the knowledge states of the students from May 2023, near the end of the 2022-23 academic year, to compute their final scores; we define the final score to be the ratio of the number of topics in the knowledge state, divided by the number of topics in the course. The results are in Figure 2b, where we show a heat map of final scores versus placement scores, giving a Pearson correlation coefficient of 0.57. As the ultimate goal of the placement assessment is to recommend courses that students can successfully learn in, this comparison of placement scores and final scores is important, and we return to this result in the discussion.
We next consider the students in the “Follow” classes. For these classes, we want to see how students perform in their recommended courses. However, while these classes each have at least one student who is moved to their recommended course, a relatively small number of students from these classes—about 13%—do not move to their recommended course. So, for the purposes of this analysis, we remove these students, leaving us with a total of 1,948 students. To get a sense of the differences in outcomes with this group, in Table 3 we display various statistics for the “Stay” and “Follow” groups, where we have also further divided the groups based on the placement recommendation. (Note that this is not a controlled comparison, as the “Stay” and “Follow” groups are determined by the actions of the instructors and, hence, are subject to a selection bias.) Additionally, to visualize the differences in these distributions, Figure 4 displays several violin plots of the initial and final score distributions, conditional on the placement recommendations. A violin plot combines the summary information of a box plot with a kernel density estimate of the probability density function of the data, giving a more complete view of the distribution of the data [12]. Overall, we can see that the performance of the “Stay” students is more-or-less increasing with the placement recommendation—this is consistent with the results in Figure 3, where we saw positive correlations between the placement score and both the initial and final scores.
In comparison, the performance of the “Follow” students is more consistent across the different placement recommendations, and this could be an indication that these students are working in courses more appropriate to their starting knowledge. For example, students with placement recommendations of 3 in the “Stay” group seem to encounter ceiling effects, as we can see in Figure 3b that the bulk of the final score distribution for these students is near the maximum value of 1. Contrast this with the results in Figure 3d for the “Follow” group, where students with a recommendation of 3 do not seem to encounter this issue. At the same time, from Table 3 we can see that the “Follow” students successfully learn many topics—specifically, students with recommendations of 1, 2, or 3 all learn more than 100 topics, on average, and students with a recommendation of 0, while not learning quite as much, still tend to make good progress in their courses.
6. DISCUSSION
In the previous section, we obtained a correlation of 0.57 between the final scores of the students and their placement scores. As we are unaware of other studies evaluating a placement assessment for an adaptive learning product, for comparison we instead look at analyses of the relationship between standardized test scores and student performance. With the caveat that these studies of standardized tests are performed under slightly different conditions, as the variables being compared are not coming from within the same system, we can still look at these works to, hopefully, give some context to the results in our current study. To start, the authors in [2] found a correlation of 0.56 between performance on a standardized test and high school GPA in either ninth or tenth grade. Next, [21] compared scores from the mathematics portion of a standardized test with grades in a math class, with resulting correlations of 0.38 and 0.45 for two different groups of high schools.
As noted in [21], there is a lack of data for comparisons such as these at the secondary level. Thus, we next turn to higher education, where the authors of [14] synthesized the results from studies looking at the relationship between various standardized tests—such as the Graduate Recommendation Exam (GRE), Law School Admissions Test (LSAT), Graduate Management Admissions Test (GMAT), and Medical College Admissions Test (MCAT)—and first-year GPA in graduate school, with the resulting correlations falling between 0.4 and 0.6. Then, studies evaluating the SAT found correlations between SAT score and first-year GPA in college ranging from 0.51 to 0.54 [16, 23, 24]. Lastly, another study on the SAT found a correlation of 0.52 between SAT scores and GPA in first-year mathematics courses [20]. Based on all of this—and while keeping the aforementioned caveats in mind—the correlation of 0.57 between the ALEKS placement scores and final scores is seemingly comparable to the results in the literature. Additionally, due to the lack of previous studies evaluating placement assessments for an adaptive learning product, we believe these results and comparisons for the ALEKS assessment can be useful to other researchers working on similar placement assessments.
We next discuss potential ways of changing and improving the placement assessment. Recall that, with the current implementation of the placement assessment, a student is required to take a separate, full-length initial assessment once they begin working in their ALEKS course. Ideally, the results of the placement assessment could instead be used to make this initial assessment shorter and more efficient, thereby improving the student experience and allowing them to begin their learning faster. Next, we saw that the majority of users do not follow the placement recommendations and, instead, keep their students in the starting courses. While one plausible reason for this behavior is that moving students around creates extra work for K–12 teachers who are likely overloaded with other responsibilities, it is possible instructors are still making use of the placement information without actively moving students—for example, perhaps the recommendations allow them to identify students who could benefit from extra instruction. Along these lines, the placement assessment could eventually be modified to function as a more general “benchmark” assessment, one that gives teachers information on whether or not students are performing at the appropriate grade level. Our current work is focused on improving the ALEKS placement assessment in these areas.
7. REFERENCES
- A. D. Ayele, Z. Carson, and C. Tameze. An efficacy study of ALEKS-based placement in entry-level college math courses. PRIMUS, 33(4):414–430, 2023.
- A. Casillas, S. Robbins, J. Allen, Y.-L. Kuo, M. A. Hanson, and C. Schmeiser. Predicting early academic failure in high school from prior academic achievement, psychosocial characteristics, and behavior. Journal of Educational Psychology, 104(2):407–420, 2012.
- E. Cosyn, C. Doble, J.-C. Falmagne, A. Lenoble, N. Thiéry, and H. Uzun. Assessing mathematical knowledge in a learning space. In J.-C. Falmagne, D. Albert, C. Doble, D. Eppstein, and X. Hu, editors, Knowledge Spaces: Applications in Education, pages 27–50. Springer Berlin Heidelberg, Berlin, Heidelberg, 2013.
- E. Cosyn, H. Uzun, C. Doble, and J. Matayoshi. A practical perspective on knowledge space theory: ALEKS and its data. Journal of Mathematical Psychology, 101:102512, 2021.
- D. de Chiusole, L. Stefanutti, P. Anselmi, and E. Robusto. Stat-Knowlab. Assessment and learning of statistics with competence-based knowledge space theory. International Journal of Artificial Intelligence in Education, 30(4):668–700, 2020.
- M. C. Desmarais and M. Gagnon. Bayesian student models based on item to item knowledge structures. In European Conference on Technology Enhanced Learning, pages 111–124. Springer, 2006.
- C. Doble, J. Matayoshi, E. Cosyn, H. Uzun, and A. Karami. A data-based simulation study of reliability for an adaptive assessment based on knowledge space theory. International Journal of Artificial Intelligence in Education, 29(2):258–282, 2019.
- J.-P. Doignon and J.-C. Falmagne. Spaces for the assessment of knowledge. International Journal of Man-Machine Studies, 23:175–196, 1985.
- J.-C. Falmagne and J.-P. Doignon. Learning Spaces. Springer-Verlag, Heidelberg, 2011.
- T. Fawcett. An introduction to ROC analysis. Pattern Recognition Letters, 27(8):861–874, 2006.
- C. A. Field and A. H. Welsh. Bootstrapping clustered data. Journal of the Royal Statistical Society: Series B (Statistical Methodology), 69(3):369–390, 2007.
- J. L. Hintze and R. D. Nelson. Violin plots: a box plot-density trace synergism. The American Statistician, 52(2):181–184, 1998.
- C. Hockemeyer, T. Held, and D. Albert. RATH-A relational adaptive tutoring hypertext WWW-environment based on knowledge space theory. In Proceedings of 4th International Conferenceon Computer Aided Learning and Instruction in Science and Engineering, pages 417–423. Citeseer, 1997.
- N. R. Kuncel and S. A. Hezlett. Standardized tests predict graduate students’ success. Science, 315(5815):1080–1081, 2007.
- D. Lynch and C. P. Howlin. Real world usage of an adaptive testing algorithm to uncover latent knowledge. In Proceedings of the 7th International Conference of Education, Research and Innovation, pages 504–511, 2014.
- J. P. Marini, P. A. Westrick, and E. J. Shaw. Examining the stability of SAT predictive relationships across cohorts and over time. College Board, 2021.
- J. Matayoshi, E. Cosyn, and H. Uzun. Evaluating the impact of research-based updates to an adaptive learning system. In International Conference on Artificial Intelligence in Education, pages 451–456. Springer, 2021.
- J. Matayoshi, H. Uzun, and E. Cosyn. Studying retrieval practice in an intelligent tutoring system. In Proceedings of the Seventh ACM Conference on Learning @ Scale, pages 51–62, 2020.
- J. Matayoshi, H. Uzun, and E. Cosyn. Using a randomized experiment to compare the performance of two adaptive assessment engines. In Educational Data Mining, pages 821–827, 2022.
- K. D. Mattern, B. F. Patterson, and J. L. Kobrin. The validity of SAT® scores in predicting first-year mathematics and english grades. College Board, 2012.
- M. Pollio and C. Hochbein. The association between standards-based grading and standardized test scores as an element of a high school reform model. Teachers College Record, 117(11):1–28, 2015.
- A. Reddy and M. Harper. Mathematics placement at the University of Illinois. PRIMUS, 23(8):683–702, 2013.
- P. R. Sackett, N. R. Kuncel, J. J. Arneson, S. R. Cooper, and S. D. Waters. Does socioeconomic status explain the relationship between admissions tests and post-secondary academic performance? Psychological Bulletin, 135(1):1–22, 2009.
- P. A. Westrick, J. P. Marini, L. Young, H. Ng, D. Shmueli, and E. J. Shaw. Validity of the SAT for predicting first-year grades and retention to the second year. College Board, 2019.
1Specifically, we randomly sample classes with replacement until we have a total of 8,442 classes, the same as in our original data set. Next, we combine the data from this new sample of classes and compute our statistics. (Note that, since we are sampling classes with replacement, in all likelihood this new sample contains duplicate classes and, thus, duplicate data points.) Repeating this procedure until we have 100,000 different samples, we then take the 2.5 and 97.5 percentiles for each statistic to get our confidence intervals.
2This situation is being addressed in ongoing work to improve the placement assessment.
3As instructors are able to customize the number of topics in the course, a small proportion of courses fall below this threshold of 100 topics.
4This general issue is known as range restriction in the testing and assessment literature [23].