ABSTRACT
Identifying students-at-risk of failing a course or dropping out of a program is a significant problem in the fields of Learning Analytics and Educational Data Mining. Improving their early detection is important for enabling higher education institutions to design and provide resources to better support students. In addition, learning is a dynamic process, where social interactions are crucial as learning is not completely an individual or static achievement. The identification of students-at-risk of failing or dropping out a course is generally an imbalanced problem, as grade distribution is affected by several elements, and failing students are not always fairly represented. This research focuses on exploring the extent to which network structure in online discussion forum interactions can inform student-at-risk predictions through node oversampling.
Keywords
1. INTRODUCTION
The timely identification of SaR of failure or withdrawal from a course or programme is a significant challenge within the fields of Learning Analytics (LA) and Educational Data Mining (EDM) [1, 2]. Effective early intervention strategies and appropriate interventions can be designed and implemented by educational institutions and instructors if SaR are identified promptly. There have been a variety of approaches and methods developed for the timely identification of SaR as educational researchers have investigated and identified a wide range of factors associated with and influencing academic failure [3].
The categorisation of students based on their individual strategies, activity patterns, and personality traits has been extensively researched in education to enhance learning support interventions (e.g. [4, 5]). However, traditional approaches focusing on individual perspectives do not fully capture the complex, socially-regulated nature of learning, which involves interactions and feedback from peers and instructors [6, 7]. Additionally, learning is a dynamic process influenced by time, making it crucial to consider temporal aspects for effective detection of SaR [8]. Despite the importance of both social and temporal dimensions, research integrating these factors remains limited [9]. Challenges in gathering and analysing such data, alongside the inherently imbalanced nature of SaR identification and the various factors influencing grade distribution, lead to inaccuracies and potential biases in predictive models used for identifying at-risk students and their learning strategies [10].
2. BACKGROUND
2.1 Temporal networks and centrality measures
Temporal networks expand upon the principles of static network analysis by incorporating data on the temporality of interactions between nodes [11]. There are several methodologies for constructing temporal networks, based on communication events that are time-dependent, including binary static networks, and multilayer networks [11]. The term "centrality" in the context of networks refers to a numerical indicator used to describe the characteristics of relationships between individuals within a network. These characteristics include position, importance, and influence [12]. The use of centrality measures in student networks has been valuable in investigating how a student’s position in a network affects educational outcomes [13].
2.2 Oversampling methods
A multitude of factors contribute to the distribution of numerical grades within a course. As is the case with other machine learning tasks, the presence of imbalanced target values may impact the accuracy of predictions designed to identify instances of SaR of failure. A common approach to address class imbalance involves the random oversampling of minority classes to prevent biases [14]. Despite the extensive investigation of univariate time series oversampling techniques to preserve time dependence, multivariate time series data present additional complexities due to the covariances observed between time series [15]. Furthermore, oversampling time series based on centrality measures must also consider the connections between the original and the oversampled nodes, since centrality measures depend not only on node attributes, but also on the node’s neighbours.
3. RESEARCH QUESTIONS
This study addresses the issue of the imbalanced early identification of SaR of failing, with a social and temporal perspective. The purpose of our research is to investigate the extent to which concepts of social and temporal analysis are suitable for the identification task, based on data from online discussion forums in undergraduate courses. To this end, two research questions (RQs) guide our work; (1) To what extent is it possible to inform the early identification of SaR of failing based on interaction data from online discussion forums?, and (2) How does the classification performance compare between traditional oversampling methods and oversampling methods that take the structure of the interactions into account?
4. PROPOSED METHODOLOGY AND RESEARCH PROGRESS
In light of the fact that students’ engagement throughout the course has a greater influence on their learning than their activity in a specific week, and that students can be categorised into groups based on their final grade, the methodological approach proposed is multivariate time series classification. This approach has been effective in detecting early dropout. The relationship between activity in an online discussion forum and academic performance is characterised by temporal networks’ centrality measures. Two methods are implemented to address the imbalance in the grade distribution. Finally, the prediction performance of time series classification models is compared.
4.1 Data and network construction
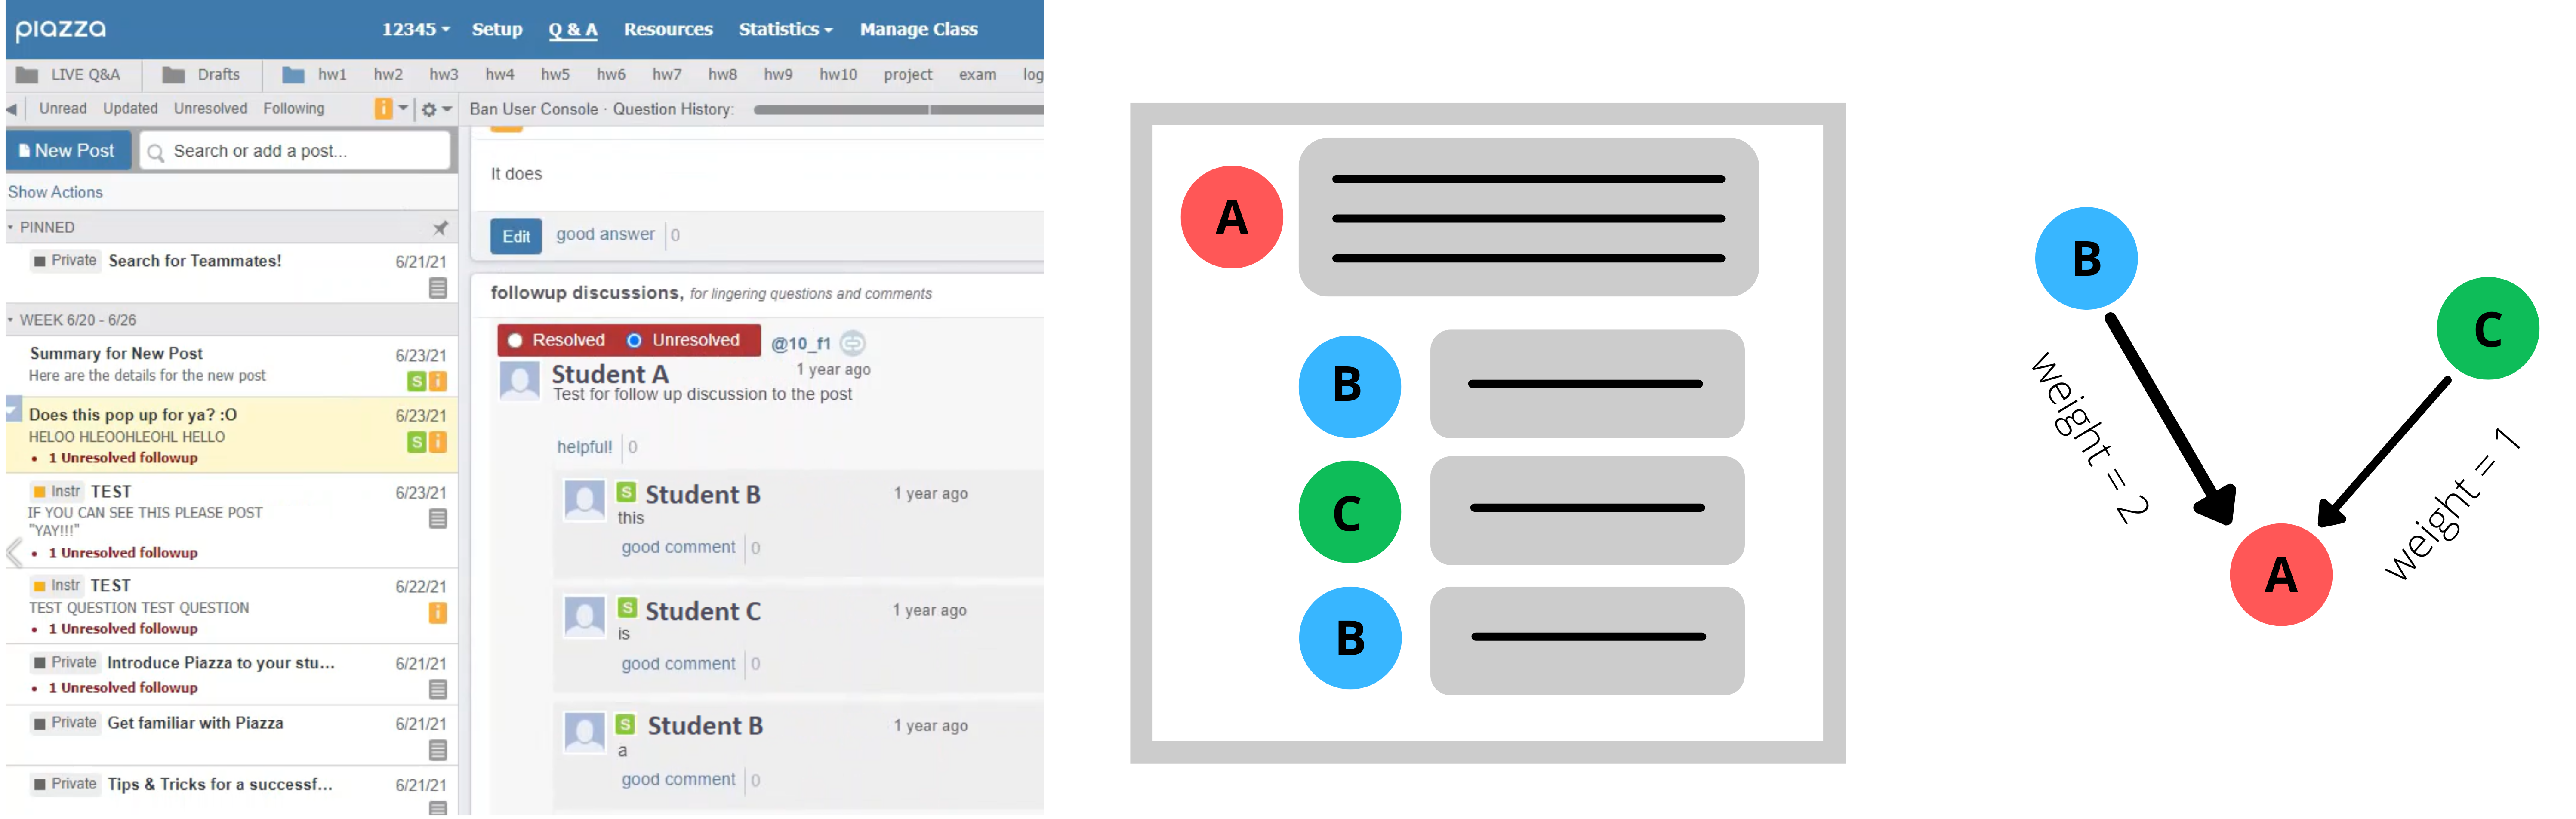
The data from an online 12-week undergraduate course was gathered from the discussion forum. Figure 1 illustrates an example of how the networks were formed. All students enrolled in the course had access to the discussion forum, which was adopted to facilitate communication between students and instructors. While there was a strong emphasis on active participation, this was not a mandatory requirement. Consequently, student activity on the forum varied significantly from week to week, with posts only appearing when required or desired. A total of 323 first- and second-year students and 10 instructors participated in the discussion forum. Students were categorised according to their academic performance, with grades A, B, and C corresponding to a score higher than 87.5, 67.5, and 47.5, respectively, while grades below 47.5 were classified as failing and assigned to grade category D.
A multilayer temporal network was built to account for the asynchronous dynamics and structured syllabus of the course. Each network layer corresponds to communication events among forum participants, represented over twelve one-week intervals.
4.2 Oversampling and Time Series Classification
| Network feature representation | Parameters |
|---|---|
| DeepWalk | walk_number=10, walk_length=80, dimensions=356, workers=4, window_size=10 |
| Node2Vec Explore | walk_number=10, walk_length=80, p=2, q=0.5, dimensions=356, window_size=10 |
| Node2Vec Stay Locally | walk_number=10, walk_length=80, p=0.5, q=2, dimensions=356, window_size=10 |
In our research, we utilised sequences of centrality measures from student nodes as input for time series classification algorithms. To address the issue of class imbalance, we implemented two sampling techniques: random minority class oversampling and synthetic minority oversampling, specifically GraphSMOTE [16]. The first approach constructs multivariate time series of centrality measures from the original temporal network. This is followed by random oversampling with replacement of the minority classes to balance the training data before implementing the time series classifier. Conversely, the second method creates synthetic nodes for minority classes within an embedding space (an encoder) and models their connections through an edge generator. Further, the information is used to train a graph neural network classifier (decoder). DeepWalk and Node2Vec were used to produce feature representations for the networks (Table 1), and implemented synthetic node generation and link prediction individually for each layer. Following parameter optimisation (Table 2), centrality measures were calculated using the augmented adjacency matrix formed in the latent space.
The multivariate time series classification models were implemented and assessed by concatenating centrality measures across the 12 layers. We pre-trained Rocket and K-neighbours time series classifiers employing 10-fold cross-validation to determine the optimal parameters (Table 3). We evaluated the effectiveness of the model in differentiating between classes using the Area Under the Receiver Operator Curve (AUC) score [17]. The models were applied across five incremental time horizons, utilising four, six, eight, ten, and twelve weeks of data respectively. For each timeframe, three different node representations were considered (Table 1). Model implementations that utilised centrality sequences corresponding to GraphSMOTE across the five timeframes obtained higher AUC scores compared to those achieved through random oversampling of minority classes. Table 4 displays the classification models that achieved the highest training AUC scores, along with their performance outcomes on both the training and test datasets. It’s important to note that although GraphSMOTE yielded the highest scores across all timeframes, the models still show considerable gaps between training and testing performances. This indicates that while the use of GraphSMOTE with Node2Vec (Explore) and DeepWalk could enhance performance, overall effectiveness remains suboptimal, potentially influenced by unseen biases in the test set.
| Parameter | Grid Search Space |
|---|---|
| model | {’sage’, ’GAT’} |
| nhid (hidden layers) | {64,128,256} |
| lr | {0.001, 0.01} |
| dropout | {0.2, 0.5, 0.8} |
| Model | Grid Search Space |
|---|---|
| Rocket | num_kernels: {1000, 2000, 3000} |
| K-neighbours TS | distance: {‘dtw’, ‘euclidean’, ‘squared’} |
| Weeks | Net. Representation | Model | AUC (training) | AUC (test) |
|---|---|---|---|---|
| 1 to 4 | Node2Vec Explore | Rocket | 0.5695 | 0.5360 |
| 1 to 6 | Node2Vec Explore | K-neighbours | 0.5716 | 0.4739 |
| 1 to 8 | Node2Vec Explore | K-neighbours | 0.5873 | 0.5012 |
| 1 to 10 | DeepWalk | K-neighbours | 0.5873 | 0.4194 |
| 1 to 12 | DeepWalk | K-neighbours | 0.6100 | 0.4106 |
5. CONCLUSIONS AND ADVICE SOUGHT
The timely identification of SaR is both crucial and challenging, involving the identification of key data sources and selection of meaningful features. Our study assesses the usefulness of pure interaction data from online forums, where students engage by posting and responding to questions, without relying on their background information, course assessments, or content of the posts. We apply multivariate time series classification models and network science concepts to identify students across various grade categories and time points, considering the imbalanced nature of grade distributions. Initial findings indicate that this approach could inform the identification of SaR and meaningful centrality measures. However, data complexity, sparsity, and biases may limit practical application.
The preliminary findings carry several implications. For the first RQ, results from models using random oversampling suggest that while such data has been useful in other contexts for identifying SaR [18, 19], it does not directly translate to settings with different course structures and organic student participation in forums. Concerning the second RQ, our analysis indicates that oversampling with GraphSMOTE consistently yielded higher average AUC scores during training. However, the top-performing models still fell below the 0.5 mark (random baseline) on the test set (Table 4).
Both social learning [20] and self-regulation theories [21] highlight the significance of social and temporal aspects, yet studies integrating these elements are scarce [9]. We consider the approach proposed valuable, as it considers the influence of social and temporal factors on learning. We analyse interaction data from online forums where student contributions are organic, which is common in higher education courses. Addressing the gap between identifying SaR and preventing their failure is crucial. Identifying SaR is a key prevention step, calling for the implementation and evaluation of such models in real-world contexts.
This study has notable limitations and opens avenues for further research. A primary limitation is the sparsity of our dataset across the course, reflecting the structure of many undergraduate programs and affecting model performance due to class imbalance and low activity. Addressing how to make the most of these data is crucial for advancing data-driven methods in higher education. Although our method improved classification performance over traditional approaches using random oversampling, the overall low performance highlights that interaction data alone may not sufficiently identify SaR, suggesting a need for better model tuning and selection. Our approach could potentially enhance more complex models that integrate data from various educational platforms. Future research will focus on testing our methodology in different educational contexts and combining it with additional data sources to determine how forum interactions can improve classification models.
We are seeking guidance to address the limitations identified in our study, enhance the outcomes of our current models, and broaden the impact of our findings. Specifically, we seek for methodological recommendations on (1) node oversampling methods that also take into account node features and homophily, (2) parameter and model selection criteria across layers, and (3) additional classification methods for multivariate time sequences. Moreover, we are open to any suggestions regarding other aspects of our study, including but not limited to data preprocessing, feature engineering, and experimental design. Our goal is to refine our approach in a way that not only addresses the current shortcomings but also sets a foundation for more impactful future research.
6. ACKNOWLEDGMENTS
The first author acknowledges the support of the Icelandic Research Fund (IRF) [grant number 239408-051].
7. REFERENCES
- O. Viberg, M. Hatakka, O. Bälter, and A. Mavroudi, “The current landscape of learning analytics in higher education,” Computers in Human Behavior, vol. 89, p. 98–110, 2018.
- C. Romero and S. Ventura, “Educational data mining and learning analytics: An updated survey,” WIREs Data Mining and Knowledge Discovery, vol. 10, p. e1355, May 2020.
- C. Brooks and C. Thompson, Predictive Modelling in Teaching and Learning, p. 29–37. Vancouver, Canada: SoLAR, 2 ed., 2022.
- J. Jovanović, S. Dawson, S. Joksimović, and G. Siemens, “Supporting actionable intelligence: reframing the analysis of observed study strategies,” in Proceedings of the Tenth International Conference on Learning Analytics & Knowledge, p. 161–170, 2020.
- W. Matcha, D. Gašević, N. A. Uzir, J. Jovanović, and A. Pardo, “Analytics of learning strategies: Associations with academic performance and feedback,” in Proceedings of the 9th International Conference on Learning Analytics & Knowledge, p. 461–470, 2019.
- R. Ferguson and S. B. Shum, “Social learning analytics,” in Proceedings of the 2nd International Conference on Learning Analytics and Knowledge - LAK ’12, pp. 23–33, ACM Press, 2012.
- S. Järvelä, P. A. Kirschner, E. Panadero, J. Malmberg, C. Phielix, J. Jaspers, M. Koivuniemi, and H. Jär-venoja, “Enhancing socially shared regulation in collaborative learning groups: Designing for cscl regulation tools,” Educational Technology Research and Development, vol. 63, no. 1, p. 125–142, 2015.
- N. Mercer, “The seeds of time: Why classroom dialogue needs a temporal analysis,” The journal of the learning sciences, vol. 17, no. 1, p. 33–59, 2008.
- M. Saqr and S. López-Pernas, The Why, the What and the How to Model a Dynamic Relational Learning Process with Temporal Networks. Nov 2022.
- O. H. Lu, A. Y. Huang, and S. J. Yang, “Impact of teachers’ grading policy on the identification of at-risk students in learning analytics,” Computers & Education, vol. 163, p. 104109, Apr 2021.
- P. Holme and J. Saramäki, A Map of Approaches to Temporal Networks, p. 1–24. Computational Social Sciences, Cham: Springer International Publishing, 2023.
- N. E. Friedkin, “Theoretical foundations for centrality measures,” American Journal of Sociology, vol. 96, p. 1478–1504, May 1991.
- M. Saqr, O. Poquet, and S. López-Pernas, “Networks in education: A travelogue through five decades,” IEEE Access, vol. 10, p. 32361–32380, 2022.
- M. R. K. Dhurjad and M. S. S. Banait, “Imbalanced time series data classification using over-sampling technique,” pp. 75–80, 2015.
- T. Zhu, C. Luo, Z. Zhang, J. Li, S. Ren, and Y. Zeng, “Minority oversampling for imbalanced time series classification,” Knowledge-Based Systems, vol. 247, p. 108764, Jul 2022.
- T. Zhao, X. Zhang, and S. Wang, “Graphsmote: Imbalanced node classification on graphs with graph neural networks,” in Proceedings of the 14th ACM International Conference on Web Search and Data Mining, (Virtual Event Israel), p. 833–841, ACM, Mar 2021.
- A. P. Bradley, “The use of the area under the roc curve in the evaluation of machine learning algorithms,” Pattern Recognition, vol. 30, p. 1145–1159, Jul 1997.
- N. Gitinabard, F. Khoshnevisan, C. Lynch, and E. Y. Wang, “Your actions or your associates? predicting certification and dropout in moocs with behavioral and social features,” in Proceedings of the 11th International Conference on Educational Data Mining, EDM 2018, Buffalo, NY, USA, July 15-18, 2018 (K. E. Boyer and M. Yudelson, eds.), pp. 404–410, International Educational Data Mining Society (IEDMS), 2018.
- J. Zhang, M. Gao, and J. Zhang, “The learning behaviours of dropouts in moocs: A collective attention network perspective,” Computers & Education, vol. 167, p. 104189, Jul 2021.
- A. Bandura, “Social learning through imitation.,” 1962.
- P. H. Winne, Learning Analytics for Self-Regulated Learning, p. 78–85. SOLAR, 2 ed., 2022.