ABSTRACT
In studies that generate course recommendations based on similarity, the typical enrollment data used for model training consists only of one record per student-course pair. In this study, we explore and quantify the additional signal present in course transaction data, which includes a more granular account of student administrative interactions with a course, such as wait-listing, enrolling, and dropping. We explore whether the additional non-enrollment records and the transaction data’s chronological order play a role in providing more signal. We train skip-gram, FastText, and RoBERTa models on transaction data from five years of course taking histories. We find that the models gain moderate improvements from the extra non-enrollment records, while the chronological order of the transaction data improves the performance of RoBERTa only. The generated embeddings can also predict course features (i.e. the department, its usefulness in satisfying requirements, and whether the course is STEM) with high accuracy. Lastly, we discuss future work on the use of transaction data to predict student characteristics and train course recommender models for degree requirements.
Keywords
1. INTRODUCTION
Prior work has shown that standard enrollment data can be used to infer content similarities between courses within [11] and across institutions [10]. One hypothesis for how these models capture semantics, is that they encode students’ aggregate perceptions of a courses as communicated by the contexts in which they are selected by a student (e.g., in which semester and along with which other courses) [13]. Transaction data includes additional student actions and, therefore, more potentially inferable student perceptions of course semantic information and course similarity.
Two important features of transaction data are: 1) it contains more granular information on top of student enrollment actions, such as waitlisting and dropping, including students’ reasons for doing so; 2) the order of the student actions is available as these granular actions are timestamped instead of just term-stamped, as is the case with conventional enrollment data that has inhibited chronological sorting within semester in past work. We hypothesize that both features might provide more granular semantic information and similarity signal, and thus improve similarity-based recommendations. In this study, we first present summary statistics of transaction data and features of courses that will be used in subsequent analyses. Next, we present the methodology and results related to the following research questions:
- RQ1: Does the extra non-enrollment transactions (waitlisting and dropping) provide additional course similarity signal on top of enrollment transactions?
- RQ2: Does the chronological order of the transaction data provide more course similarity signal than random (within-semester) order?
We quantify the amount of signal gained by these two features by comparing the performance of skip-gram, FastText, and RoBERTa models with varying additional non-enrollment records and orders. We further investigate how well the model representations from transaction and enrollment-only data represent other semantic features of courses by predicting features of the courses, such as department, STEM /non-STEM designation, student major diversity, utility in fulfilling requirements, and course popularity.
We find that the extra non-enrollment records do provide more similarity signal. Most models trained with full transaction data perform better than the baseline models that are only trained on enrollment actions. We also find that the chronological order of the transaction data does not improve the course similarity signal for skip-gram and FastText, but does improve the signal for RoBERTa. Lastly, we find that the best embedding model (FastText trained on transaction data) is able to predict course features better than the best embedding model trained only on enrollment actions.
2. RELATED WORK
Big Data is one of the driving forces behind educational recommender systems and learning analytics as there is an increasing volume, variety, and integrity of data obtained from various educational platforms [2]. Furthermore, as the use of MOOCs (massive open online courses) and other digital platforms has increased, student data (ranging from student enrollment data to behavioral data like clickstream) has become more granular. Representations of students, lessons, and assessments from historical lesson student-content interactions in an online tutoring system are used to create personalized lesson sequence recommendations [14]. Students’ daily activities, including potentially sensitive, private data, could be used to predict their success in online courses using supervised machine learning systems [3].
In traditional higher education institutions, there have been efforts to conduct predictive modeling and create course recommender systems using a variety of novel institutional data. These data include enrollment histories, major declarations, and catalog descriptions. Large-scale syllabus data was introduced as a novel source of information on tasks of predicting course prerequisites, credit equivalencies, student next semester enrollments, and student course grades [6]. It was found that course descriptions resulted in the highest signal representation accuracy in predicting course similarity, the prediction task we are also concerned with. Student enrollment data and course catalog data were also used to create course recommendations given students’ academic interests and backgrounds at a liberal arts program [9]. The course recommendations were based on topic modeling on course catalog descriptions, and were found to be relevant for a wide range of academic interests. A course recommendation system based on score predictions with cross-user-domain collaborative filtering was developed using course-score records based on different student majors [4]. In particular, the algorithm was designed to effectively predict the score of the course for each student by using the course-score distribution of the most similar senior students.
More recently, it has been shown that incorporating data from multiple heterogeneous sources improves course recommendations [5, 16]. Specifically, sources such as course, student, and career information are integrated with ontology-based personalized course recommendation to help students gain comprehensive knowledge of courses based on their relevance. Course description data was integrated with job advertisement data to identify necessary job skills [17] with a hybrid course recommendation system to extract relevant skills and entities, and provide recommendations on multiple individualized levels of university courses, career paths with job listings, and industry-required with suitable online courses. Course description and job advertisement data were also used to build a heterogeneous graph approach for cross-domain recommendation for both students and professionals[19]. However, student enrollment data used in these previous studies only have contained courses that students enroll in each semester, as the type of granular and detailed student behavioral data are not always readily available in traditional formal higher education learning environments. Our study utilizes a new source of detailed, more granular course enrollment data for course similarity-based recommendation.
Nascent findings [18] on the application of FastText to course equivalency task, found that there is 97.95% improvement in model performance from skip-gram to FastText. Since course names are morphologically rich, usually with information such as the department, level of division, and whether it is cross-listed, we expect that transaction data would provide more course similarity signal. Additionally, transaction data contains non-enrollment tokens that we concatenate to the end of course names (i.e. English 100_W denotes a course that is waitlisted) to distinguish various actions. We take advantage of such additional tokens with subword representations from FastText and RoBERTa.
3. DATA
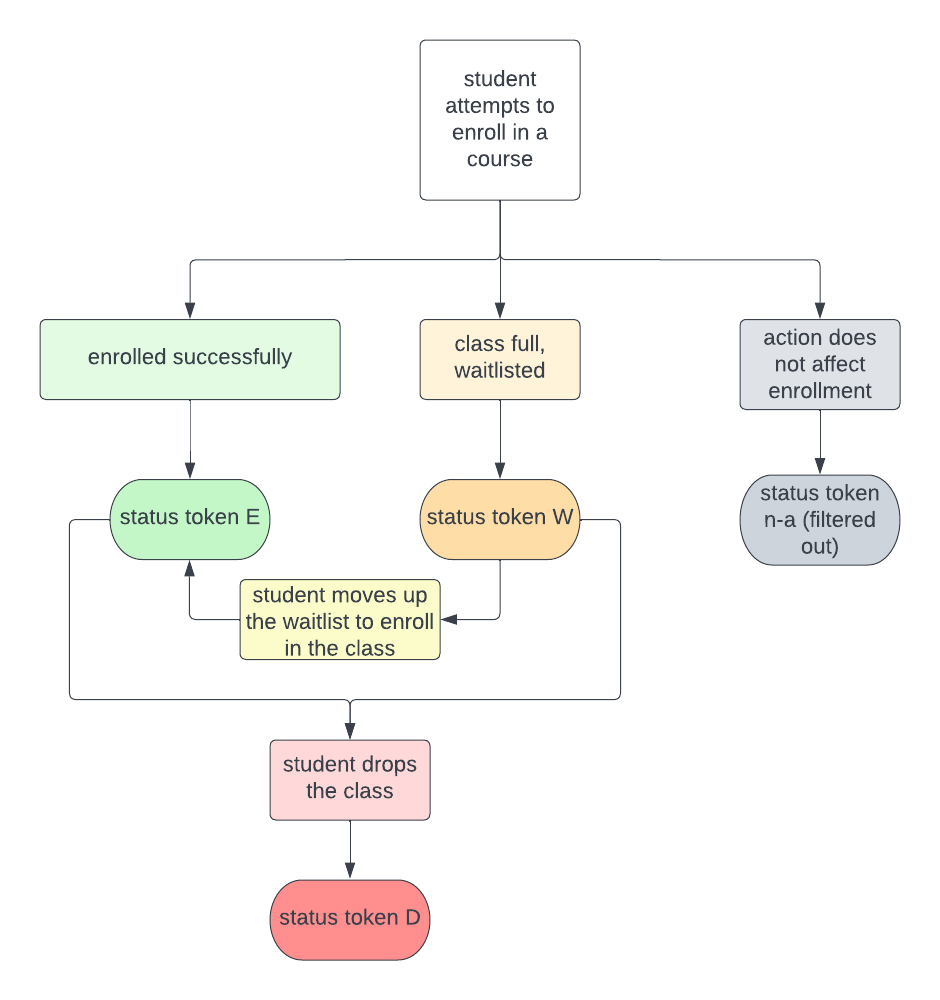
The transaction data was provided through official channels at UC Berkeley, a large public university in the US. It shows a history of students enrolling, dropping, and wait-listing into classes, with each row representing one of these actions with a specific timestamp It is set to be from 2016 Fall — 2022 Summer. Table 1 contains the size and number of unique courses of the original transaction data, and its various filtered versions. Table 2 shows an example of the transaction data where one student (xxxxxx123) enrolls in 110 Math and gets waitlisted in 150 Molecular & Cell Biology; while another student (xxxxxx456) attempts to drop 148 Sociology but is unsuccessful. Figure 1 shows how enrollment status token changes based on user actions. Each action would generate a row of records with the corresponding status token. For example, when a student attempts to enroll in a course, there are 3 scenarios: 1) enroll successfully and their action is recorded with the status token "E"; 2) waitlist in the class and their action is recorded with the status token "W"; or 3) their action does not affect their enrollment status and it is recorded with the status token "n-a" which we filtered out. At a later time, when the student moves up the waitlist and successfully enrolls in the class, another record with token "E" will be recorded. And any time when a student drops a course, status token "D" will be recorded.
| Data | size | unique courses |
|---|---|---|
| Transaction original | 11,136,719 | 16,686 |
Transaction filtered (student initiated, action affects status) | 9,141,091 | 9,251 |
Transaction filtered (student initiated, action affects status, outcome status = E) | 2,807,265 | 8,817 |
Transaction filtered (student initiated, action affects status, outcome status = E, D) | 4,335,464 | 9,025 |
Transaction filtered (student initiated, action affects status, outcome status = E, D, W) | 5,273,907 | 9,033 |
| Student id | Enrollment request timestamp | Semester | Course | Enrollment status outcome | Enrollment message |
|---|---|---|---|---|---|
| xxxxxx123 | 2021-10-11 15:22:15 | Fall 2021 | 150 Molecular & Cell Biology | W | You have been placed on the waitlist in position number 3. |
| xxxxxx123 | 2021-10-11 15:29:17 | Fall 2021 | 110 Math | E | Your enrollment request has been processed successfully. |
| xxxxxx456 | 2021-3-11 20:48:39 | Spring 2021 | 148 Sociology | NaN | You cannot drop this class. |
While the transaction data contains various features associated with student enrollment actions such as the source and reasons for the enrollment request, we focus on "enrollment status outcome". It contains token “D” (dropped), “E” (enrolled), “W” (wait-listed), or n-a (when the action does not affect enrollment), and the enrollment message contains the description accompanying the enrollment status outcome. The top 3 enrollment status messages corresponding to the four status tokens are listed below:
-
Token “D”
- A Grade of [LETTER] has been assigned for this Drop Request.
- Your enrollment request has been processed successfully.
- Warning - Enrollment status is Withdrawn.
-
Token “E”
- Your enrollment request has been processed successfully.
- You have already taken this class.
- Invalid Access to Override Class Links
-
Token “W”
- You have been placed on the waitlist of [CLASS] in position number [NUMBER].
- The Requirement Designation Option was set to ’YES’ by the enrollment process.
- Course previously taken and may be subject to institutional repeat policy.
-
Token “n-a”
- Unit Limit Exceeded For Appointment Period.
- You are unable to enroll in this class at this time.
- Class [CLASS] is full.
We then filtered the transaction data to only contain student-initiated actions and actions that affect enrollment status, filtering out the records with the enrollment status token "n-a" and removing 20% of the rows. Actions that are not student-initiated include those that are initiated by the administration (e.g., manual enrollment of a student), and those that are batch-processed (e.g., if a class is canceled, then everyone is dropped). Actions that affect enrollment status include dropping, enrolling, enrolling from waitlist, or dropping to waitlist. Actions that do not affect enrollment status include adding grade, changing grade, or changing waitlist position.
3.1 Analysis of Transaction Data
We conducted data analysis of the transaction data to explore the types of courses students get enrolled, waitlisted for, and dropped the most. The categories we investigate are: whether the course is STEM, its divisions, and its usefulness in satisfying degree requirements. We select the top 100 courses to analyze. As show in Table 3, the courses for all three actions include popular courses in Computer Science and Business Administration. The majority of waitlisted and dropped records contain STEM courses and lower division courses, while the majority of enrolled records contain non-STEM and upper division courses. Enrolled records contain the highest median number of course requirement lists that are satisfied, followed by dropped, and then waitlisted records. We further investigate these features in a later section to quantify the prediction power of course embeddings trained on the transaction data.
Median number of actions | Top 3 departments | Proportion of STEM/ non-STEM | Proportion of different divisions | Median course requirement lists satisfied |
|
|---|---|---|---|---|---|
Enrolled records | 2,408.5 | Computer Science, Business Admin- Undergrad, Statistics | 54% STEM, 56% non-STEM | 59% upper, 41% lower | 18 |
Waitlisted records | 6,188 | Computer Science, Mathematics, Chemistry | 66% STEM, 34% non-STEM | 58% lower, 42% upper | 12.5 |
Dropped records | 6,188 | Computer Science, Business Admin- Undergrad, Mathematics | 58% STEM, 42% non-STEM | 55% lower, 45% upper | 16 |
4. MODELS
We apply three embedding models to the transaction data. Two of the models, skip-gram and FastText, have been evaluated on a similar task of course equivalencies. The third model is a SentenceTransformer network architecture with a custom trained RoBERTa model as the word embedding model layer.
4.1 skip-gram Course2Vec
The Course2Vec model, like a Word2Vec model, learns course representations by treating an enrollment sequence as a sentence and each class in the sequence as a word [12, 11]. To distinguish between courses associated with different enrollment outcomes, the enrollment status outcome token is concatenated to the end of the course (e.g. "Math 10A_E") before passing the course sequence to the transaction model. A transaction sequence with the token concatenated is ["Molecular & Cell Biology 160_E","Molecular & Cell Biology 160_D", "Statistics 134_W"], in which a student enrolls in Molecular & Cell Biology 160, drops it, and is waitlisted in Statistics 134.
4.2 FastText Course2Vec
The department name, course affixes, and course number are typically included in course titles, which have a rich morphological structure. Prefixes like "C" in "History C140" indicate a course that is taught jointly by two or more departments, whereas suffixes like "A" or "B" in "Chemistry 1A" and "Chemistry 1B" indicate courses that should be taken sequentially. At UC Berkeley, lower-division courses, upper-division courses, and graduate-level courses are designated by course numbers below 100, 100-199, and 200 and above, respectively. So FastText [1], which represents words as a bag of character n-grams and is able to compute out-of-vocabulary words, is expected to take advantage of the extra enrollment status tokens of the transaction data.
4.3 Sentence Transformer with RoBERTa
RoBERTa [8] is a modification of the original BERT model that is trained on a much larger dataset and removes the Next Sentence Prediction objective. We first trained a byte-level Byte-pair encoding tokenizer rather than a WordPiece tokenizer like BERT to make sure all words will be decomposable into tokens as it builds its vocabulary from single bytes. Each transaction sequence is again treated like a sentence. We then trained the RoBERTa model from scratch on a task of Masked Language Modeling, noting the similarity in completing a sentence and suggesting a course sequence. Next, we constructed a Sentence Transformer network [15] using the RoBERTa word embedding model and a mean pooling layer. For RoBERTa models trained on multiple enrollment status tokens, we derived the course embeddings using a sentence consisting of all the course’s related tokens (i.e. Data 100_E, Data 100_D).
4.4 Model Training and Evaluation
We use the equivalency validation set containing 480 course credit equivalency pairs maintained by the Office of Registrar as ground truth for course similarity. To increase the validation set, we swap the pairs, resulting in 960 pairs. We then filtered the validation set to include only courses that occur in the intersection of all filtered data (8,817 unique courses as shown in table 1) and courses that could be predicted by all models, yielding a total of 784 pairs.
Recall@10 is calculated for equivalency validation pairs using the model evaluation metrics and validation dataset (containing pairs of courses with equivalent credits) established in a previous study [12]. We find similar courses to the first course for each validation course pair by ranking other courses based on cosine similarity of their vector representations, and we calculate recall@10 based on the rank of the second course. For transaction Course2Vec models that take into account enrollment status tokens – for instance Course2Vec trained on classes with enrollment token “W" – equivalency pairs that could not be predicted because either one does not exist in the vocabulary set of Course2Vec (token “W”) are then predicted by a Course2Vec model trained on non-token sequences. To obtain a single embedding for a course with a Course2Vec model trained on multiple versions of the course with different enrollment tokens (E, D, W), we use 3 different methods: 1) simply use this model to get the embedding for the original course without any tokens (i.e. Math 1A), 2) average and 3) concatenate the embeddings of the various versions of the course with different tokens. To obtain a course embedding with Sentence Transformer based on a RoBERTa trained on transaction records with different tokens, we use 2 methods: 1) simply pass in the course without any tokens; 2) pass in a synthetic course sequence containing various versions of the course with different tokens (i.e. Math 1A_E, Math 1A_D).
We then use ten-fold cross-validation to select the best model hyper-parameters. We split the 784 validation pairs into 10 folds. Then, within each phase of the cross-validation, 80% of the validation pairs are used to find the best training hyper-parameters, which are then used to create a model to evaluate on the rest of the 20% of the pairs. The ranks of the test pairs are recorded for each fold, then they are appended together to calculate overall recall@10. We don’t use temporal cross-validation because the validation set consists of similarity pairs that do not have established dates associated with them. Grid search is used on the following hyperparameter space for both skip-gram and FastText:
- Min count: [10, 20, 30, 40, 50, 60, 70, 80, 90]
- Window: [2, 3, 4, 5, 6, 7, 8, 9]
- Vector size: [200, 210, 220, 230, 240, 250, 260, 270, 280, 290, 300, 310]
- Sample: [3.e-05, 2.e-05, 1.e-05]
- Alpha: [0.01, 0.02, 0.03, 0.04]
- Min alpha: [0.0001, 0.0003, 0.0005, 0.0007]
- Negative: [10, 15, 20, 25]
See Appendix A.1 for optimal hyperparameters for the best model. The optimal hyperparameters for our data are likely to differ from others’ based on size of course catalog and number of enrollments.
5. RESULTS
5.1 RQ1: Utility of non-enrollment transactions records
We found that transaction records do provide more course similarity signal. As shown in table 4, most models trained with enrollment (E) and non-enrollment (D& W) transactions (whether the tokens are hidden, averaged, concatenated) show improvements from the baseline models that are only trained on enrollment records. Only skip-gram and RoBERTa trained on chronologically ordered transaction records do not show any improvement from their respective baseline models trained on chronologically ordered enrollments. Additionally, we see that the best models that outperform the baseline E model are either models trained with the tokens E&D, or models trained with E&D&W. The enrollment status token W does not improve from the baseline model, as models trained on E&W perform worse than the baseline E models, suggesting that W transactions could be random noise. The greatest percent improvement from enrollment to transaction records is to use FastText trained on the full records (E,D,W) and ordered sequences. Overall, the best-performing model for skip-gram is that trained on E&D random order (no token), the best FastText model is that trained on E&D random order (average token), and the best RoBERTa model is that trained on E chronological order (no token).
Baseline (random) recall | Random | Baseline (ordered) recall | Ordered | |
|---|---|---|---|---|
| Skipgram | 0.296 | 2.53% (E&D/ no token) | 0.244 | 0% (E&D/ no token) |
| FastText | 0.446 | 4.22% (E&D/ avg) | 0.367 | 14.5% (E&D&W/ concat) |
| RoBERTa | 0.309 | 4.96% (E&D&W/ no token) | 0.347 | -2.19% (E&D&W/ no token) |
5.2 RQ2: Utility of chronological transactions records
The chronological order of the transaction data does not improve the course similarity signal for skip-gram and FastText, but does improve the signal for RoBERTa, as shown in table 5. The greatest percent decrease in performance from randomization to chronology is skip-gram trained on E & W transactions, and the greatest percent increase in performance from randomization to chronology is RoBERTa trained only on enrollments.
| E | E & D | E & W | E & D & W | |
|---|---|---|---|---|
| Skipgram | 0.296-17.6% | 0.304-19.6% | 0.296-22.6% | 0.295-17.9% |
| FastText | 0.446-17.6% | 0.464-11.9% | 0.418-11.9% | 0.458-7.67% |
| RoBERTa | 0.309+12.4% | 0.320+3.19% | 0.305-3.35% | 0.324+4.72% |
In general, the best model overall is FastText trained on random (within-semester) ordered E & D transactions (evaluated by averaging the E and D embeddings), with a recall@10 of 0.464. And the best model trained only on enrollment events is FastText trained on randomly (within-semester) ordered events, with a recall of 0.445.
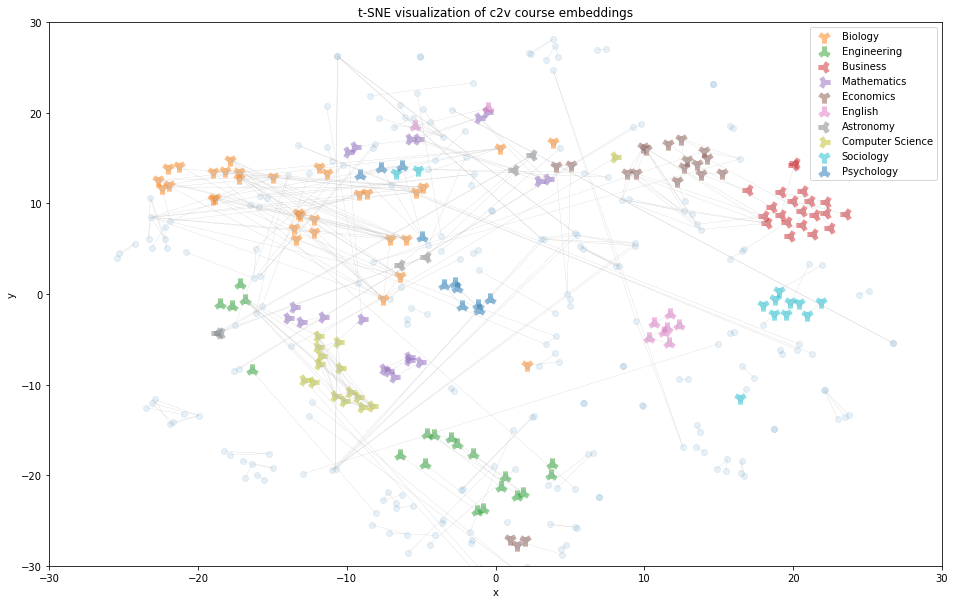
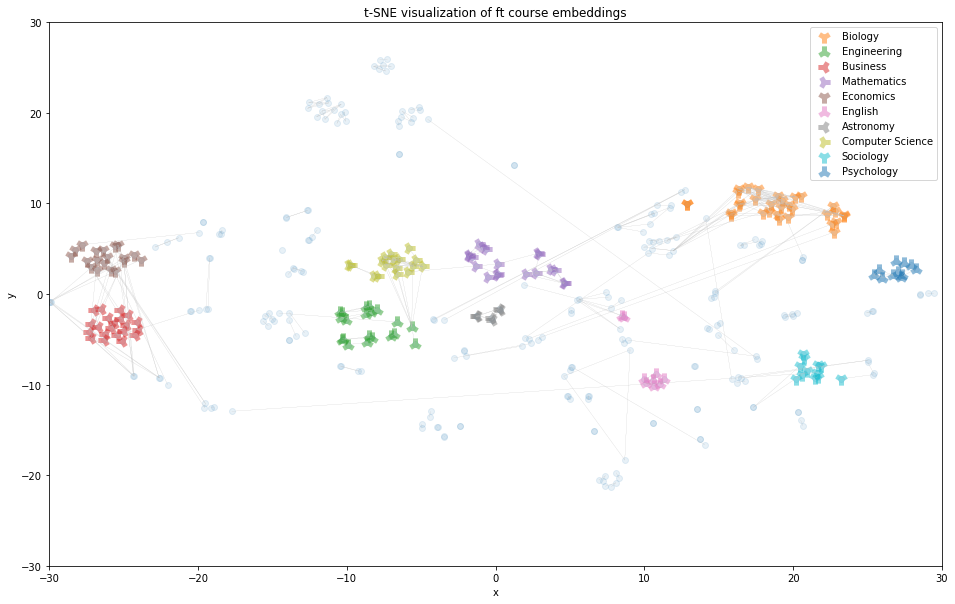
5.3 Visualizing embeddings
To provide an intuitive explanation for the increase in recall@10 from course2vec skipgram to FastText, we present comparisons of the TSNE visualizations of courses in randomly selected departments produced by these 2 models (Fig.2.). We chose to not present all departments to avoid overcrowding the visuals. The colored points indicate different departments, the transparent blue points indicate the rest of the courses in the validation pairs, and the faint grey lines indicate connections between equivalency pairs. Visually, we see that the FastText embeddings appear more closely clustered than the Course2Vec skipgram embeddings.
6. ANALYZING PREDICTIVE POWER
We investigate how well we could predict the various features of the courses using the best model trained on extra non-enrollment actions vs. the best model trained on only enrollment actions. These features include whether the course is STEM (binary), the department of the course (80 categories), the division (3 categories), diversity of student majors enrolled in the course (binary), the course’s utility to satisfy requirements (binary), and its popularity (binary). Diversity (the number of different types of unique student majors enrolled in the course), requirement utility (the number of requirement lists the course satisfy), and popularity (the frequency of student interactions with the course) are made into binary variables by categorizing the course as below and equal to or above the median value. We compared the accuracies (Table 6) of a baseline majority, logistic regression, and MLP classifier using the best embeddings of the enrollment actions (FastText trained on randomly ordered E records) and the best embeddings of transaction actions (average FastText embedding trained on randomly ordered E & D records), obtained through 5-fold cross validation. See Appendix A.2 for the optimal hyperparameters for logistic regression and MLP.
In general, for all models, the best transaction embedding is able to improve on the enrollment embedding. For both embeddings, logistic regression and MLP models are able to achieve almost perfect accuracy on predicting STEM/non-STEM, department, and division of the courses in the validation pairs. The biggest improvement comes from course requirement utility (16.4% increase for logistic regression). Overall, transaction embeddings have great predictive power in classifying various course features.
Baseline majority | Logistic regression (E) | MLP (E) | Logistic regression (E, D) | MLP (E,D) |
|
|---|---|---|---|---|---|
STEM/ non-STEM | 0.519 | 0.993 | 0.994 | 0.995 | 0.999 |
| department | 0.0885 | 0.998 | 0.987 | 0.995 | 0.998 |
| division | 0.549 | 0.994 | 0.984 | 0.984 | 0.998 |
student major diversity | 0.785 | 0.816 | 0.975 | 0.944 | 0.983 |
course requirement utility | 0.510 | 0.816 | 0.950 | 0.950 | 0.989 |
| popularity | 0.472 | 0.846 | 0.963 | 0.914 | 0.984 |
7. DISCUSSION & FUTURE WORK
Does chronology add more similarity signals to enrollment data? Our results suggest that there is no more signal in chronology than randomization. Overall, the best-performing model for skip-gram is that trained on E&D random order, the best FastText model is that trained on E&D random order, and the best RoBERTa model is that trained on E chronological order. This suggests that these models are more likely to pick up on course similarity signals when the data contains transactions (E,D,W) and are randomly ordered. The reason that randomized course sequences work better than ordered ones could be that randomization gives courses more contexts, especially popular courses. Popular courses are more likely to be chosen first in a course sequence for a semester, meaning that they may have fewer different courses in their context window than other courses during training for skip-gram and FastTexts, compared to courses that are chosen in the middle of the sequence. However, for chronologically ordered transactions, FastText is the only model that’s able to pick up more signal, likely because of its ability to take advantage of the morphological structure of course names, despite the potential negative effect of chronology in reducing contexts. Future work could focus on investigating further the reason why randomization provides better similarity signal than chronology.
There are several other areas of additional future work. First, a limitation of our work is that it may not be practical for many institutions to collect or utilize transaction data. These data are rare, so we only had one institution’s dataset to analyze, limiting our ability to make claims on generalizability. Future work could focus on investigating whether the same conclusions hold for transaction data of other institutions. Second, the fact that RoBERTa is able to benefit from the signal of the chronology of the transaction data, while FastText benefits from the random order could justify future work into combining the embeddings of FastText and RoBERTa. Next, we could explore better ways of obtaining course embeddings from RoBERTa to take advantage of its contextual nature. The subpar performance of RoBERTa compared to FastText despite it being a contextual model is one of the limitations of our work. When we are obtaining the course embeddings, we are not taking advantage of the contextual nature of the model to the fullest extent. Usually, a sentence is passed to the contextual model to obtain a word embedding using the contexts of the sentence. In our case, to get a course embedding, we could pass in an actual transaction sequence containing the course. We could also use Set Transformer as an additional model of comparison for course embedding, given our finding that the order of course sequences did not matter[7]. Next, future work could also focus on investigating why wait-listed transactions don’t provide additional signals on top of enrollment, where as dropped, or dropped and waitlisted actions do add additional signal. Perhaps students are more likely to drop a course as they enroll in an equivalent course, than waitlisting a course as they enroll in another course that satisfies the same requirement. Lastly, while transaction data is shown to predict course features well, we could also use it to predict student-level features. For instance, we could explore the rationality of student decision-making by using additional transaction data features such as reason for enrollment actions.
8. CONCLUSION
Our study investigates the utility of novel transaction data (which contains granular non-enrollment student actions and chronologically ordered records) in similarity-based course recommendations. We evaluate such similarity signals with skip-gram, FastText, and RoBERTa models. We showed that transaction records including enrolling, waitlisting, and dropping student actions improve course similarity signals from enrollment records. Additionally, we found that chronology does not provide more course similarity signal than randomization of transaction records for skip-gram and FastText, but does so for RoBERTa. In fact, the best-performing model is FastText trained on random enrolling and dropping transactions. Our study provides some new pieces of information that could help course recommendation systems. We now know that chronology of enrollment is not beneficial to course2vec using skip-grams or FastText, but does benefit the transformer-based RoBERTa. We also found transaction course embeddings have greater predictive power in classifying courses into features such as STEM/non-STEM designation, department, and requirement satisfaction. The accuracy from predicting which courses satisfy major requirements significantly improves by using transactions (enroll and drop events) – from 81.6% to 95.0%, which is likely close to human advisor-level fidelity. This increase could be essential for course recommender models that may want to learn degree requirements from data.
9. REFERENCES
- P. Bojanowski, E. Grave, A. Joulin, and T. Mikolov. Enriching word vectors with subword information. Transactions of the Association for Computational Linguistics, 5:135–146, 2017.
- M. H. de Menéndez, R. Morales-Menendez, C. A. Escobar, and R. A. R. Mendoza. Learning analytics: state of the art. International Journal on Interactive Design and Manufacturing, 16:1209–1230, 2022.
- H. Heuer and A. Breiter. Student success prediction and the trade-off between big data and data minimization. DeLFI, 2018.
- L. Huang, C.-D. Wang, H.-Y. Chao, J.-H. Lai, and P. S. Yu. A score prediction approach for optional course recommendation via cross-user-domain collaborative filtering. IEEE Access, 7:19550–19563, 2019.
- M. E. Ibrahim, Y. Yang, D. L. Ndzi, G. Yang, and M. Al-Maliki. Ontology-based personalized course recommendation framework. IEEE Access, 7:5180–5199, 2019.
- W. Jiang and Z. A. Pardos. Evaluating sources of course information and models of representation on a variety of institutional prediction tasks. In Educational Data Mining, 2020.
- J. Lee, Y. Lee, J. Kim, A. Kosiorek, S. Choi, and Y. W. Teh. Set transformer: A framework for attention-based permutation-invariant neural networks. In K. Chaudhuri and R. Salakhutdinov, editors, Proceedings of the 36th International Conference on Machine Learning, volume 97 of Proceedings of Machine Learning Research, pages 3744–3753. PMLR, 09–15 Jun 2019.
- Y. Liu, M. Ott, N. Goyal, J. Du, M. Joshi, D. Chen, O. Levy, M. Lewis, L. Zettlemoyer, and V. Stoyanov. Roberta: A robustly optimized bert pretraining approach, 2019. cite arxiv:1907.11692.
- R. Morsomme and S. V. Alferez. Content-based course recommender system for liberal arts education. In Educational Data Mining, 2019.
- Z. A. Pardos, H. Chau, and H. Zhao. Data-assistive course-to-course articulation using machine translation. In Proceedings of the Sixth (2019) ACM Conference on Learning @ Scale, L@S ’19, New York, NY, USA, 2019. Association for Computing Machinery.
- Z. A. Pardos, Z. Fan, and W. Jiang. Connectionist recommendation in the wild: On the utility and scrutability of neural networks for personalized course guidance. User Modeling and User-Adapted Interaction, 29(2):487–525, apr 2019.
- Z. A. Pardos and W. Jiang. Designing for serendipity in a university course recommendation system. In Proceedings of the Tenth International Conference on Learning Analytics amp; Knowledge, LAK ’20, page 350–359, New York, NY, USA, 2020. Association for Computing Machinery.
- Z. A. Pardos and A. J. H. Nam. A university map of course knowledge. PLOS ONE, 15(9):1–24, 09 2020.
- S. Reddy, I. Labutov, and T. Joachims. Latent skill embedding for personalized lesson sequence recommendation. CoRR, abs/1602.07029, 2016.
- N. Reimers and I. Gurevych. Sentence-BERT: Sentence embeddings using Siamese BERT-networks. In Proceedings of the 2019 Conference on Empirical Methods in Natural Language Processing and the 9th International Joint Conference on Natural Language Processing (EMNLP-IJCNLP), pages 3982–3992, Hong Kong, China, Nov. 2019. Association for Computational Linguistics.
- M. C. Urdaneta-Ponte, A. Mendez-Zorrilla, and I. Oleagordia-Ruiz. Recommendation systems for education: Systematic review. Electronics, 10(14), 2021.
- N. N. Vo, Q. T. Vu, N. H. Vu, T. A. Vu, B. D. Mach, and G. Xu. Domain-specific nlp system to support learning path and curriculum design at tech universities. Computers and Education: Artificial Intelligence, 3:100042, 2022.
- Y. Xu and Z. A. Pardos. Extracting course similarity signal from enrollments using subword embeddings. Under review at the 18th Workshop on Innovative Use of NLP for Building Educational Applications, Submitted.
- G. Zhu, N. A. Kopalle, Y. Wang, X. Liu, K. Jona, and K. Börner. Community-based data integration of course and job data in support of personalized career-education recommendations. Proceedings of the Association for Information Science and Technology, 57, 2020.
APPENDIX
A. OPTIMAL MODEL HYPERPARAMETERS
A.1 FastText
The optimal hyperparameters for the best performing model (FastText trained on randomly ordered E & D transaction records) are as follows: min count = 50, window = 9, vector size = 210, sample = 3.e-05, alpha = 0.04, min alpha = 0.0007, negative = 15.
A.2 Predictive Models
The hyperameters used for the multinomial logistic regression are: max number of iterations = 1000, penalty = l2 norm. The hyperparameters used for MLP are as follows: hidden layer = 100, activation function = relu, solver = adam, alpha = 0.0001, batch size = min (200, number of samples), learning rate = 0.001, maximum number of iterations = 200.
© 2023 Copyright is held by the author(s). This work is distributed under the Creative Commons Attribution-NonCommercial-NoDerivatives 4.0 International (CC BY-NC-ND 4.0) license.