ABSTRACT
Is there a pattern in how students solve Parsons puzzles? Is there a difference between the puzzle-solving strategies of C++ and Java students? We used Markov transition matrix to answer these questions. We analyzed the solutions of introductory programming students solving Parsons puzzles involving if-else statements and while loops in C++ and Java from fall 2016 to fall 2020. We present the results of our analysis qualitatively as heat maps and quantitatively using descriptive statistics.
We found that most students solved the puzzles in the order in which lines appeared in the correct solution. Counter-intuitively, we found this pattern even in the solutions of the puzzles involving nested if-else statements, multiple while loops and nested while loops. Students who solved the puzzles with the fewest actions acted upon fewer lines out of order, i.e., not in the order in which they appear in the final solution. Whenever we found a statistically significant difference between C++ and Java solutions, C++ solutions involved fewer out-of-order and redundant actions than Java solutions. We discuss the implications of these results for the use of Parsons puzzles as a tool for teaching introductory programming.
Keywords
INTRODUCTION
In a Parsons puzzle [21], first proposed as an engaging way to learn programming, the student is given a program in scrambled order and asked to reassemble it in its correct order. The puzzle may also contain distracters, which are incorrect variants of lines in the puzzle that are meant to be discarded. Parsons puzzles have gained popularity - scores on Parsons puzzles were found to correlate with scores on code-writing exercises [2]. Solving Parsons puzzles was found to take significantly less time than fixing errors in code or writing equivalent code, but resulted in the same learning performance and retention [6]. In electronic books, students preferred solving Parsons puzzles to answering multiple choice questions or writing code [5]. Researchers have placed Parsons puzzles in a hierarchy of programming skills alongside code-tracing [19], and have proposed using it to scaffold software design process [9]. Software to administer Parsons puzzles have been developed for Turbo Pascal [21], Python (e.g., [1,11,12]) and C++/Java/C# [15].
The focus in Parsons puzzles research lately has been on how students solve them and what does/does not help students solve them better, e.g., the patterns in how students solve the puzzles [10,14]; that subgoal labels help students solve puzzles better [20]; that adaptive practice of Parsons puzzles is just as effective as writing code [4, 7]; that students are twice as likely to complete adaptive puzzles than non-adaptive ones [4]; but, motivational supports [16] and the use of mnemonic variable names [13] do not help students solve puzzles more efficiently. Yet, the effectiveness of Parsons puzzles as a tool for learning programming remains unresolved due to lack of replicated research [3] or contradictory results that found no correlation between Parsons puzzles and code-tracing / code-writing exercises [18].
Another focus of research has been on the strategies used by students to solve Parsons puzzles. Each Parsons puzzle typically has only one correct solution. So, the correct solution, i.e., the final re-assembled program will be the same for all the students. But, the order in which students go about assembling the lines of code will vary among students. This order reflects their puzzle-solving strategy.
One study found that novice students solved puzzles by focusing on indentation of individual lines or their syntax [8] when lines were presented with indentation. Another study [10] found that some students used “linear” order, i.e., the order in which scrambled lines were provided. But, the study also observed backtracking and looping behavior, which were unproductive. Experts were found to use top-down strategy to solve Parsons puzzles in a study [11]. Students were found to use statement-level semantics more than control-flow semantics to solve puzzles in a recent study [22]. Another study reports that students found the final few steps of the solution to be more challenging [24].
These studies have used various techniques to identify the puzzle-solving strategy of students: think-aloud protocol [8, 11], a state-transition diagram of puzzle-solving states and student transitions [10], edit distance trails and k-means clustering [24] and application of BNF grammar rules to student logs [17]. Think-aloud protocols are gold standard for qualitative research, but they do not scale with the number of participants. State transition diagrams can grow intractable in size with combinatorially explosive number of states in all but very small puzzles, making it hard to find puzzle-solving patterns with the approach. Edit-distance trails [24] lose line-specific information in the puzzles and are better suited for revealing the rate at which students make progress towards the final solution. BNF grammars are suitable for verifying whether a student used a specific puzzle-solving strategy, not for finding the student’s strategy.
In contrast, a first order Markov transition matrix (not to be mistaken for Hidden Markov Models) can be used to find patterns in time-series data. The matrix has dimensions determined by the number of lines in a puzzle, and not the number of states or students. So, it is scalable with the number of students. We used it to analyze the data collected from the puzzle-solving sessions of students to find patterns or strategies. The research questions for our analysis were:
- RQ1: Is there a pattern in how students solve the puzzles? Answer to this question may help shed light on how to improve them to promote learning.
- RQ2: Is there a difference between the puzzle-solving strategies of C++ and Java students? This question is of interest because of the difference in the programming paradigm typically used in the two languages: imperative-first in C++ versus objects-first in Java, even though both the languages support object-oriented programming.
Parsons puzzle Interface
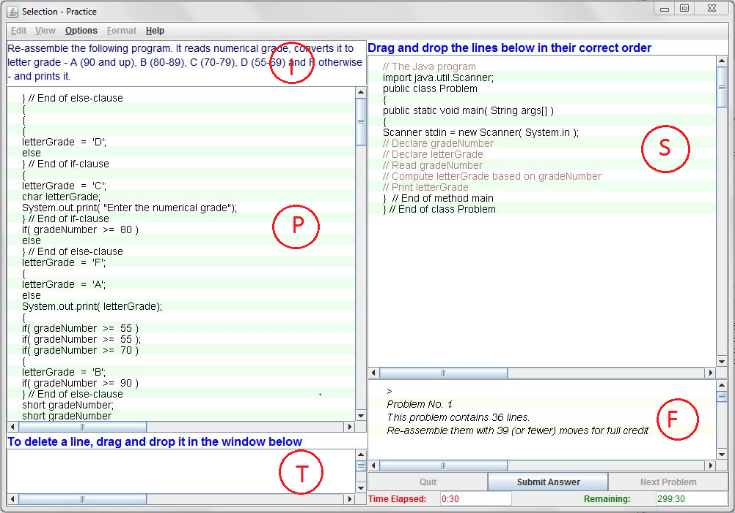
For this study, we used the data collected by epplets (epplets.org) [15], a suite of tutors on Parsons puzzles. The user interface of the tutors is shown in Figure 1. The problem statement is displayed in the instruction panel (I). The code for the problem is presented in the problem panel (P), both scrambled and unindented. The solution is assembled in the Solution panel (S). Distracters are deleted when dragged into the Trash panel (T). Feedback is provided for incorrect actions in the Feedback panel (F). The student has the following actions available for solving the puzzle:
- Insert: Drag a line of code from the Problem panel (P) or the Trash panel (T) to the Solution panel (S) and drop it anywhere in S;
- Delete: Drag a line of code from the Problem panel (P) or the Solution panel (S) to the Trash panel (T);
- Reorder a line of code in the Solution panel (S) by moving it up or down by one or more lines;
- Undo: Return a line from either the Solution panel (S) or the Trash panel (T) back to the Problem panel (P) - the line is placed back in its original scrambled order in the Problem panel (P);
In addition, students could indent/outdent lines of code in the Solution panel (S) to improve the readability of the program. But, these actions were not counted in our analysis since indentation does not affect the semantics of C++ and Java programs.
The tutors do not provide any feedback while the student is solving the puzzle. If the student attempts to submit an incomplete solution before moving all the lines out of the panel P, the tutors direct the student to properly place all the lines before submitting their solution. Once a complete solution is submitted, the tutors repeatedly highlight the next line in the solution that is not in its correct location. The tutors either suggest how the line should be moved or point out the line of code that should replace it. The tutors provide such feedback until the solution is correct. The actions taken by the student in response to the feedback become part of the student’s solution sequence.
markov tRansition matrix
The tutors report the order in which students solve a Parsons puzzle as a sequence of
For example, consider a four-line Parsons puzzle with no distracters. The four lines are provided scrambled in panel P (Figure 1). We will refer to these lines by their location in the correct solution, e.g., line 3 is the line that should appear third in the correct solution, although it may be in any order in panel P. Suppose a student solves the puzzle using the following actions:
- Drags line 3 from panel P to S;
- Drags line 1 from P to S and drops it after line 3;
- Moves line 3 after line 1 in S;
- Drags line 2 from P to S and drops it after line 3;
- Drags line 4 from P to S and drops it after line 2; and
- Moves line 2 up so that it appears between lines 1 and 2.
The corresponding action sequence is
- <3, Insert>
- <1, Insert>
- <3, Reorder>
- <2, Insert>
- <4, Insert>
- <2, Reorder>.
From this action sequence, we extract the order in which the student acted upon the lines of the puzzle as 3-1-3-2-4-2. Finally, we use this order of lines to build a Markov transition matrix [25].
In a Markov transition matrix, the rows and columns are line numbers in the program, followed by distracters in the puzzle. In addition, the matrix contains a first row for the start state S before attempting the puzzle and a last column for the end state E after completely solving the puzzle. So, Markov matrix is an n X n matrix where n = number of lines + number of distracters + 1.
We will use M as the abbreviation for Markov transition matrix and Mi,j to denote the element of the matrix on row i and column j. Initially, all the elements Mi,j = 0. If a student applies an action to line j after applying an action to line i, Mi,j is incremented by 1.
As an illustration, consider a puzzle containing 4 lines of code that are provided to the student scrambled. The left side of Figure 2 shows the Markov transition matrix of a student who applies actions to lines in the following order: 4-1-2-1-3-4. Since the first line acted on by the student is 4, MS,4 = 1. Thereafter, the matrix entries that are set to 1 are M4,1, M1,2, M2,1, M1,3, M3,4 and finally, M4,E since 4 is the last line to be acted upon. The right side of the figure shows the matrix for a student who applies actions to lines in the following order: 1-3-2-2-3-2-4-1. In particular, note that the student acts upon line 2 after line 3 twice – hence, M3,2 = 2. The student applies back-to-back actions to line 2, e.g., inserts line 2 into the solution, and immediately reorders it in the solution – hence, M2,2 = 1. The last line acted upon is line 1 – hence, M1,E = 1.
For our analysis, we combined the Markov matrices of all the student solutions into a single transition matrix, such that:
Mi,j = ∑ ai,j / s
∑ ai,j is the sum of all the actions on line j after line i in all the student solutions;
s is the number of student solutions, i.e., the number of times students solved the puzzle.
1 | 2 | 3 | 4 | E | 1 | 2 | 3 | 4 | E | |||
S | 1 | S | 1 | |||||||||
1 | 1 | 1 | 1 | 1 | 1 | |||||||
2 | 1 | 2 | 1 | 1 | 1 | |||||||
3 | 1 | 3 | 2 | |||||||||
4 | 1 | 1 | 4 | 1 |
So, Mi,j is the number of actions on line j after line i per student solution. If all the students applied exactly one action to each line in each solution, 0 ≤ Mi,j ≤ 1.
Since the puzzles also included two distracters D1 and D2, we added rows and columns in the matrix for D1 and D2 after those for all the lines in the puzzle. Mi,D1 refers to students acting on the first distracter D1 after line i. In the matrix:
- If each student applies exactly one action to each line of code, the sum of all the entries in a row / column is 1. But, since a student may apply more than one action to a line of code (e.g., insert into the solution, reorder within the solution), the sum of each row / column is at least 1.
- The larger the value of Mi,j, the larger the number of times students applied an action to line j after line i.
- A puzzle assembled in the correct order of lines, i.e., line 1 in the solution is inserted first (MS,1), line 2 in the solution is inserted next (M1,2), and so on, will appear as entries in all the diagonal elements of the matrix from top left to bottom right.
- When the solutions of all the students are combined in a matrix, each widely used puzzle-solving strategy produces a distinct pattern in the matrix: entries between frame elements are large in frame-first strategy and most of the elements are non-zero and small in a random strategy.
Data collection and Analysis
For this study, we analyzed the data collected online by two Parsons puzzle tutors called epplets (epplets.org) [15] on if-else statements and while loops. The tutors were used by introductory programming students as after-class assignments in high schools, community colleges and baccalaureate institutions during fall 2016 – fall 2020 as shown in Table 1. Some schools used the tutors for C++ and others for Java – so, the two sets of users were mutually exclusive. C++ and Java versions of each puzzle were of exactly the same size. This made it possible to compare the solutions in the two languages. Since the tutor users were introductory programming students, they had little prior programming experience. The demographics of the students using the two tutors are shown in Table 2. Not everyone reported their gender/race/major.
The tutors were set up to randomize the variable names and data types used in the puzzles. They also randomly scrambled code in the problem panel P. Research shows that novice programming students are unduly influenced by the superficial differences resulting from such randomization [31, 32, 33]. This randomization deterred plagiarism since no student saw the same puzzle verbatim more than once and no two students saw the same puzzle verbatim. It also deterred solution-sharing plagiarism schemes that afflict programming tutors [27].
Fall 2016 – Fall 2020 | if-else | while loop | ||
|---|---|---|---|---|
Type of Institution | C++ | Java | C++ | Java |
High Schools | 2 | 11 | 1 | 5 |
Community Colleges | 3 | 1 | 2 | 2 |
Baccalaureate Institutions | 4 | 13 | 3 | 11 |
For our analysis, we considered only those students who solved a puzzle completely and correctly so that we could find patterns among those who successfully solved the puzzle. Only students who consented to their data being used for research purposes were included in the study. Because of these two factors, the N reported in Table 2 is not the same as those reported in subsequent tables. Since the tutors were accessible over the web, students could use the tutors as often as they pleased. If a student used a tutor more than once, we picked the session in which the student had solved the most number of puzzles. In case of a tie between two sessions, we used the data from only the first session.
Fall 2016 – Fall 2020 | if-else | while loop | |
|---|---|---|---|
N | 431 | 203 | |
Gender | Male | 264 | 102 |
Female | 100 | 38 | |
Race | Caucasian | 194 | 78 |
Asian | 91 | 33 | |
Other | 70 | 25 | |
Major | Computer Science | 170 | 76 |
Engineering | 77 | 25 | |
Sciences | 22 | 7 | |
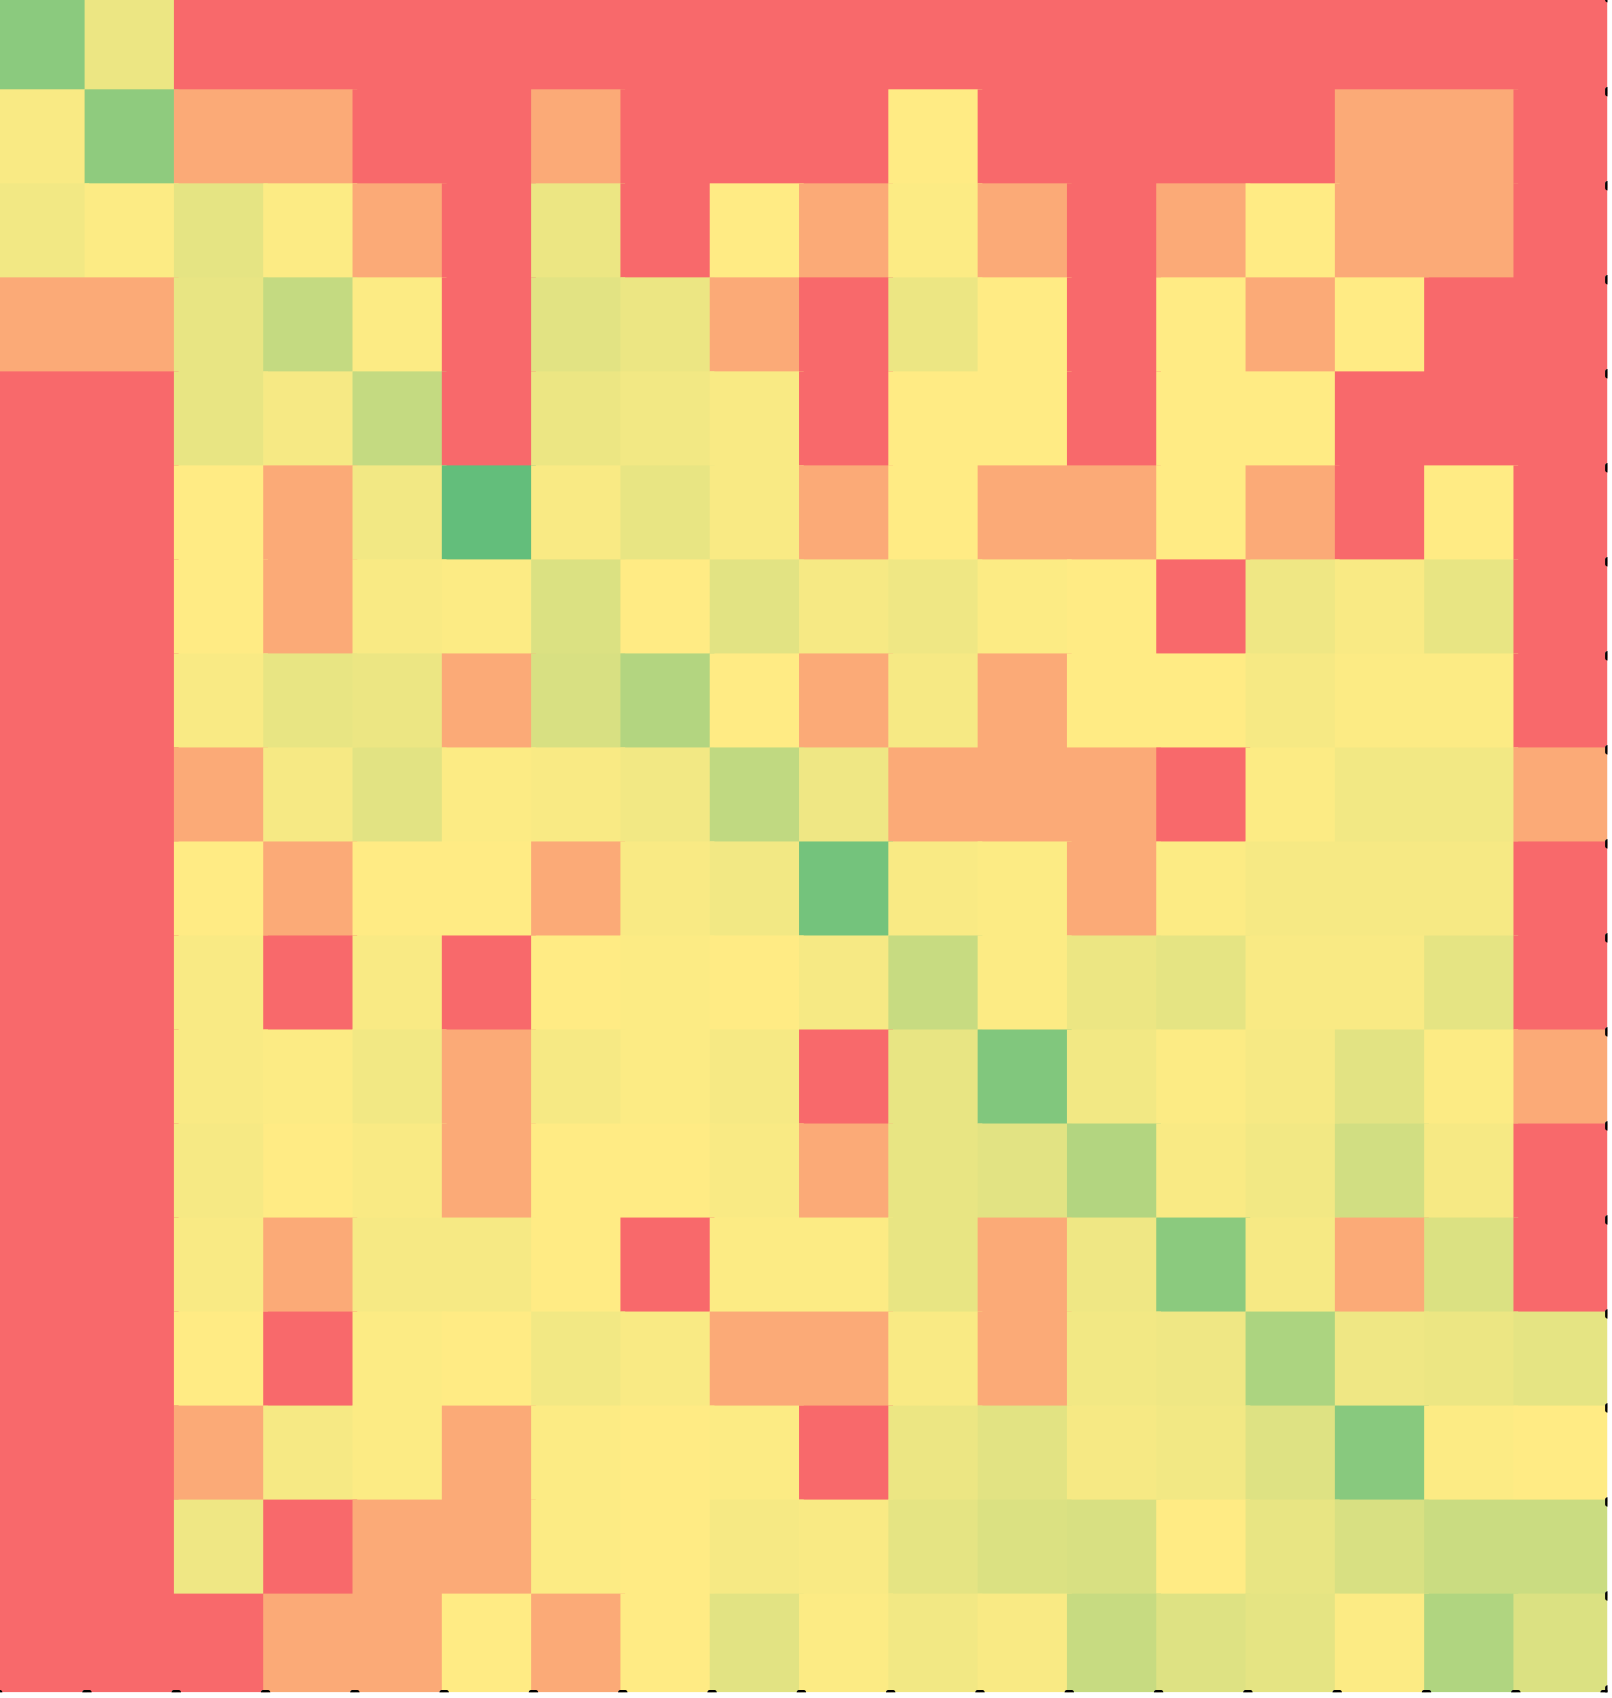
We analyzed the data of each puzzle using three-color heat maps and descriptive statistics. A three-color heat map shows zero values in red, maximal values (0.2 and up) in shades of green and intermediate values (0.1 – 0.2) in yellow. For the calculation of descriptive statistics, we eliminated the last two rows and the penultimate two columns in the matrix corresponding to the two distracters – they were not part of the correct solution. The descriptive statistics included:
- the number of different lines acted upon first (F) by students, i.e., the number of non-zero cells in the first row of the matrix;
- the number of different lines acted upon last (L) by students, i.e., the number of non-zero cells in the last column of the matrix;
- the percentage of matrix cells (C) that are non-diagonal and non-zero; and
- the sum of the values (V) of non-diagonal non-zero matrix cells expressed as a percentage of the sum of the values of all non-zero cells.
- The mean of diagonal elements (µd).
Note that the greater the values of F and L, the more varied the solutions. The larger the value of C, the more the lines that were acted upon out of order, i.e., not in the order in which they appear in the final solution. The larger the value V, the more the redundant actions and hence, the less efficient the solutions.
A puzzle with n lines can be solved with n actions. For the purposes of analysis, we considered as minimal solvers, students who solved a puzzle with no more than 1.1n actions, i.e., with no more than 10% redundant actions. Minimal solvers were a subset of all the solvers of a puzzle. We analyzed the data of each puzzle, both for non-minimal and minimal solvers. We computed the statistical significance of the difference between two groups (e.g., non-minimal versus minimal solvers) by using paired sample t-test in which the corresponding values Mi,j (the element of the Markov matrix on row i and column j) of the two groups were paired.
Results
if-else puzzles
The first puzzle solved by the students was on a program that read two numbers and printed the smaller of the two numbers. The puzzle contained 14 lines of code and 2 distracters.
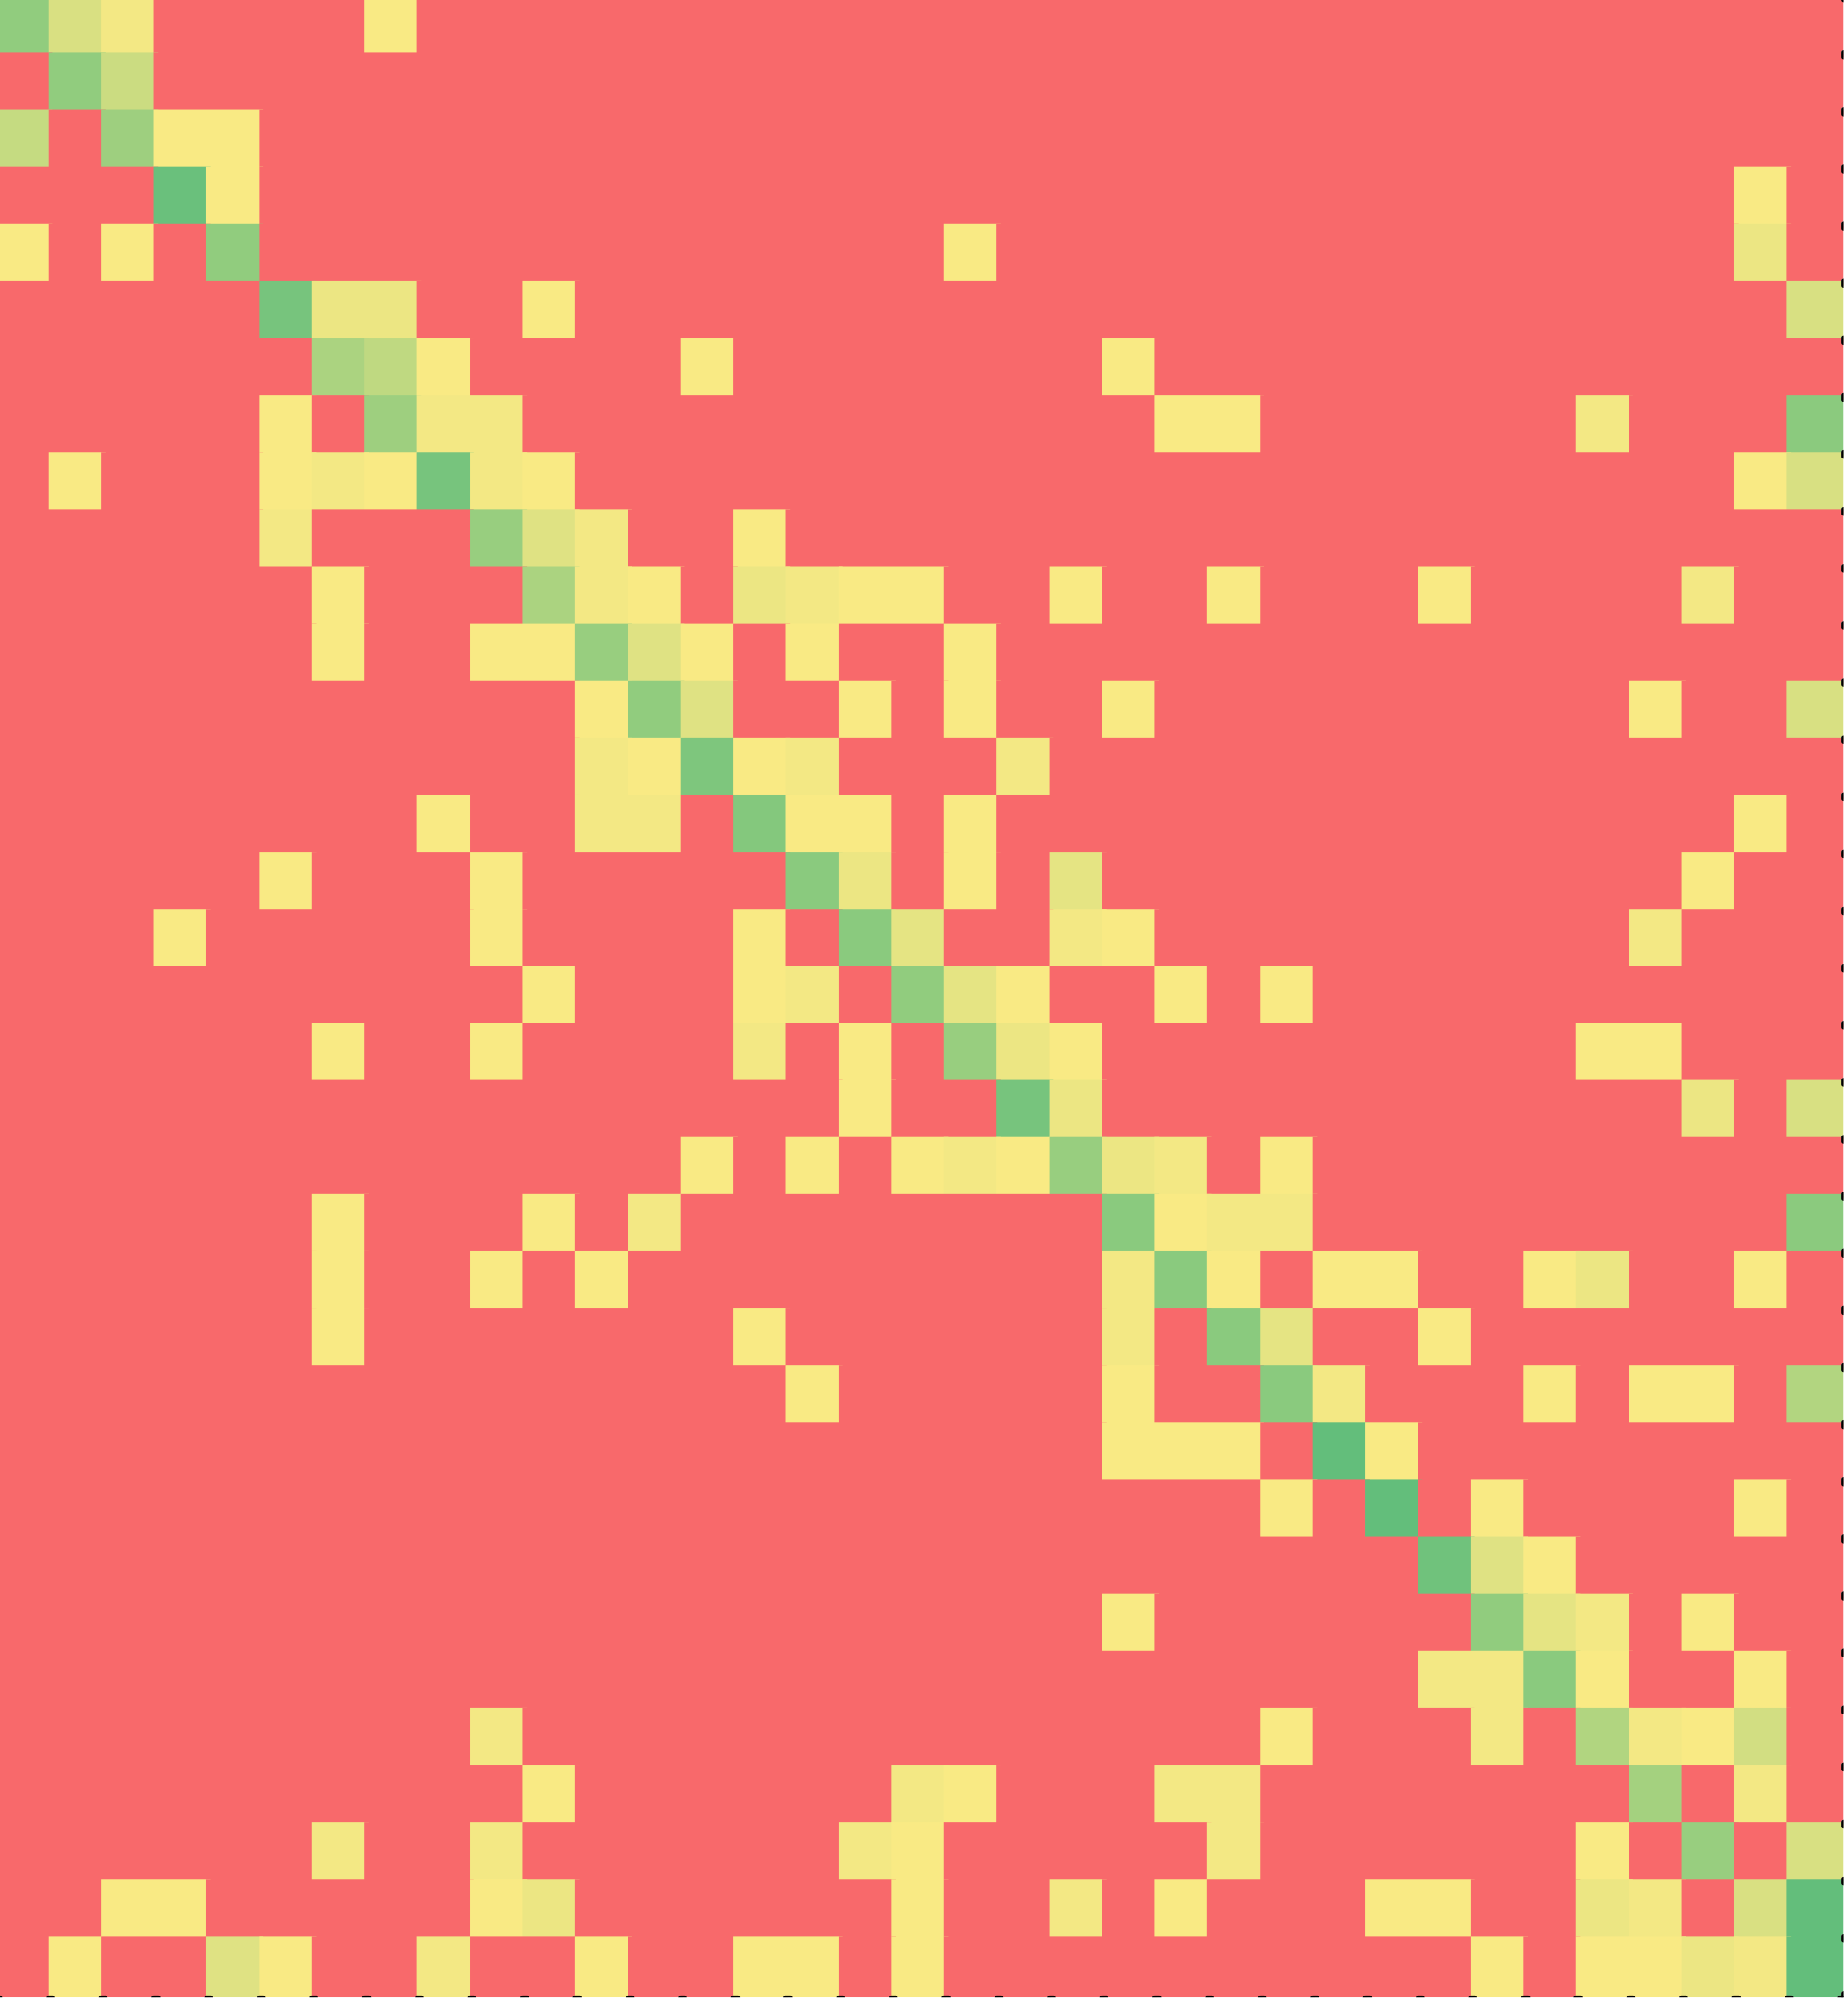
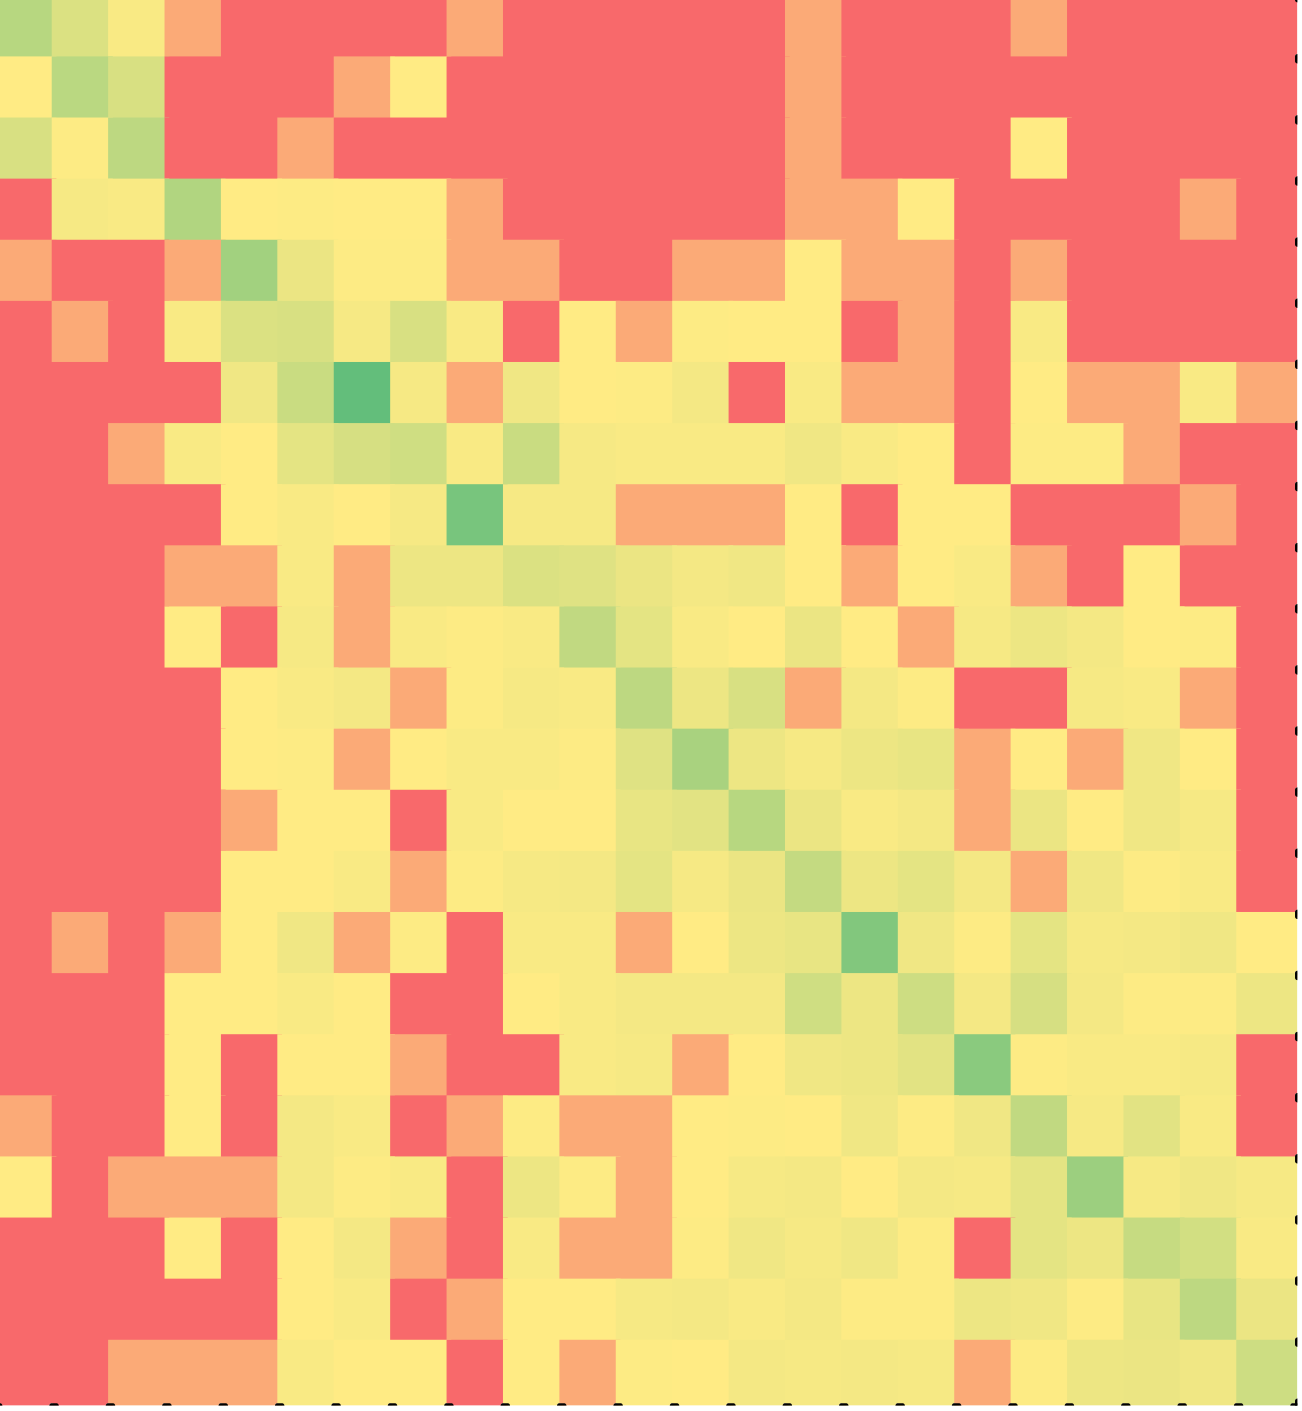
Figure 3 shows the heat map of C++ solutions: for non-minimal solutions on the left and minimal solutions on the right. In the heat maps, the last two rows and the penultimate two columns correspond to distracters. Note the following in Figure 3:
- A majority of both non-minimal and minimal solvers assembled the puzzle in the order in which the lines appeared in the correct program. So, the largest values are all along the diagonal – µd, the mean of diagonal elements, is 0.61 for non-minimal and 0.81 for minimal solvers. This behavior was much more pronounced among minimal solvers: the diagonal is brighter green and far more non-diagonal cells are red (zero). Paired sample t-test yielded a statistically significant difference between the two groups (p < 0.001).
- Students discarded distracters more often than not at the end of the session – the cells in the last column for the last two rows are green.
Minimal solvers solved the puzzles with no more than 10% unnecessary actions. But, this did not mean, they had to assemble the puzzle in the order in which the lines appeared in the correct program (corresponding to the diagonal from top left to bottom right being green): they could have assembled the program in reverse order, i.e., the last line first and the first line last (corresponding to the diagonal elements from the bottom left to the top right being green) or in random order (non-diagonal elements just as likely to be green as diagonal elements). That a majority of both non-minimal and minimal solvers solved the puzzles in the correct order of the lines in the puzzle is a novel and interesting finding of this study.
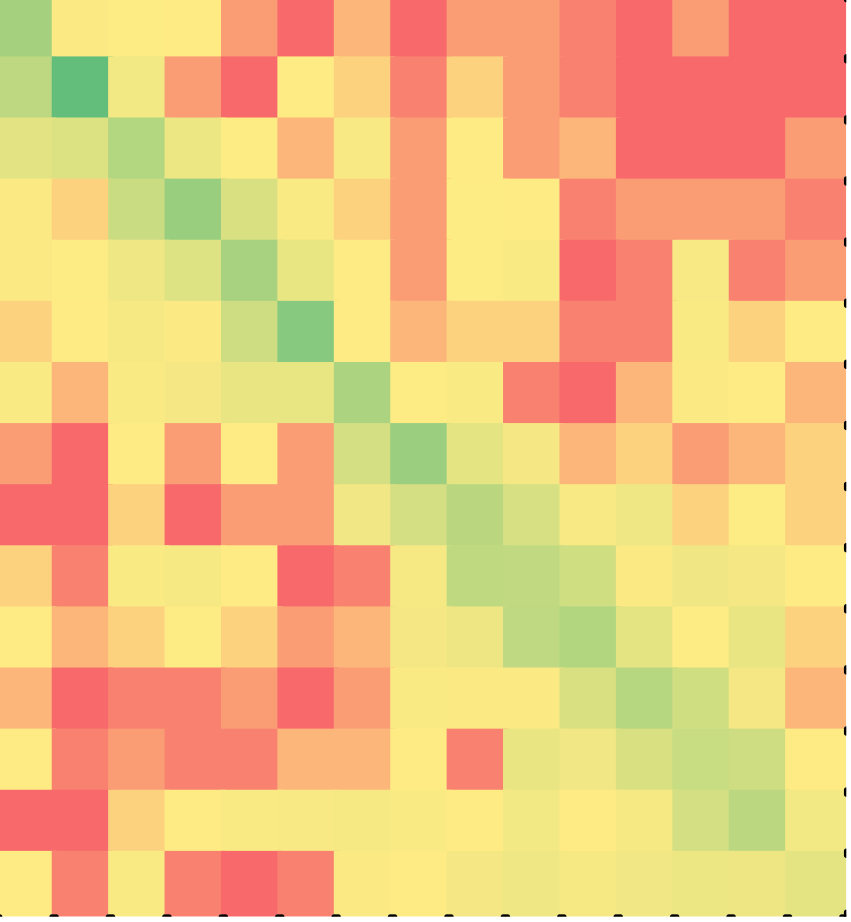
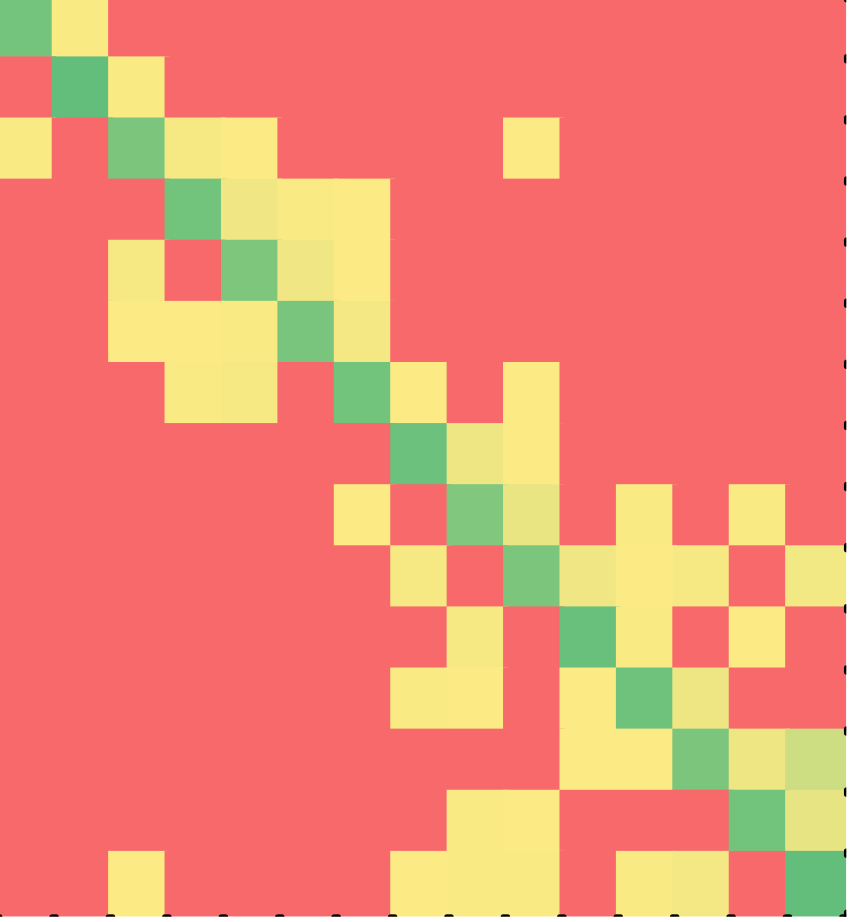
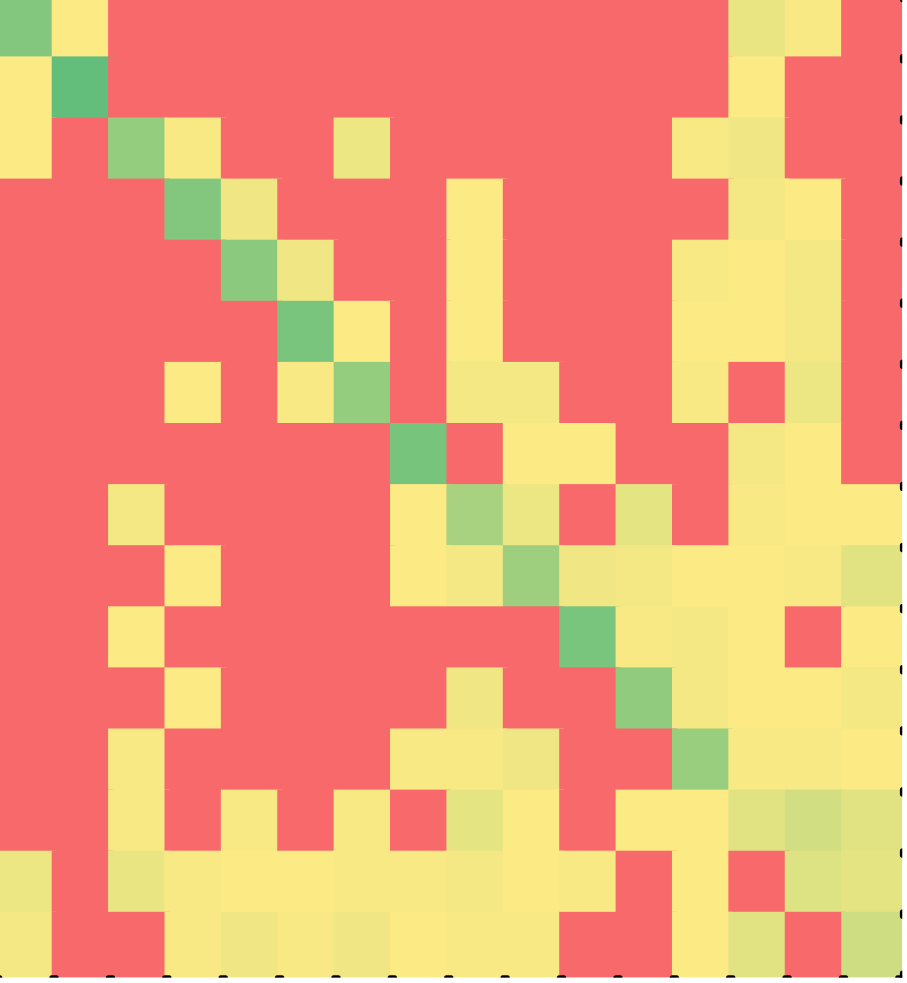
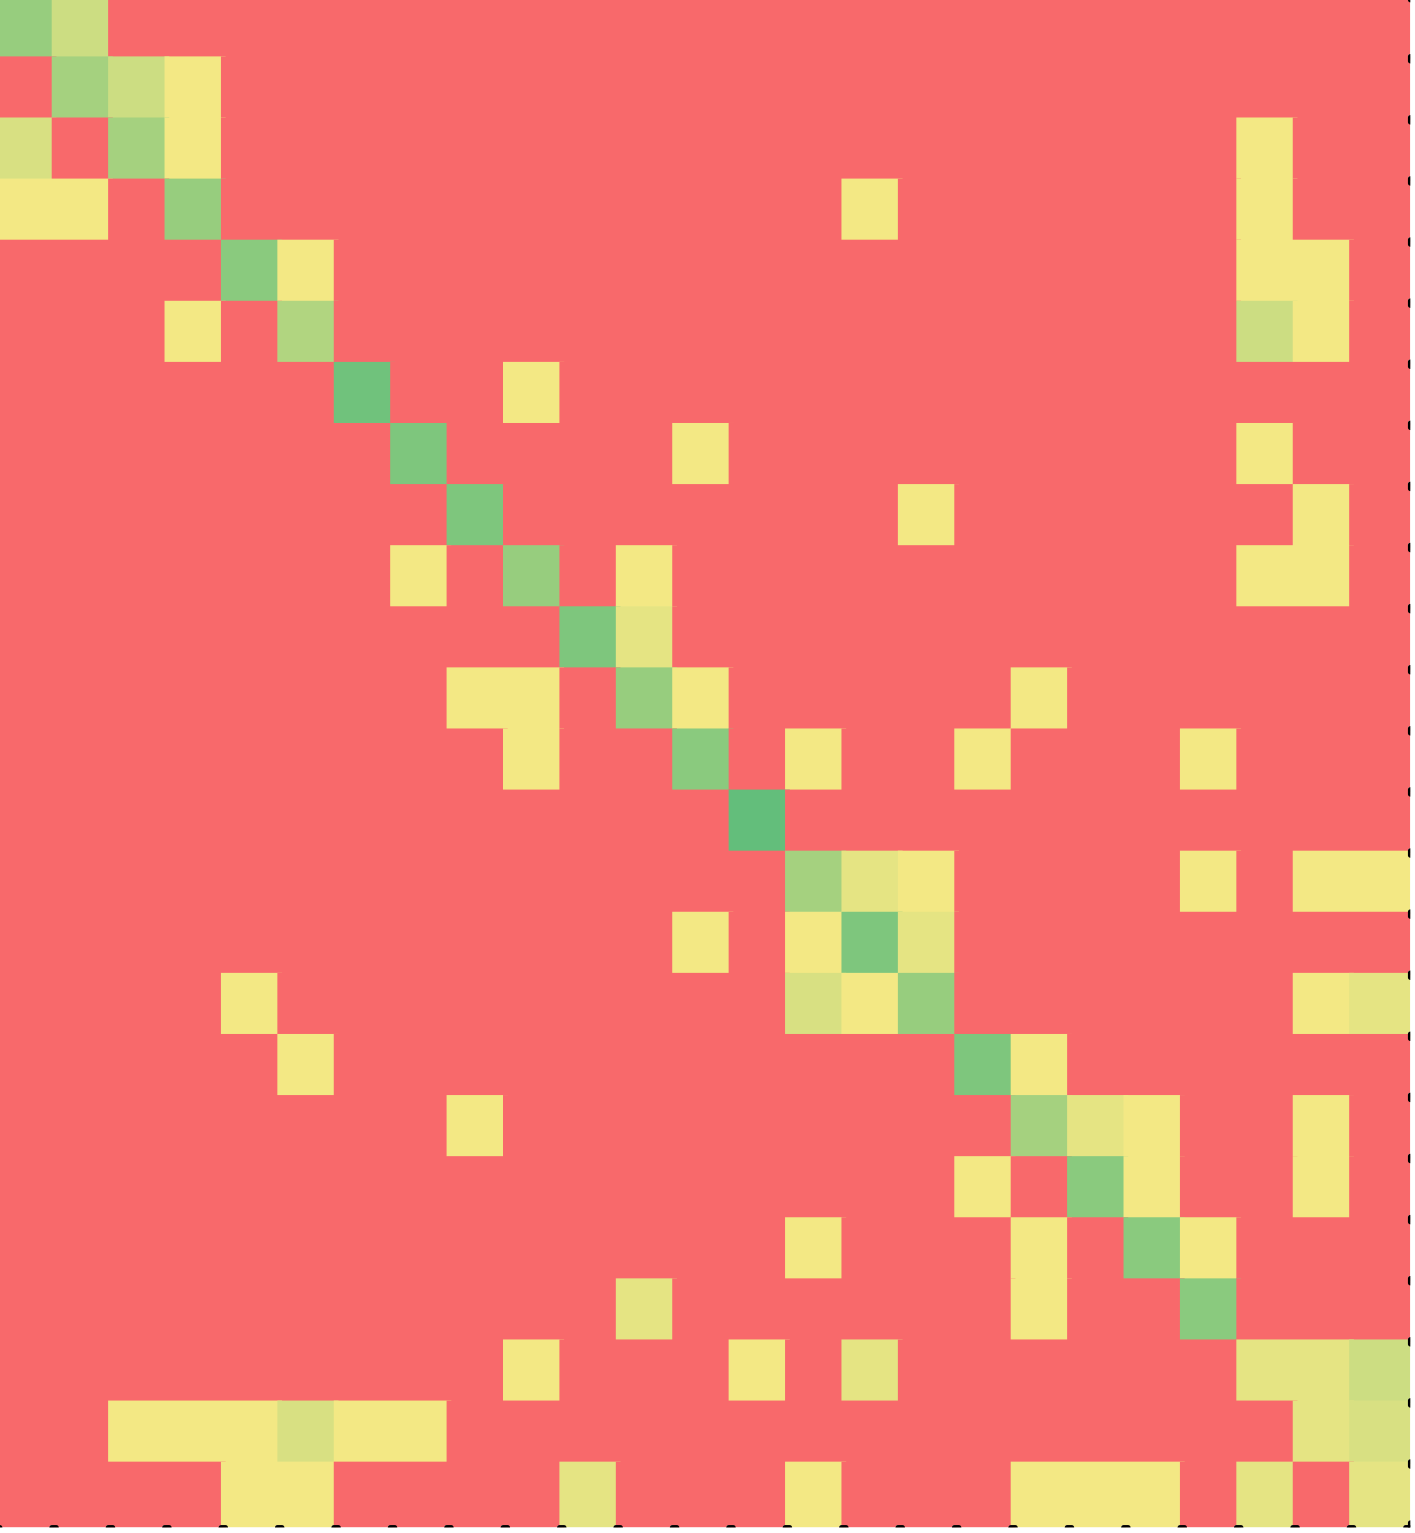
Figure 4 shows the heat map of Java solutions: for non-minimal solutions on the left and minimal solutions on the right. We observe the same two patterns in Java as in C++. The difference between non-minimal and minimal Java solutions was again statistically significant (p < 0.001).
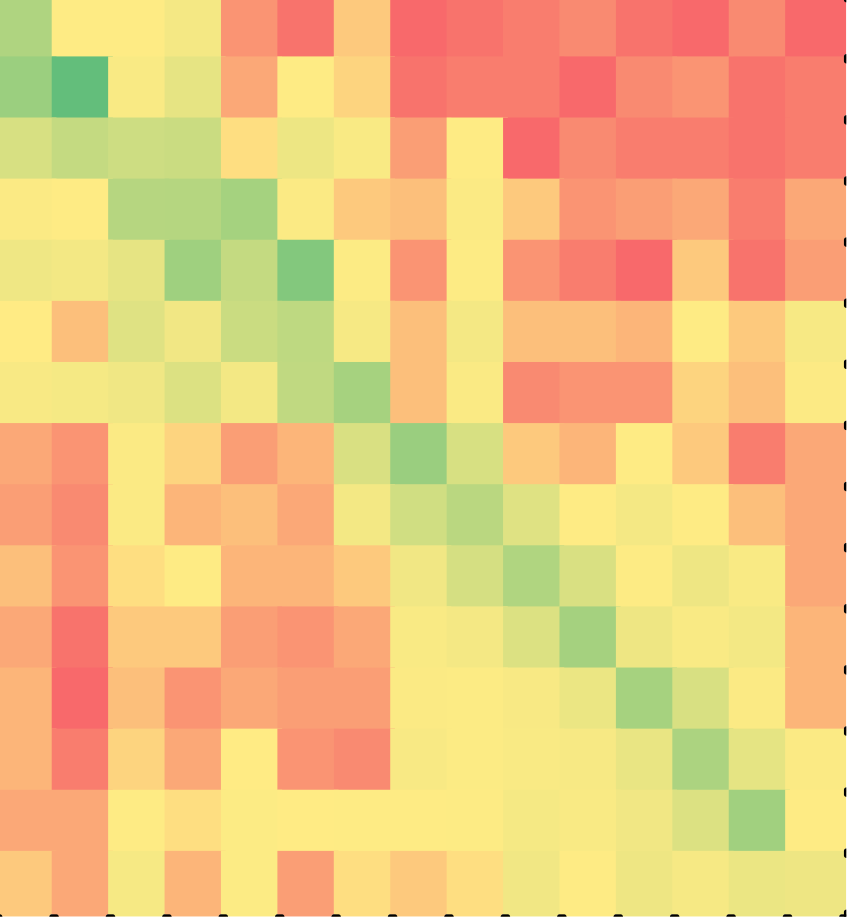
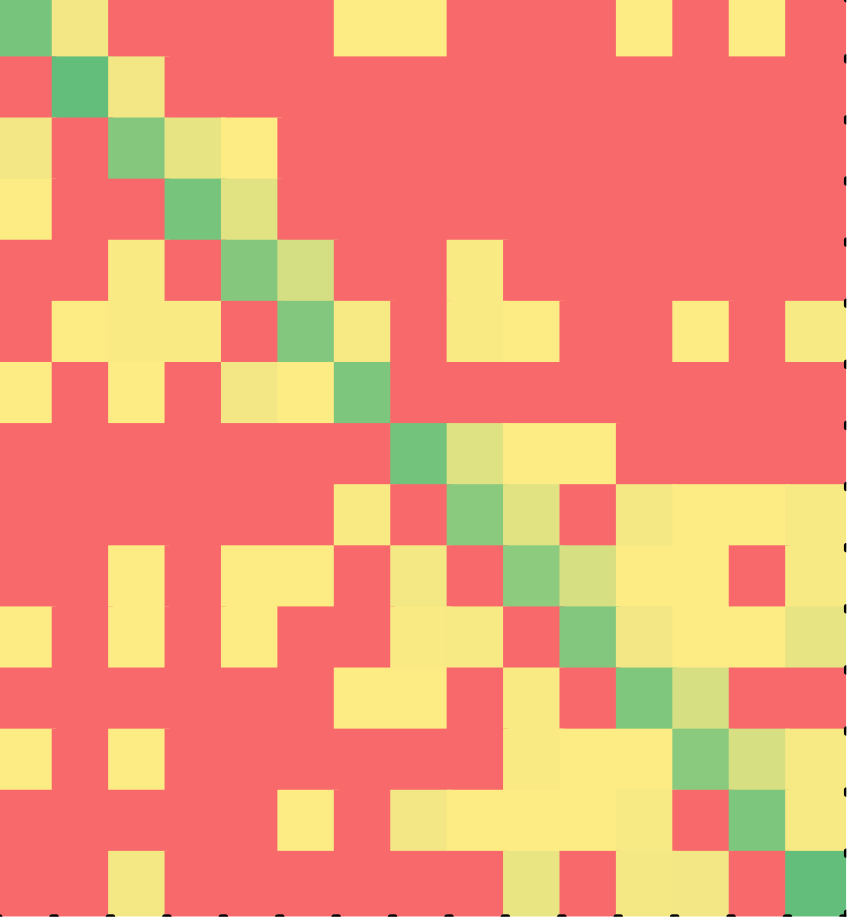
Table 3 lists the descriptive statistics for C++ and Java solutions. The table numerically confirms what is hinted at in the heat maps: minimal solutions were less varied, with fewer first lines (F) and last lines (L). In minimal solutions, students acted on fewer lines out of order, e.g., among C++ solvers, non-zero non-diagonal cells (C) were fewer - 24.3% for minimal versus 88.1% for non-minimal C++ solutions. As could be expected, minimal solutions were more efficient with fewer redundant actions, e.g., among Java solvers, the sum of non-zero non-diagonal cells as a percentage of all the non-zero cells (V) was smaller too - 26% for minimal versus 68.8% for non-minimal Java solutions.
if-else puzzle 1 | C++ (Minimal?) | Java (Minimal?) | ||
|---|---|---|---|---|
No | Yes | No | Yes | |
Sample (N) | 118 | 57 | 237 | 66 |
First line (F) | 10 | 2 | 12 | 6 |
Last line (L) | 13 | 4 | 14 | 7 |
Cells (C) | 88.1% | 24.3% | 96.7% | 35.2% |
Value (V) | 64.4% | 15.4% | 68.8% | 26.0% |
Diagonal (µd) | 0.61 | 0.81 | 0.63 | 0.7 |
In addition, it is evident from Table 3 that C++ solutions were less varied, had fewer lines assembled out of order and were more efficient than Java solutions. Paired samples t-test yielded a statistically significant difference between non-minimal C++ and Java solutions (p < 0.001), but not between minimal C++ and Java solutions.
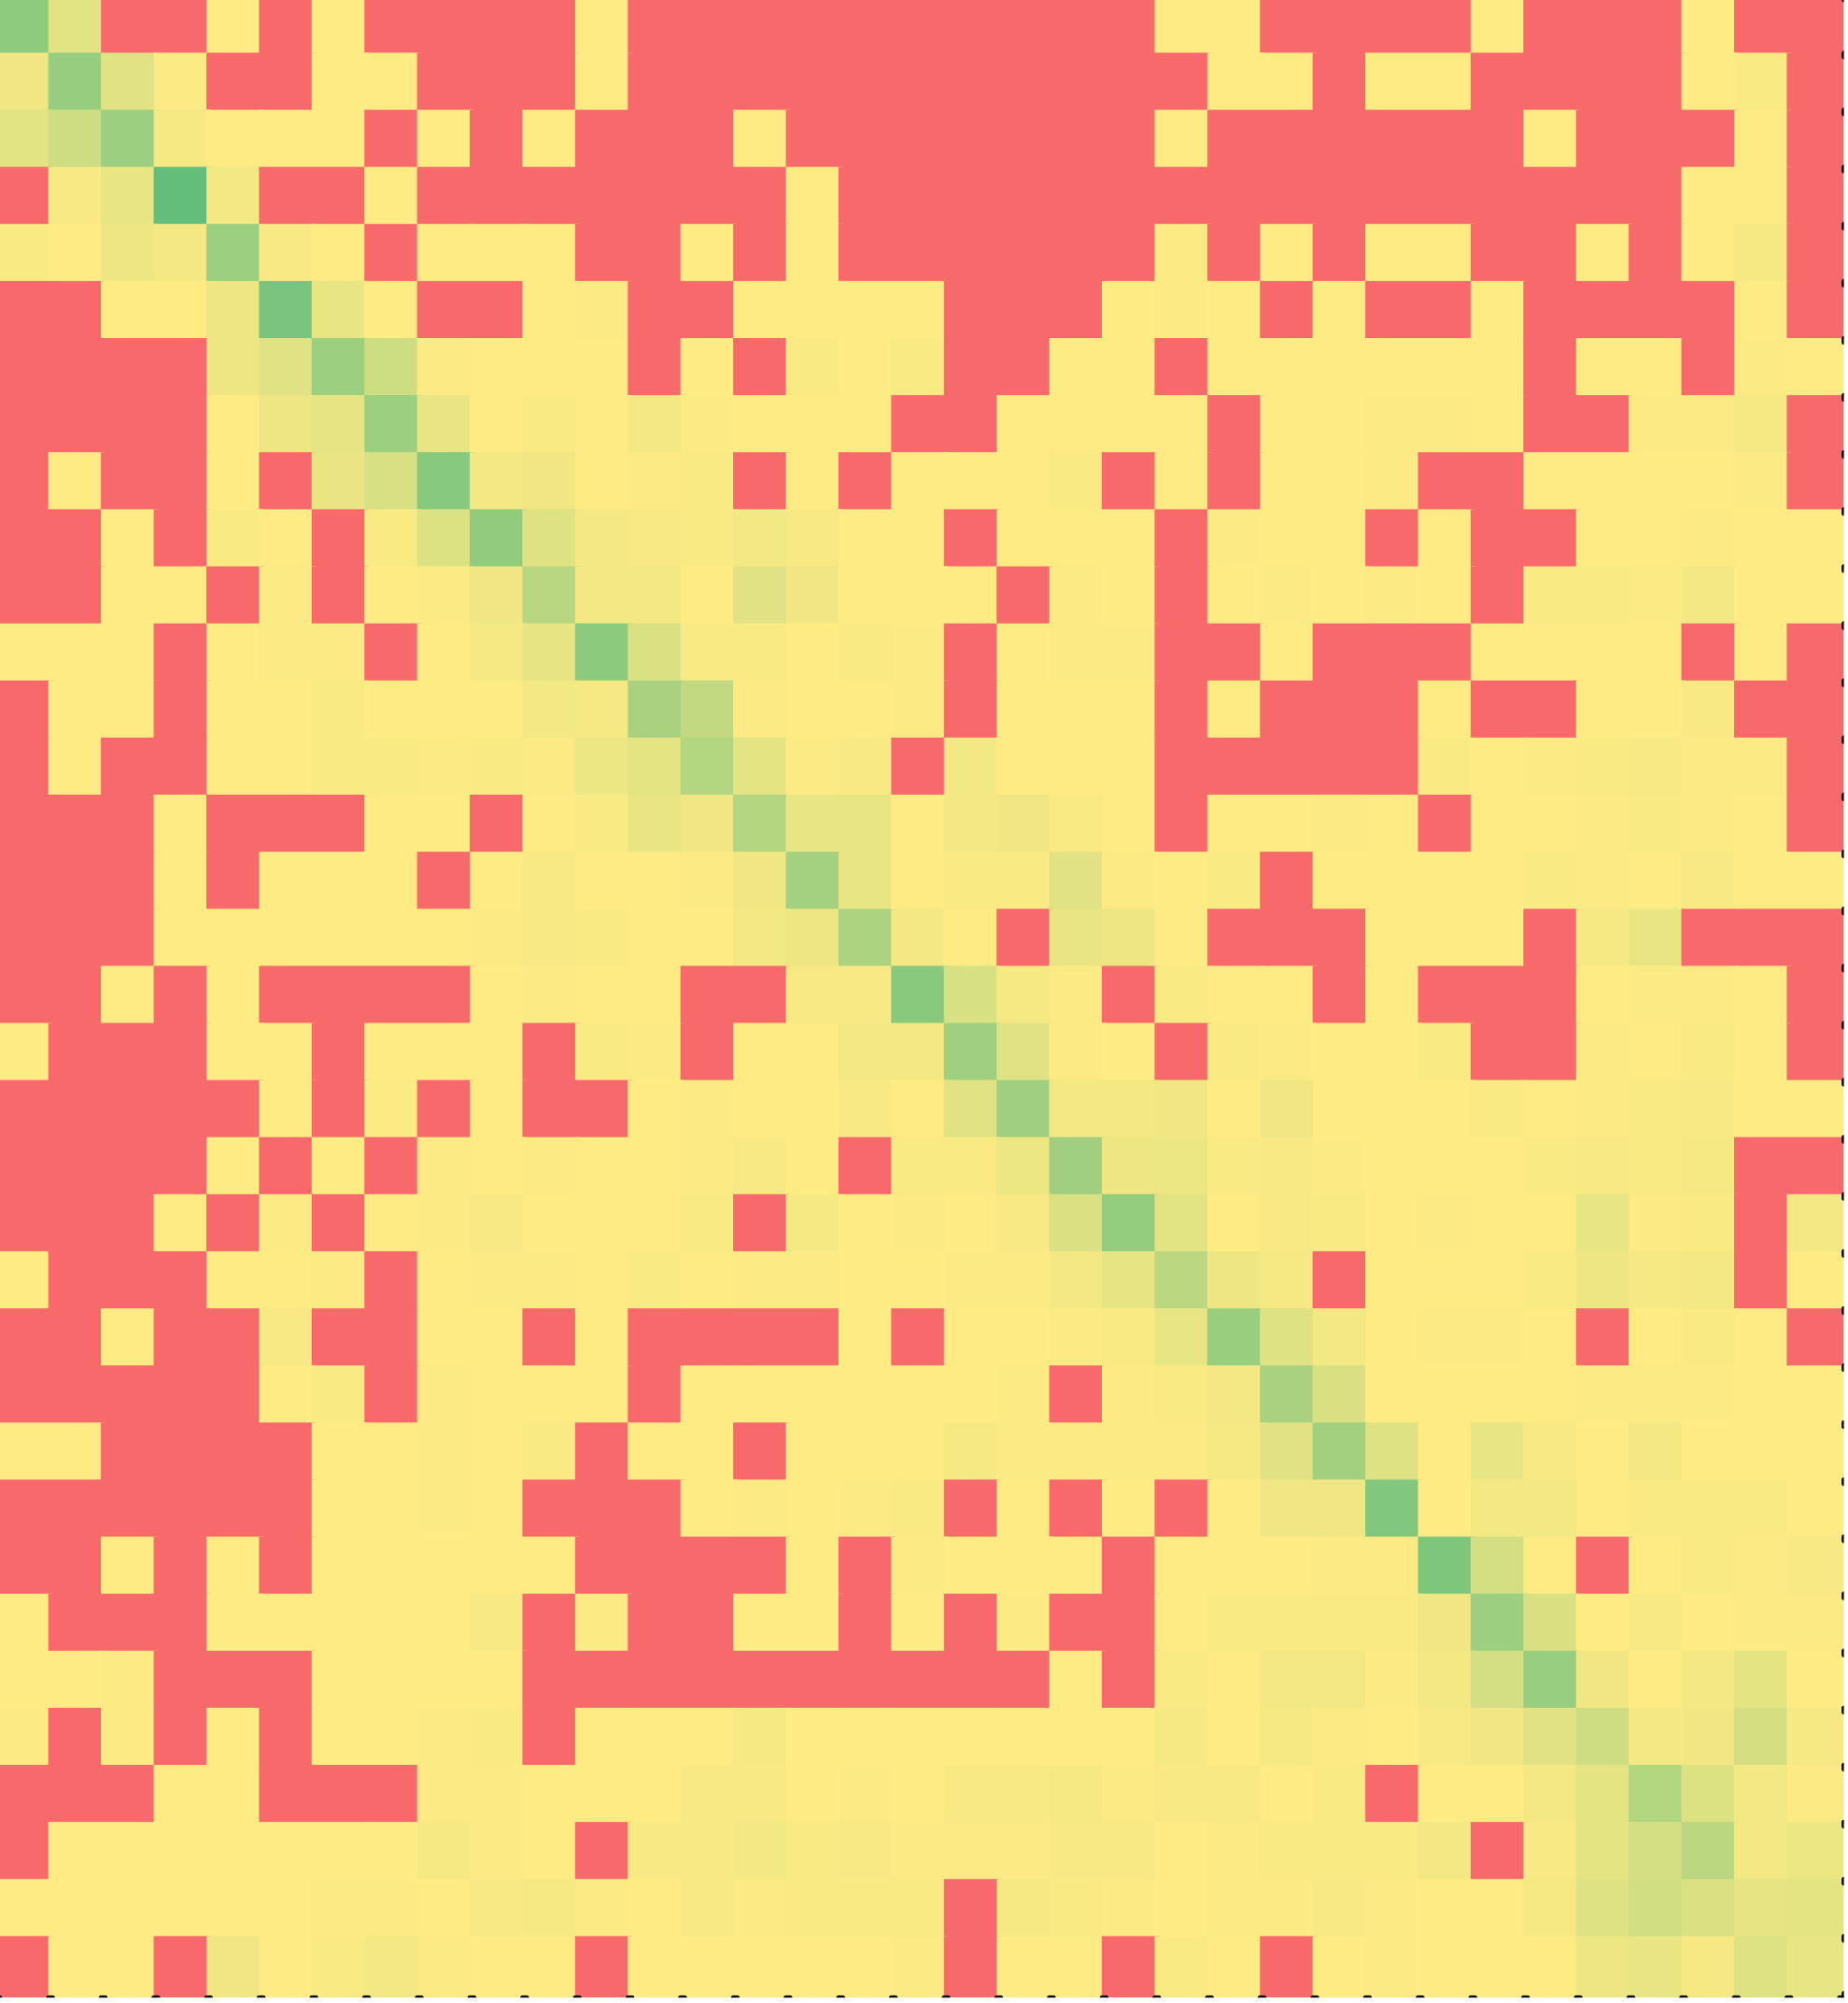
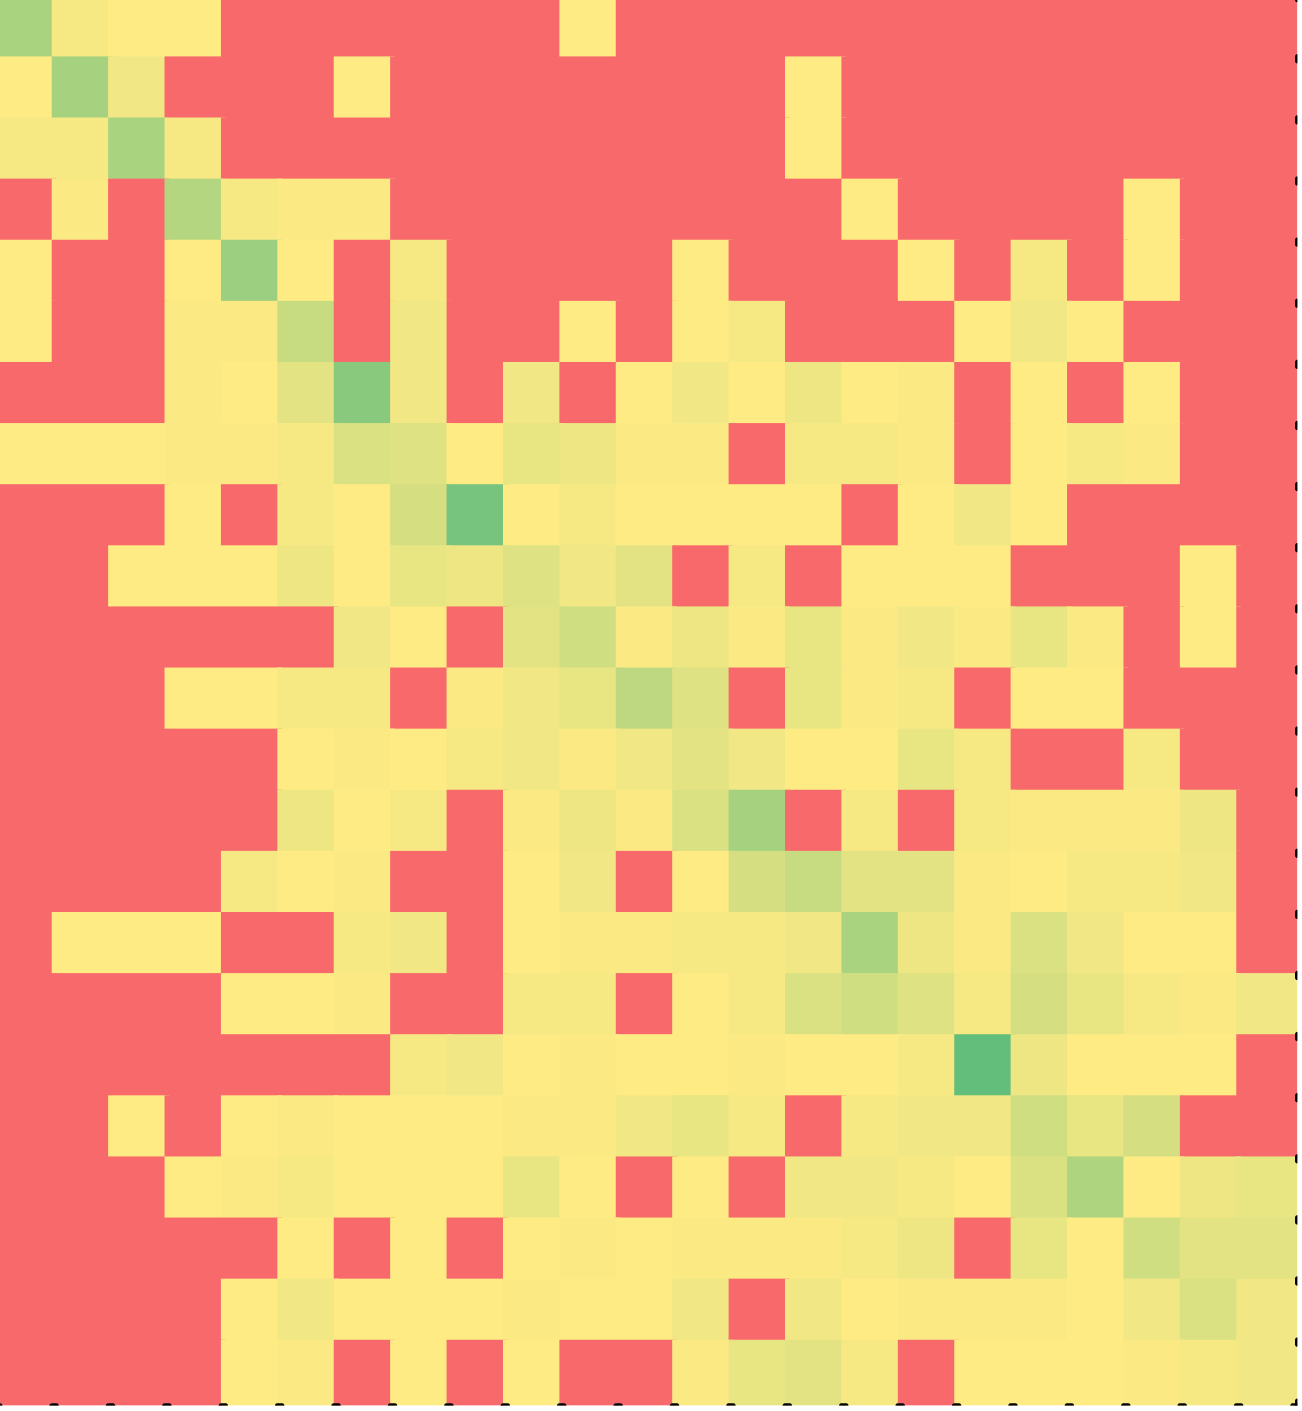
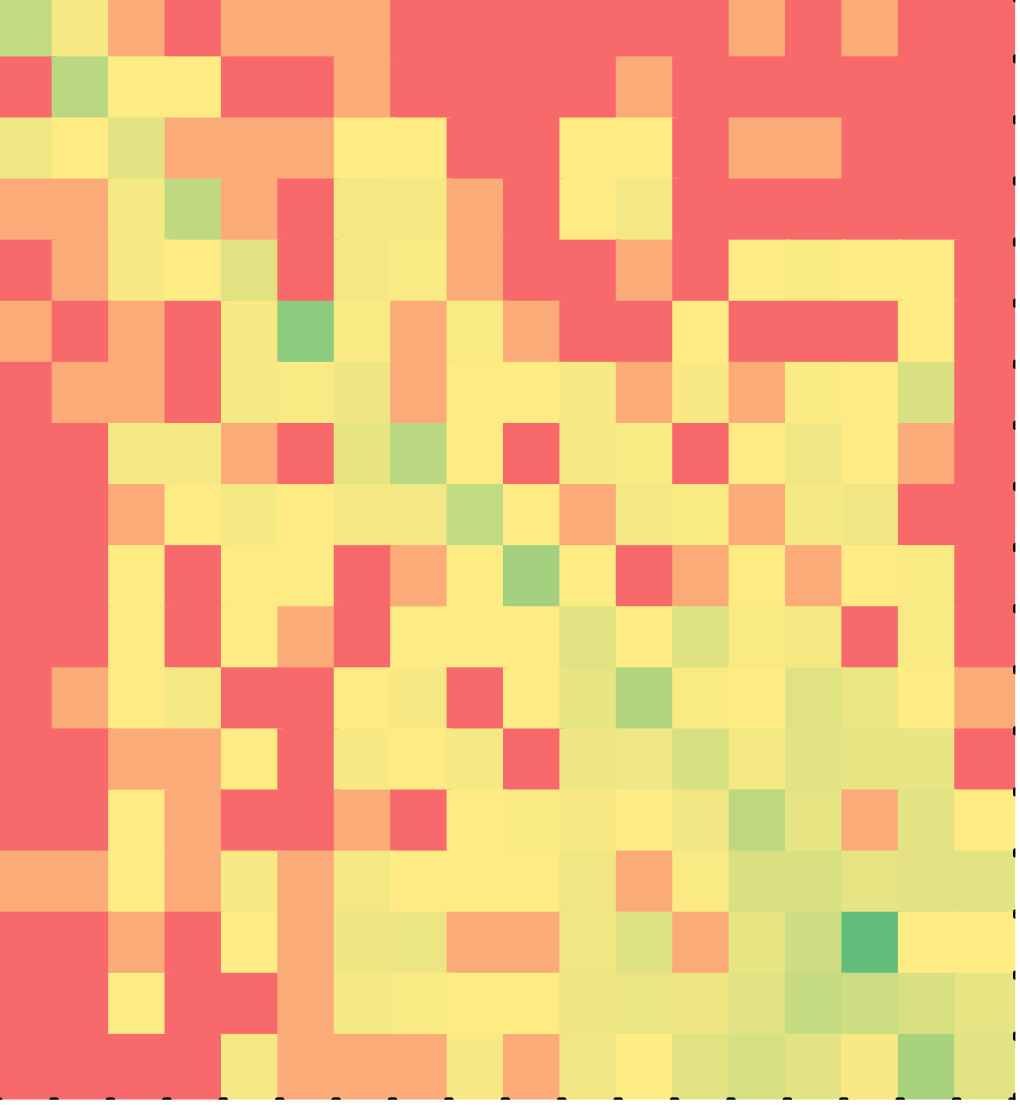
The second puzzle solved by students was on a program to read numerical grade and print the corresponding letter grade. The program contained four levels of nesting of if-else statements. The puzzle contained 34 lines of code and 2 distracters.
The heat maps of C++ solutions are shown in Figure 5 – for non-minimal solutions on the left and minimal solutions on the right. Once again, note that a majority of the students solved the puzzle in the order of the lines in the correct solution. This result is particularly counter-intuitive since the solution contained four levels of nesting of if-else statements. Multiple copies of the same line of code (e.g., else or braces) were treated as interchangeable by the tutor. Yet, assembling nested if-else statements in the order of the lines is no small feat. Balancing the braces of if-clause and else-clause is in itself a difficult task for novice programmers. Yet, a majority of the students chose to reassemble the program in the order in which the lines appear in the correct solution. The difference between non-minimal and minimal C++ solutions was statistically significant (p < 0.001).
if-else puzzle 2 | C++ (Minimal?) | Java (Minimal?) | ||
|---|---|---|---|---|
No | Yes | No | Yes | |
Sample (N) | 89 | 42 | 154 | 28 |
First line (F) | 9 | 2 | 9 | 4 |
Last line (L) | 18 | 12 | 29 | 10 |
Cells (C) | 67.4 | 19.0 | 78.2 | 17.4 |
Value (V) | 64.3 | 38.5 | 70.4 | 37.5 |
Diagonal (µd) | 0.57 | 0.62 | 0.46 | 0.62 |
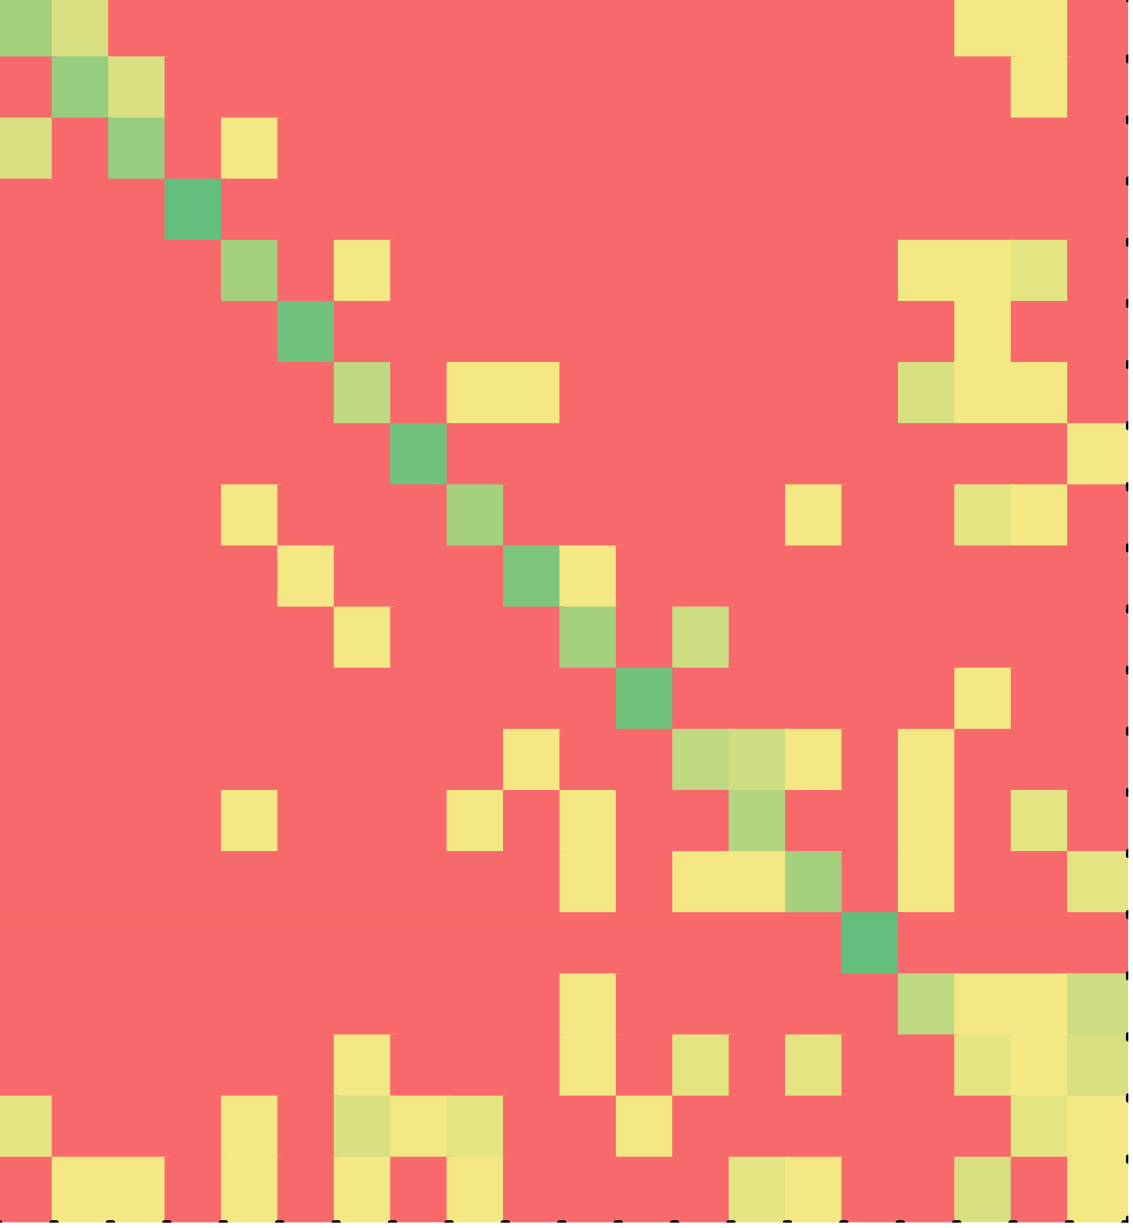
Similarly, the heat maps of Java solutions are shown in Figure 6. Once again, students attempted to solve the puzzle in the order of the lines in the correct solution, minimal solvers much more so. The difference between non-minimal and minimal Java solutions was statistically significant (p < 0.001).
The descriptive statistics are shown in Table 4. The difference between C++ and Java was not statistically significant for non-minimal or minimal solutions.
while loop puzzles
The first puzzle solved by students was on a program to read numbers till the same number appeared back to back. The program printed the first number to appear twice back to back. The puzzle contained 13 lines of code and 2 distracters.


while puzzle 1 | C++ (Minimal?) | Java (Minimal?) | ||
|---|---|---|---|---|
No | Yes | No | Yes | |
Sample (N) | 48 | 44 | 78 | 42 |
First line (F) | 5 | 2 | 5 | 2 |
Last line (L) | 8 | 5 | 6 | 6 |
Cells (C) | 73.1 | 32.4 | 80.8 | 29.1 |
Value (V) | 62.5 | 33.1 | 62.9 | 23.0 |
Diagonal (µd) | 0.56 | 0.6 | 0.62 | 0.7 |
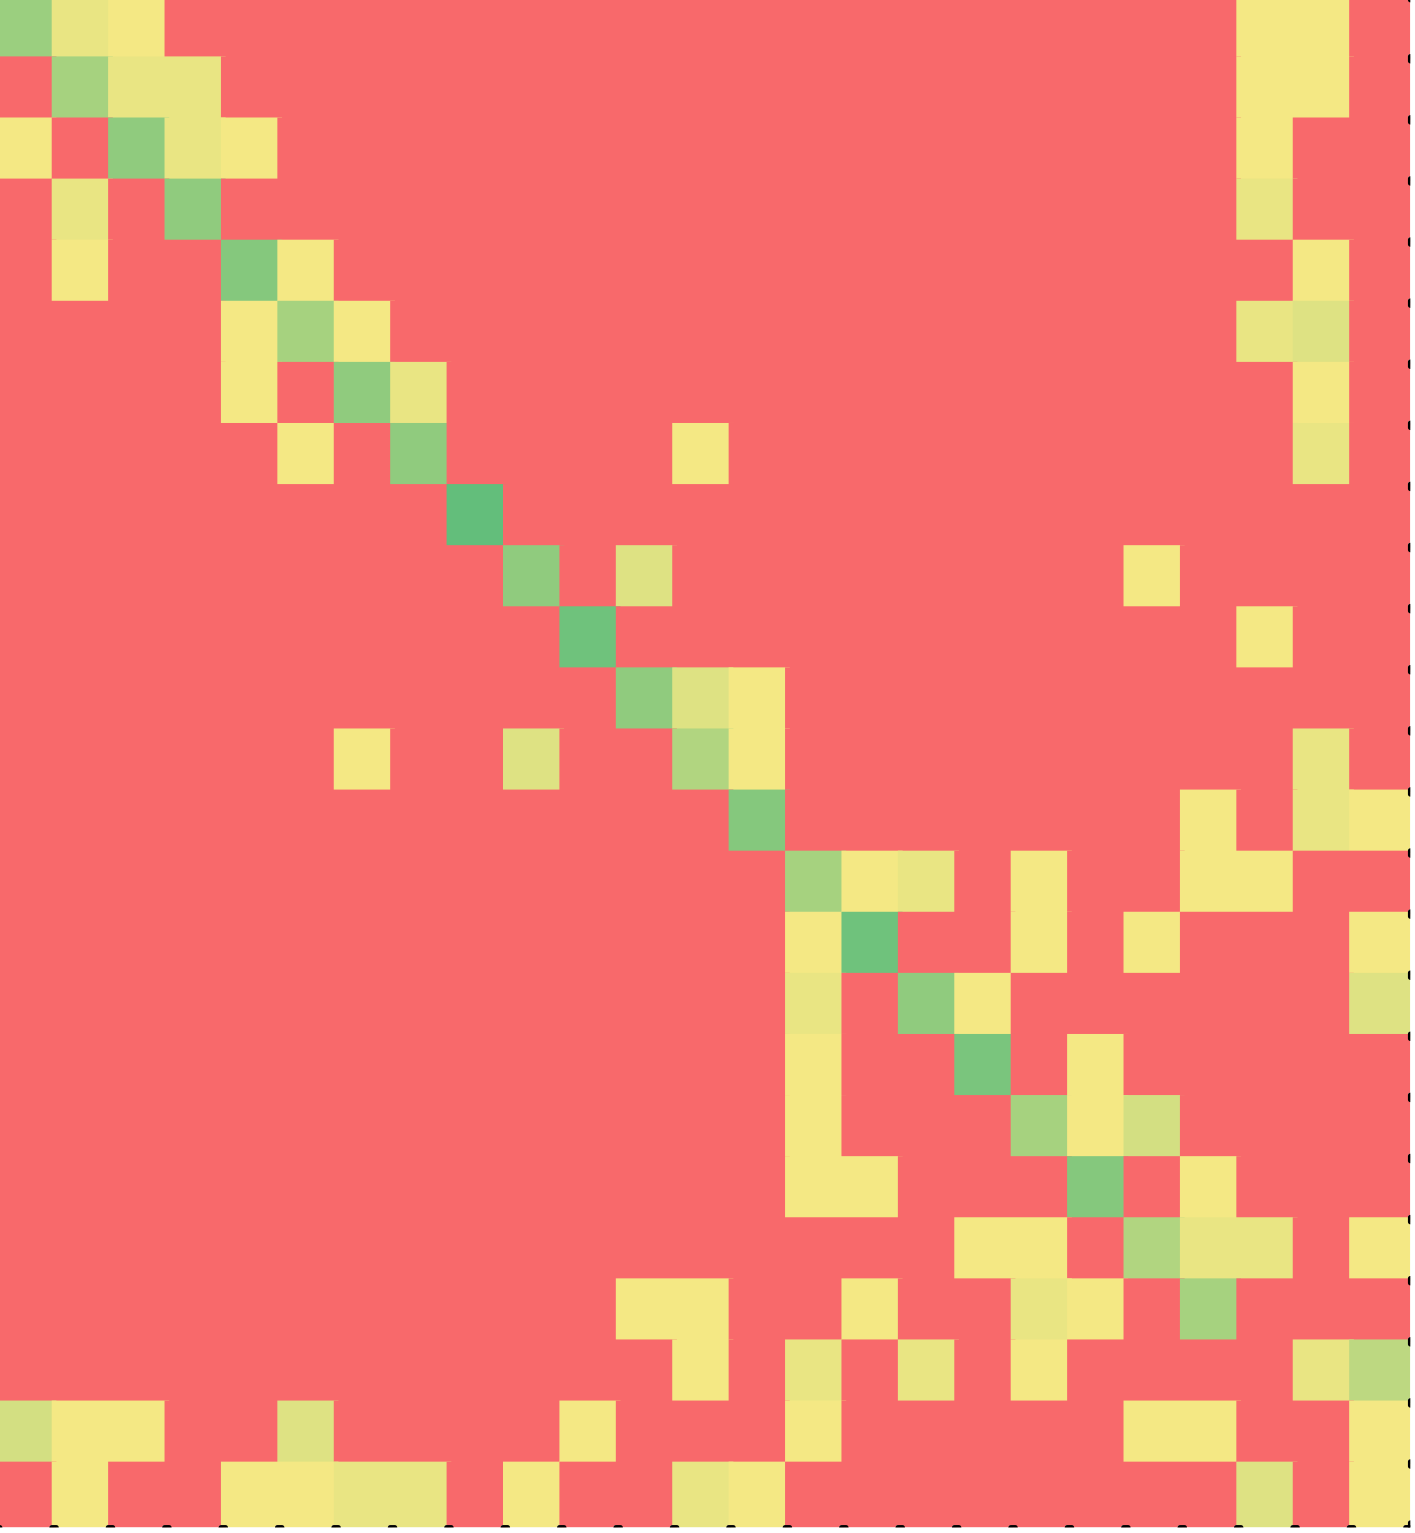
The heat maps of C++ and Java solutions are shown in Figures 7 and 8 respectively. In both of the languages, students solved the puzzle in the correct order of lines, minimal solvers much more so. The difference between non-minimal and minimal solutions was statistically significant for both C++ (p < 0.001) and Java (p < 0.001). The difference between non-minimal C++ and Java solutions was statistically significant at p = 0.1 level, but not the difference between minimal C++ and Java solutions. Table 5 lists the descriptive statistics for all four cases.
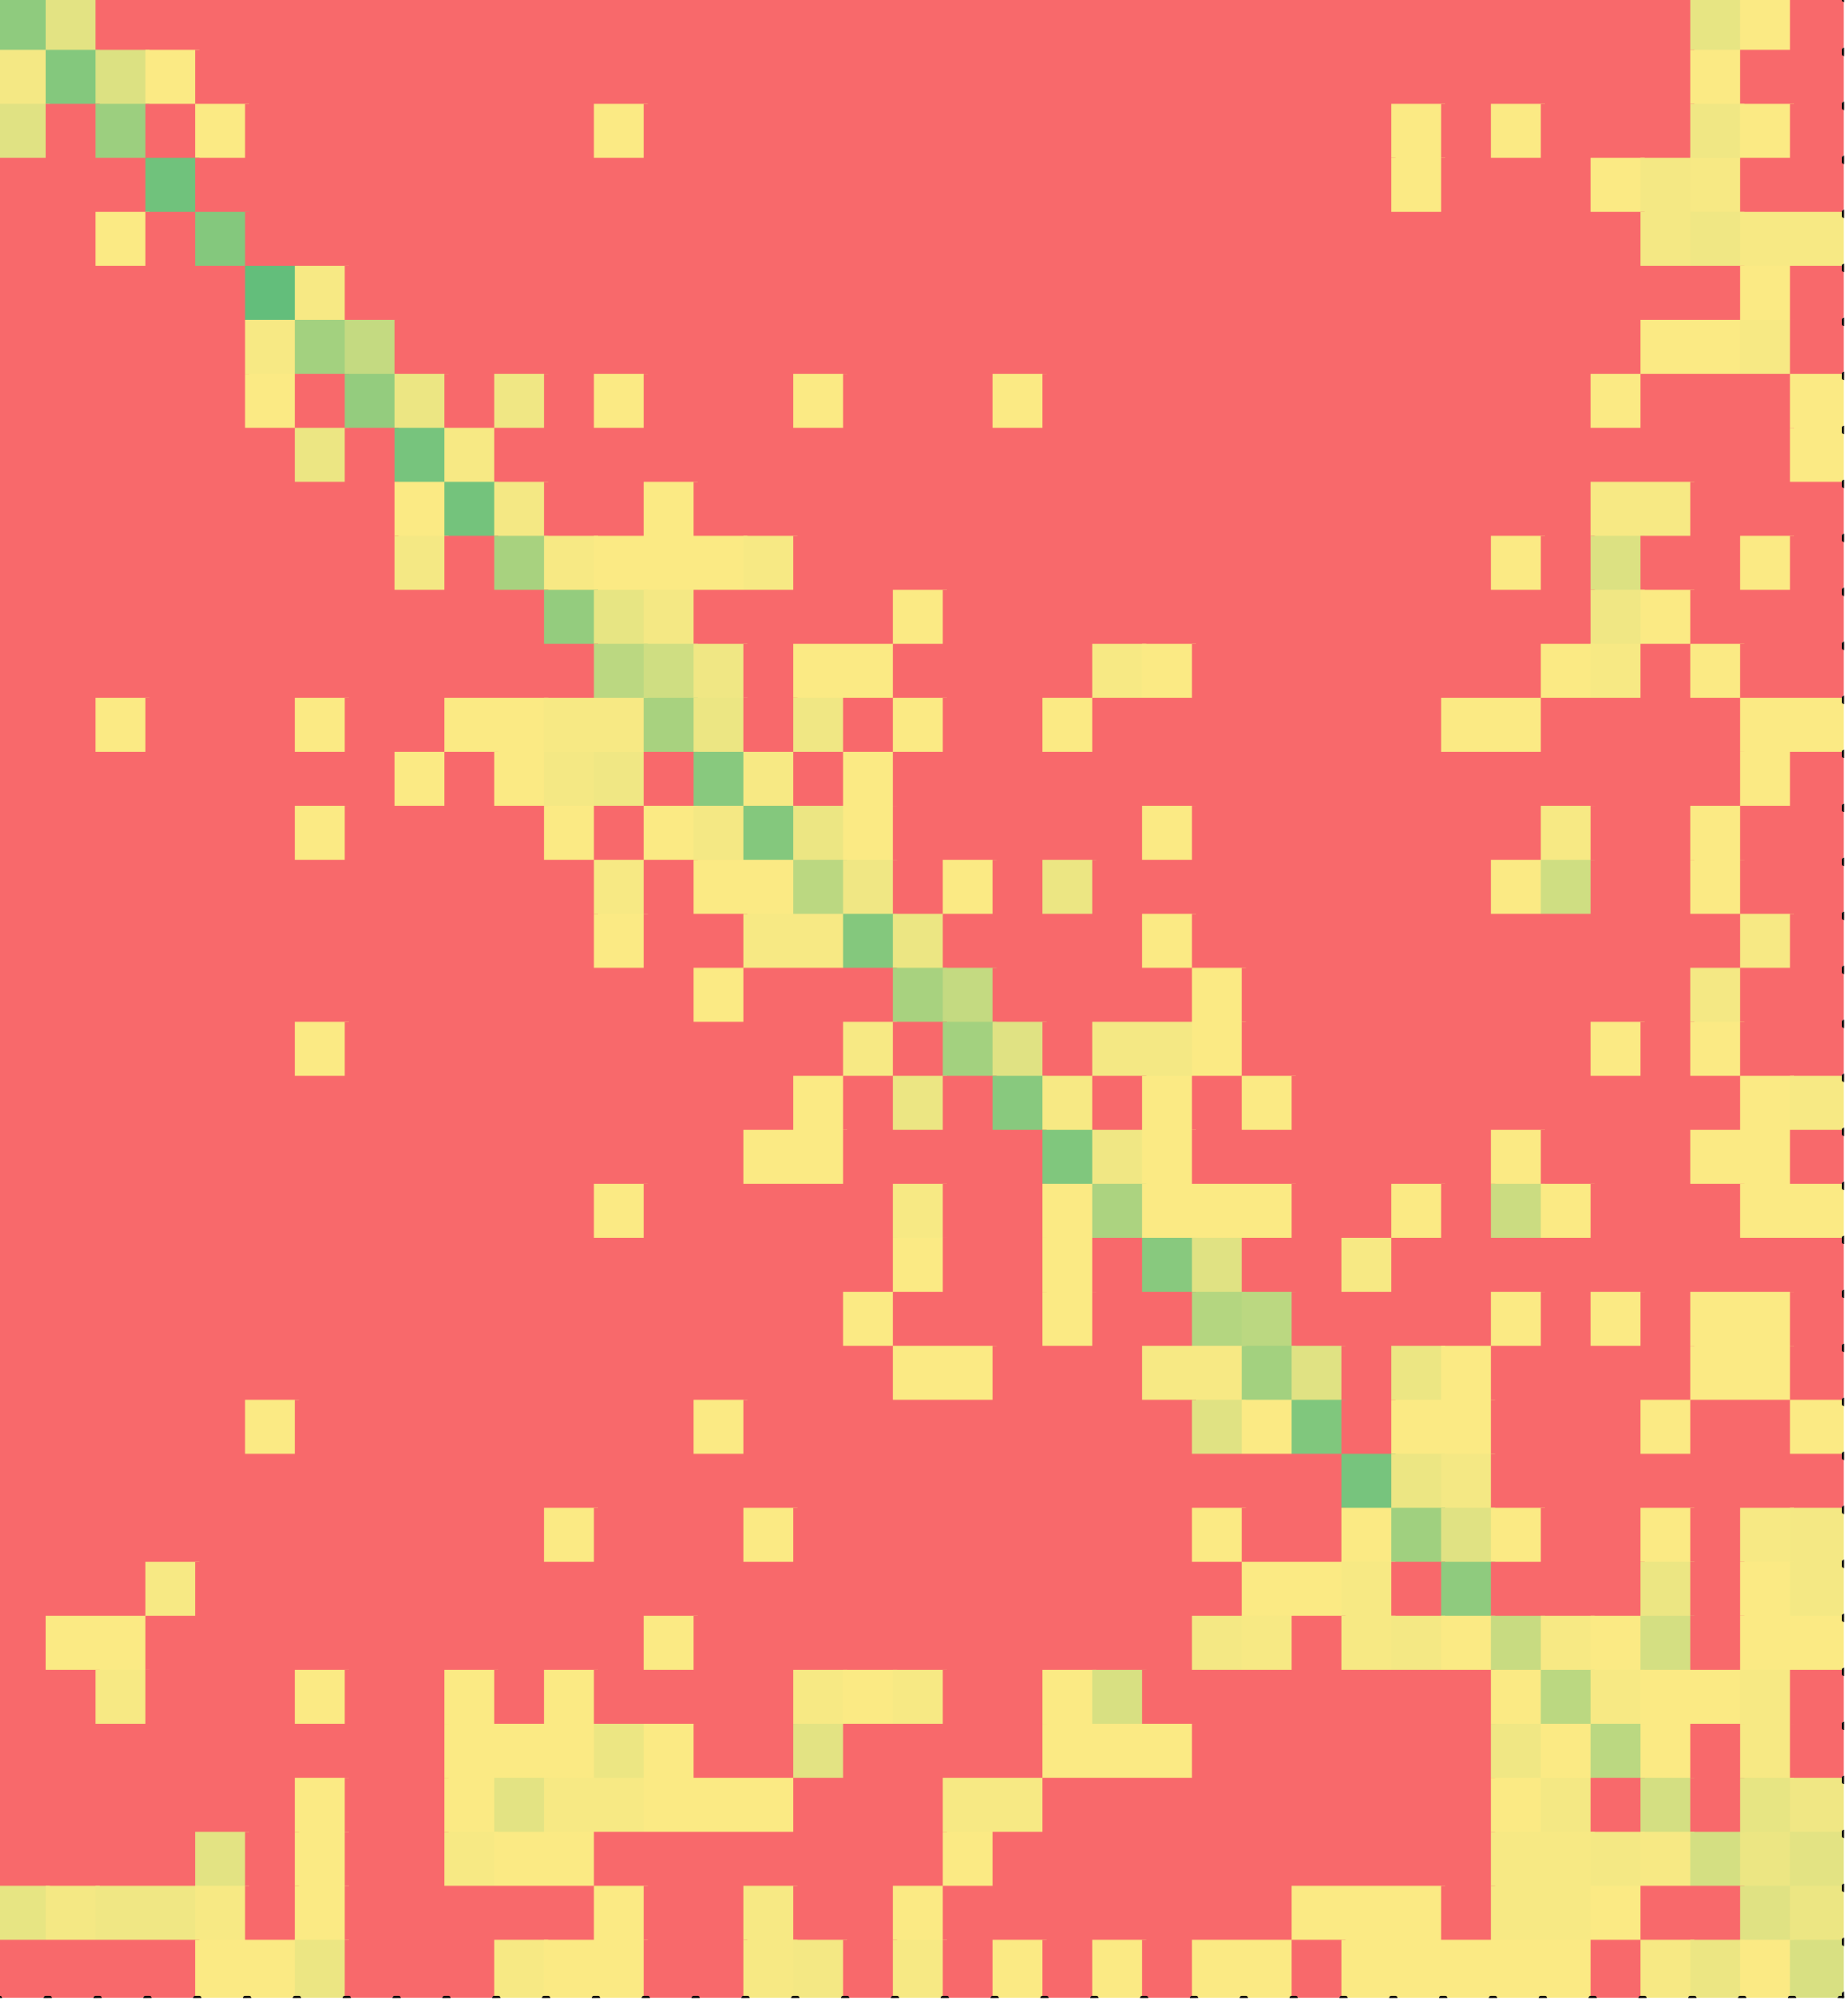
The second puzzle solved by the students was on a program to input the face of a card followed by cards in a deck. It prints the number of cards into the deck where it finds the first card, and prints the face of the subsequent card in the deck. The program contained two back-to-back while loops. The puzzle contained 22 lines of code and 2 distracters.
The tutors were set up to conduct a controlled experiment on whether using mnemonic variable names affected how efficiently students solved the puzzles [13]. Some schools received a version of the puzzle with mnemonic variable names whereas others received a version with single-character variable names. Since the C++ sample size was larger for the single-character version of the puzzle and Java sample size was larger for the mnemonic version of the puzzle, we used data from those respective versions for comparison.
The pattern of students solving puzzles in the correct order of lines is again evident from Figures 9 (of C++ solutions of single-character version of the puzzle) and 10 (of Java solutions of mnemonic version of the puzzle). Quite counter-intuitively, minimal solvers rarely straggled back and forth between the two while loops, i.e., picked a line in the first loop followed by a line in the second loop or vice versa. Descriptive statistics are listed in Table 6. The difference between non-minimal and minimal solutions was statistically significant for both of the languages (p < 0.001).
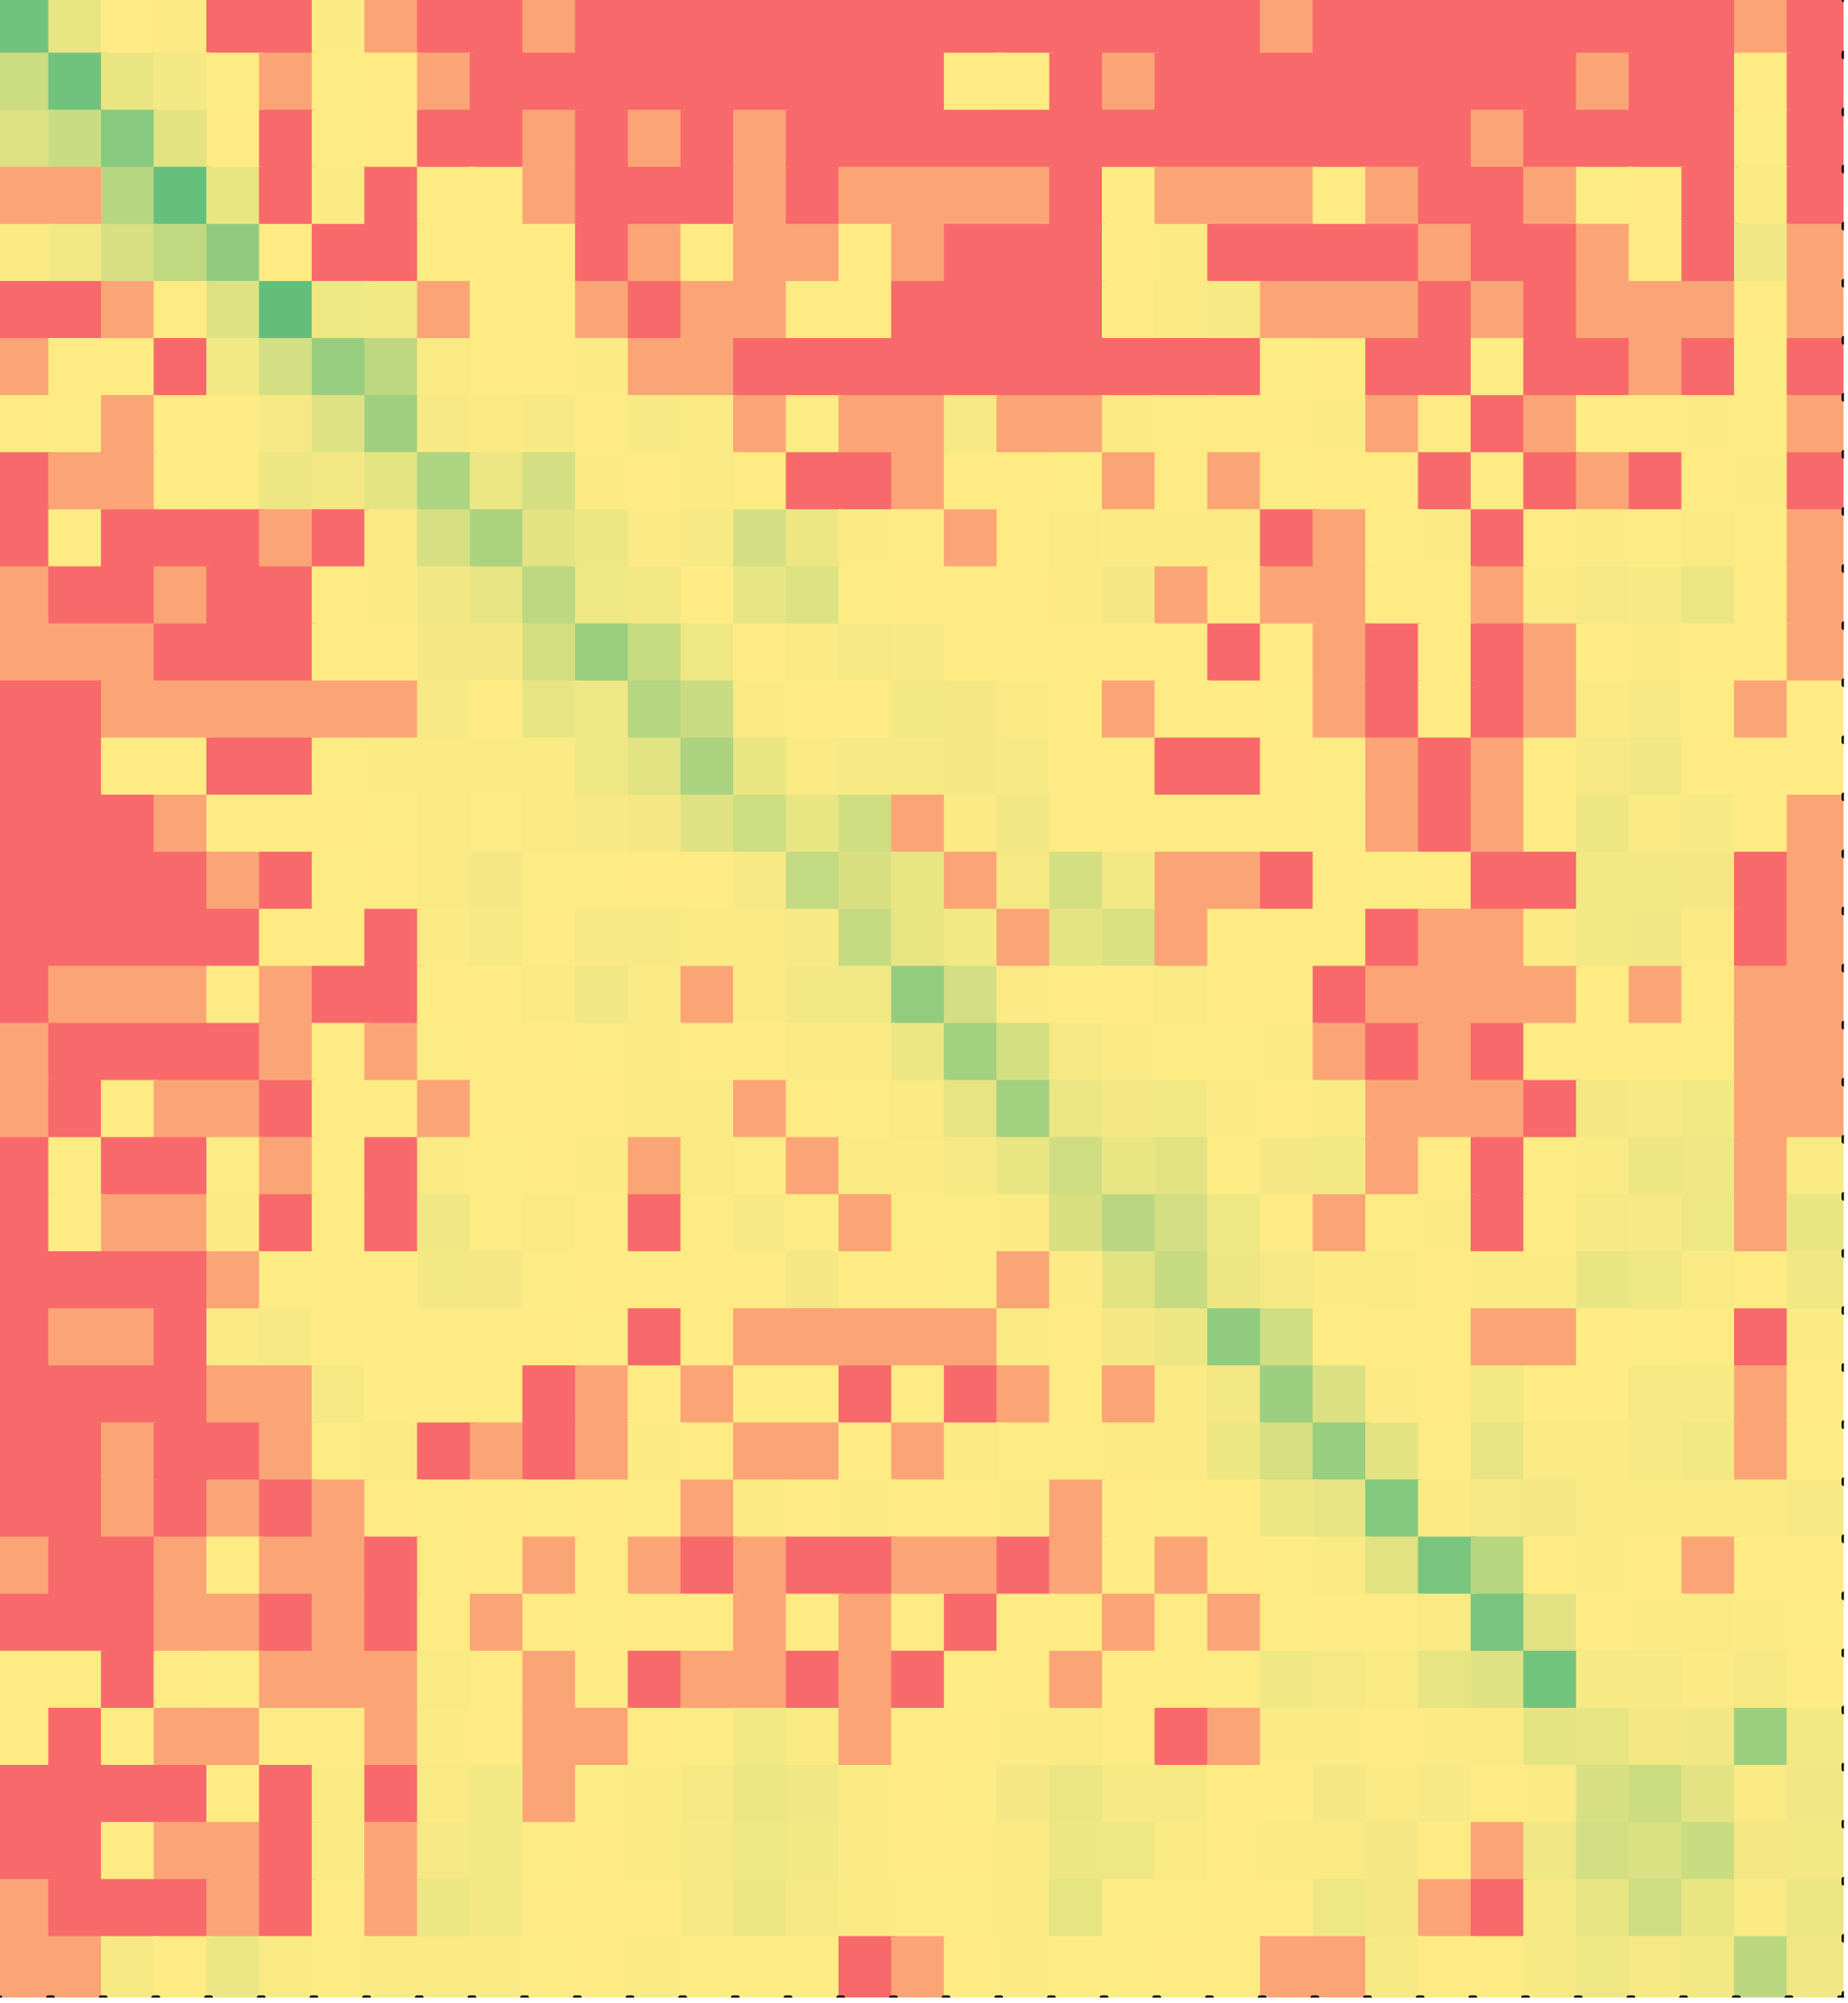
The third puzzle solved by the students was on a program to repeatedly read a positive number, read additional numbers till its multiple is found, and print the number and its multiple. It did this until 0 or a negative value was input for the first number. The program contained nested while loops. The puzzle contained 17 lines of code and 2 distracters.
Figures 11 (C++) and 12 (Java) once again show that a majority of the students solved the puzzles in the correct order of the lines in the solution, even though the puzzle involved nested while loops. Nested while loops are particularly hard for novice programmers to read or write. So, it is counter-intuitive that students would assemble the lines in the order in which they appear in the correct solution.
while puzzle 2 | C++ - single-char (Minimal?) | Java – mnemonic (Minimal?) | ||
|---|---|---|---|---|
No | Yes | No | Yes | |
Sample (N) | 27 | 14 | 50 | 12 |
First line (F) | 5 | 3 | 7 | 2 |
Last line (L) | 5 | 5 | 7 | 3 |
Cells (C) | 55.9 | 11.3 | 66.4 | 9.9 |
Value (V) | 68.1 | 26.3 | 69.4 | 25.4 |
Diagonal (µd) | 0.58 | 0.7 | 0.55 | 0.71 |

while puzzle 3 | C++ (Minimal?) | Java (Minimal?) | ||
|---|---|---|---|---|
No | Yes | No | Yes | |
Sample (N) | 44 | 12 | 48 | 11 |
First line (F) | 8 | 2 | 2 | 1 |
Last line (L) | 6 | 4 | 6 | 2 |
Cells (C) | 67.0 | 11.4 | 71.6 | 4.3 |
Value (V) | 67.8 | 27.9 | 66.7 | 7.7 |
Diagonal (µd) | 0.58 | 0.66 | 0.57 | 0.85 |
The descriptive statistics are shown in Table 7. The difference between non-minimal and minimal solutions was statistically significant for both C++ and Java (p < 0.001). The difference between C++ and Java was not statistically significant in either case: non-minimal or minimal solutions. A confounding factor of this comparison is that the number of minimal solvers is small for both C++ and Java.
Discussion
We presented the results of analyzing the data of five different puzzles – involving a single if-else statement, nested if-else statements, a single while loop, multiple while loops and nested while loops. The answer to our research question RQ1 is that in every case, a majority of the students solved the puzzle in the order of the lines of code in the correct solution, as illustrated by the diagonals in heat maps. Students who solved the puzzles with the fewest actions did so by acting upon fewer lines out of order and less often.
An earlier study had used think-aloud protocols to find that experts solved Parsons puzzles [11] by first assembling the majority of the control flow, followed by initialization of variables and handling of corner cases. This was referred to as top-down strategy. In a similar vein, when writing control statements, novices are advised to write the frame of the control statement first and then, proceed to fill in the details [26]. We had hoped to find that at least minimal solvers used such strategies.
Instead, at each step, students seem to have asked themselves “where in the scrambled code can I find the next line of the solution?” instead of “where should the next scrambled line be placed in the solution?” or “how would I write this solution based on top-down thinking and frame-first coding?” They assembled code in the order in which it appears in the program, not the order in which it is written by a programmer who follows top-down decomposition of the problem. This is the difference between the product and the process. The order in which code segments are written in a program is dictated by the process of programming and is not necessarily the order in which the code segments eventually appear in the program, i.e., the product of programming. The process is influenced by both semantics (top-down design [11]) and syntax (frame-first programming [26]). Educators want novices to learn the process of programming, not the product, since the product, i.e., the program for a given problem is not unique. Researchers have found that the process used by novices for programming is a better predictor of their course grade than the actual programs written by them [29]. Besides, product follows process – the more disciplined the process, the better the programming product. So, for a novice learning to write programs, the focus should be on the process of programming and not the product. Unfortunately, in programming, one cannot learn the process by looking at the product – all the process information is lost by the time a program is completed [30]. So, the fact that a majority of the students solve Parsons puzzles by focusing on the product rather than reconstructing the process of programming does not bode well for Parsons puzzles as a tool for learning programming. Parsons puzzle tutors designed to help students learn programming must actively prompt and scaffold novices to reconstruct the process of programming when solving the puzzles.
Yet, scores on Parsons puzzles were found to correlate with scores on code-writing exercises [2]. An explanation for this correlation is that just as they assemble Parsons puzzles, students write programs line by line in the order in which the lines appear in the program, i.e., their process mirrors the product. Writing a program line by line in this manner is difficult because it entails significant cognitive load, e.g., when writing the statements in a nested loop, the programmer must actively keep track of the nested loop, the nesting loop and any variables previously declared in the program. Experts seldom write code in this manner, instead resorting to top-down and frame-first strategies. This naïve approach to writing code may explain why attrition in introductory programming courses remains unacceptably high [34, 35]. Configuring Parsons puzzle tutors to proactively enforce top-down and frame-first coding maybe one way to use Parsons puzzles to help students learn effective processes of programming rather than developing their own ineffective processes.
Earlier researchers have reported that C++ students used semantics more than Java students while solving Parsons puzzles [23] and that the learning curve associated with learning object-oriented programing in Java is steeper compared to learning imperative programming in C++ [22]. This may be why we found significant difference between non-minimal C++ and Java solutions on the first problems in both the tutors (our research question RQ2), In both the cases, Java students used more out-of-order and redundant actions to solve Parsons puzzles than C++ students. This finding would benefit from replication in a more controlled environment.
One confounding factor of our study is that the algorithm was provided as comments in the solution panel S (Figure 1) for each program. Students may have followed these comments from top down to assemble the program from the first to the last line. Then again, the presence of comments should have freed students to assemble the different commented sections of the program in an opportunistic manner, not necessarily from the first to the last section. Other researchers have noted that such subgoal labels make it easier for students to solve Parsons puzzles [20], but do not address the influence of comments on how students go about solving Parsons puzzles.
In our analysis, we considered only line numbers in action sequence, the sequence of
In our analysis, we considered only complete and correct solutions. Analyzing incomplete and incorrect solutions may yield patterns in puzzle-solving behavior that unearth common misconceptions among programming students.
We presented Markov matrices as a technique for finding patterns in Parsons puzzle solutions and used heat maps to visualize the results. An added benefit of using Markov matrix is that we can use higher order matrices (obtained by multiplying a Markov matrix by itself) to answer questions such as how quickly after assembling an open brace do students get around to assembling its matching closing brace in a program, a question of interest in frame-first [26] coding.
Knowing how students solve Parsons puzzles can help us understand how they can be improved for that purpose. We hope our discussion in this section contributes towards these efforts. We plan to continue to collect data from additional tutors and analyze the problem-solving patterns used by students in those tutors to see if the same patterns are repeated.
ACKNOWLEDGMENTS
Partial support for this work was provided by the National Science Foundation under grants DUE-1502564 and DUE-2142648.
REFERENCES
- Nick Cheng and Brian Harrington. 2017. The Code Mangler: Evaluating Coding Ability Without Writing any Code. In Proceedings of the 2017 ACM SIGCSE Technical Symposium on Computer Science Education (SIGCSE '17). ACM, New York, NY, USA, 123-128. DOI: https://doi.org/10.1145/3017680.3017704.
- Paul Denny, Andrew Luxton-Reilly, and Beth Simon. 2008. Evaluating a new Exam Question: Parsons Problems. In Proceedings of the Fourth International Workshop on Computing Education Research (ICER '08). ACM, New York, NY, USA, 113-124. DOI=http://dx.doi.org/10.1145/1404520.1404532.
- Yuemeng Du, Andrew Luxton-Reilly, and Paul Denny. 2020. A Review of Research on Parsons Problems. In Proceedings of the Twenty-Second Australasian Computing Education Conference (ACE'20). Association for Computing Machinery, New York, NY, USA, 195–202. DOI:https://doi.org/10.1145/3373165.3373187
- Barbara J. Ericson, James D. Foley, and Jochen Rick. 2018. Evaluating the Efficiency and Effectiveness of Adaptive Parsons Problems. In Proceedings of the 2018 ACM Conference on International Computing Education Research (ICER '18). ACM, New York, NY, USA, 60-68. DOI: https://doi.org/10.1145/3230977.3231000
- Barbara J. Ericson, Mark J. Guzdial, and Briana B. Morrison. 2015. Analysis of Interactive Features Designed to Enhance Learning in an Ebook. In Proceedings of the eleventh annual International Conference on International Computing Education Research (ICER '15). ACM, New York, NY, USA, 169-178. DOI: https://doi.org/10.1145/2787622.2787731.
- Barbara J. Ericson, Lauren E. Margulieux, and Jochen Rick. 2017. Solving Parsons Problems Versus Fixing and Writing Code. In Proceedings of the 17th Koli Calling International Conference on Computing Education Research (Koli Calling '17). ACM, New York, NY, USA, 20-29. DOI: https://doi.org/10.1145/3141880.3141895.
- Barbara Ericson, Austin McCall, and Kathryn Cunningham. 2019. Investigating the Affect and Effect of Adaptive Parsons Problems. In Proceedings of the 19th Koli Calling International Conference on Computing Education Research (Koli Calling '19). Association for Computing Machinery, New York, NY, USA, Article 6, 1–10. DOI:https://doi.org/10.1145/3364510.3364524
- Geela Fabic, Antonija Mitrovic, Kourosh Neshatian. Towards a Mobile Python Tutor: Understanding Differences in Strategies used by Novices and Experts. In: Proceedings of the 13th International Conference on Intelligent Tutoring Systems, LNCS, vol. 9684, pp. 447–448. Springer Heidelberg (2016)
- Rita Garcia, Katrina Falkner, and Rebecca Vivian. 2018. Scaffolding the Design Process using Parsons Problems. In Proceedings of the 18th Koli Calling International Conference on Computing Education Research (Koli Calling '18). Association for Computing Machinery, New York, NY, USA, Article 26, 1–2. DOI:https://doi.org/10.1145/3279720.3279746
- Juha Helminen, Petri Ihantola, Ville Karavirta, and Lauri Malmi. 2012. How do Students Solve Parsons Programming Problems?: An Analysis of Interaction Traces. In Proceedings of the ninth annual international conference on International computing education research (ICER '12). ACM, New York, NY, USA, 119-126. DOI: https://doi.org/10.1145/2361276.2361300.
- Petri Ihantola and Ville Karavirta. 2011. Two-dimensional Parson’s Puzzles: The Concept, Tools, and First Observations. Journal of Information Technology Education. 10 (2011), 119–132.
- Petri Ihantola and Ville Karavirta. 2010. Open Source Widget for Parson's Puzzles. In Proceedings of the fifteenth annual conference on Innovation and technology in computer science education (ITiCSE '10). ACM, New York, NY, USA, 302-302. DOI: https://doi.org/10.1145/1822090.1822178
- Amruth N. Kumar. 2019. Mnemonic Variable Names in Parsons Puzzles. In Proceedings of the ACM Conference on Global Computing Education (CompEd '19). ACM, New York, NY, USA, 120-126. DOI: https://doi.org/10.1145/3300115.3309509
- Amruth N. Kumar. 2019. Helping Students Solve Parsons Puzzles Better. In Proceedings of the 2019 ACM Conference on Innovation and Technology in Computer Science Education (ITiCSE '19). ACM, New York, NY, USA, 65-70. DOI: https://doi.org/10.1145/3304221.3319735
- Amruth N. Kumar. 2018. Epplets: A Tool for Solving Parsons Puzzles. In Proceedings of the 49th ACM Technical Symposium on Computer Science Education (SIGCSE '18). ACM, New York, NY, USA, 527-532. DOI: https://doi.org/10.1145/3159450.3159576.
- Amruth N. Kumar. 2017. The Effect of Providing Motivational Support in Parsons Puzzle Tutors. In Proceedings of Artificial Intelligence in Education. (AI-ED 2017), Wuhan, China, June 2017, 528-531. DOI= https://doi.org/10.1007/978-3-319-61425-0_56
- Amruth N. Kumar. 2019. Representing and Evaluating Strategies for Solving Parsons Puzzles. In Proceedings of Intelligent Tutoring Systems (ITS 2019), Kingston, Jamaica. Springer LNCS 11528, 193-203
- Raymond Lister, Tony Clear, Simon, Dennis J Bouvier, Paul Carter, Anna Eckerdal, Jana Jacková, Mike Lopez, Robert McCartney, Phil Robbins, Otto Seppälä, and Errol Thompson. 2010. Naturally Occurring Data as Research Instrument: Analyzing Examination Responses to Study the Novice Programmer. ACM SIGCSE Bulletin 41, 4 (2010), 156–173
- Mike Lopez, Jacqueline Whalley, Phil Robbins, and Raymond Lister. 2008. Relationships Between Reading, Tracing and Writing Skills in Introductory Programming. In Proceedings of the Fourth International Workshop on Computing Education Research (ICER '08). ACM, New York, NY, USA, 101-112. DOI=http://dx.doi.org/10.1145/1404520.1404531.
- Briana B. Morrison, Lauren E. Margulieux, Barbara Ericson, and Mark Guzdial. 2016. Subgoals Help Students Solve Parsons Problems. In Proceedings of the 47th ACM Technical Symposium on Computing Science Education (SIGCSE '16). ACM, New York, NY, USA, 42-47. DOI: https://doi.org/10.1145/2839509.2844617.
- Dale Parsons and Patricia Haden. 2006. Parson's Programming Puzzles: A fun and Effective Learning Tool for First Programming Courses. In Proceedings of the 8th Australasian Conference on Computing Education - Volume 52 (ACE '06), Denise Tolhurst and Samuel Mann (Eds.), Vol. 52. Australian Computer Society, Inc., Darlinghurst, Australia, Australia, 157-163.
- Susan Wiedenbeck, Vennila Ramalingam, Suseela Sarasamma, Cynthia L. Corritore. A Comparison of the Comprehension of Object-oriented and Procedural Programs by Novice Programmers. Interacting with Computers, 11 (3). January 1999, Pages 255–282, https://doi.org/10.1016/S0953-5438(98)00029-0
- Amruth N. Kumar, Do Students use Semantics When Solving Parsons Puzzes? – A Log-Based Investigation. Proceedings of Intelligent Tutoring Systems (ITS 2021). LNCS 12677. June 2021. 444-450.
- Salil Maharjan and Amruth N. Kumar. Using Edit Distance Trails to Analyze Path Solutions of Parsons Puzzles'', Proceedings of the 13th International Conference on Educational Data Mining (EDM 2020). July 2020, 638-642.
- Amruth N. Kumar. Using Markov Transition Matrix to Analyze Parsons Puzzle Solutions. Proceedings of the Educational Data Mining (EDM 2021) Workshop on Process Analysis Methods for Educational Data, Online, June 2021.
- Michael Kölling, Neil C. C. Brown, and Amjad Altadmri. 2015. Frame-Based Editing: Easing the Transition from Blocks to Text-Based Programming. In Proceedings of the Workshop in Primary and Secondary Computing Education (WiPSCE '15). ACM, New York, NY, USA, 29-38. DOI: https://doi.org/10.1145/2818314.2818331
- [27] Valerie Barr and Deborah Trytten. 2016. Using Turing’s craft Codelab to support CS1 students as they learn to program. ACM Inroads 7, 2 (May 2016), 67–75
- [28] Robert S. Rist. (1989). Schema creation in programming. Cognitive Science, 13(3), 389-414.
- [29] Chris Piech, Mehran Sahami, Daphne Koller, Steve Cooper, and Paulo Blikstein. 2012. Modeling how students learn to program. In Proceedings of the 43rd ACM technical symposium on Computer Science Education (SIGCSE '12). ACM, New York, NY, USA, 153-160.
- [30] Robert S. Rist. (1991). Knowledge creation and retrieval in program design: A comparison of novice and intermediate student programmers. Human-Computer Interaction, 6(1), 1-46.
- [31] Bassok, M., Chase, V.M., and Martin, S.A. (1998). Adding apples and oranges: Alignment of semantic and formal knowledge. Cognitive Psychology, 35(2), 99-134.
- [32] Bassok, M., and Olseth, K.L. (1995). Object-based representations: Transfer between cases of continuous and discrete models of change. Journal of Experimental Psychology: Learning, Memory, and Cognition, 21(6), 1522-1538.
- [33] Martin, S.A., and Bassok, M. (2005). Effects of semantic cues on mathematical modeling: Evidence from word-problem solving and equation construction tasks. Memory and Cognition, 33(3), 471-478.
- [34] Christopher Watson and Frederick W.B. Li. 2014. Failure rates in introductory programming revisited. In Proceedings of the 2014 conference on Innovation & technology in computer science education (ITiCSE '14). ACM, New York, NY, USA, 39-44. DOI=http://doi.acm.org/10.1145/2591708.2591749
- [35] Jens Bennedsen and Michael E. Caspersen. 2007. Failure rates in introductory programming. SIGCSE Bull. 39, 2 (June 2007), 32-36. DOI: https://doi.org/10.1145/1272848.1272879
© 2023 Copyright is held by the author(s). This work is distributed under the Creative Commons Attribution-NonCommercial-NoDerivatives 4.0 International (CC BY-NC-ND 4.0) license.