ABSTRACT
We explore multi-modal machine learning-based approaches (facial expression recognition, auditory emotion recognition, and text sentiment analysis) to identify negative moments of teacher-student interaction during classroom teaching. Our analyses on a large (957 videos, each 20min) dataset of classroom observations suggest that: (1) Negative moments occur sparsely and are laborious to find by manually watching videos from start to finish. (2) Contemporary machine perception tools for emotion, speech, and text sentiment analysis show only limited ability to capture the diverse manifestations of classroom negativity in a fully automatic way. (3) Semi-automatic procedures that combine machine perception with human annotation may hold more promise for finding authentic moments of classroom negativity. Finally, (4) even short 10sec negative moments contain rich structure in terms of the actions and behaviors that they comprise.
Keywords
1. INTRODUCTION
In school classrooms, the emotional climate set by the teacher can significantly impact student engagement, attitudes toward learning, and downstream academic and socioemotional outcomes [9, 8, 5]. Classrooms in which students feel encouraged, excited, and supported to learn are associated with positive engagement [9], fewer conflicts with teachers [16], and stronger executive functioning of the learners [28]. Conversely, classrooms with negative classroom climate – as exhibited by teacher irritability, anger, sarcasm, yelling, intimidation, etc. – are associated with poorer outcomes in these areas. Given the connection between classroom negativity and worse student outcomes, it is important to help teachers to reduce negativity in their teaching. Over the years, educational researchers have devised professional development and training programs to assist teachers in fostering classroom climates that are more conducive to learning [15]. One useful practice is to identify and discuss specific moments – either in the teacher’s own classroom or in someone else’s – that are especially positive or negative. For the positive moments, one can then examine the ways in which the teacher acted effectively; for the negative moments, one can discuss more constructive ways in which the teacher could have navigated the situation.
Needle in a Haystack: One obstacle to providing teachers with useful feedback on classroom observation is the need to find “teachable moments” that are worthy of close examination within a long classroom video. Even in a large library of classroom observation sessions, it may be difficult and laborious to find a variety of interesting moments. New methods for automated perception of school classrooms, as enabled by advances in computer vision, speech analysis, and natural language processing during the past 5-10 years, offer the possibility of accelerating the process of finding teachable moments. For an individual teacher, these new tools could make it possible to record their own teaching and quickly identify candidate moments – on a regular basis, not just 1-2 per year – that they should examine more closely. Deployed on a larger scale, such perceptual tools could also help researchers to systematically study moments of strong positivity or negativity in collections of classroom videos. In our paper, we assess the extent to which modern AI-based tools for the recognition of facial expression, auditory emotion, speech, and text sentiment could be used to find short (10sec) negative moments of classroom interaction between the teacher and the students.
Our definition of negative moment is rooted in the construct of negative climate from the Classroom Assessment Scoring System (CLASS; [25]). A classroom is said to exhibit negative climate if it contains negative affect (irritability, anger, harshness, etc.) by the teacher, punitive control, sarcasm/disrespect, or severe negativity (victimization, bullying, etc.). Negative climate under the CLASS framework is labeled on the timescale of 15-20 minute video segments. In contrast, we were interested in finding negative moments (10sec), as this is an arguably more useful timescale on which to give teachers specific feedback. This shorter timescale matches more closely with the specific actions and interactions that occur within a classroom teaching session (e.g., a single sentence spoken by the teacher to a student; physical actions such as touching or co-manipulation of an object by a teacher and student simultaneously; a facial expression that is displayed briefly for one person to another). It aligns with the natural timescale over which emotional states typically change [4]. We also are primarily interested in negativity expressed by the teacher, not by students.
Study Overview: We harness a large dataset of nearly 1000 videorecorded classroom observation sessions, each 20 minutes long, that were collected from individual teachers in elementary and middle schools. In terms of research questions, we examine (RQ1) to what extent modern AI-based machine perception tools can automatically find negative moments from classroom observation videos. In addition to fully automatic methods, we also explore (RQ2) whether a semi-automatic detection paradigm that combines AI with human annotation can yield a more accurate filtering mechanism. Finally, (RQ3) given the set of negative moments that we find, we explore what kind of semantic structure they contain and analyze them in terms of what happened on an utterance-by-utterance and action-by-action basis.
Ethics of Automated Classroom Analysis: Our long-term goal is to help teachers obtain more frequent and fine-grained feedback about their own teaching compared to the standard practice, which is to get very sparse feedback 1-2x/year from a school principal. Our paper provides a sober assessment of how realistic it is, using contemporary machine perception tools, to provide such feedback.
2. RELATED WORK
Classroom Observation Protocols: With the goal of characterizing classroom interactions more precisely and objectively, as well as providing teachers with more useful feedback, educational researchers have devised a variety of classroom observation protocols over the past two decades. These include the Protocol for Language Arts Teaching Observations (PLATO; [13]), Assessing Classroom Sociocultural Equity Scale (ACSES; [10]), and the Classroom Assessment Scoring System (CLASS; [25]). The CLASS is curriculum-agnostic and one of the most widely used protocols; it focuses on inter-personal interactions between teachers, students, and their peers.
Automatic Classroom Analysis: The EduSense system developed by Ahuja et al. [1] uses classroom audio and video to detect temporally specific features such as who is talking when, hand-raises, body posture, and smiles. These features can be aggregated over time and visualized in a dashboard for teachers that shows the total amount of instructor versus student speech, total number of hand raises, etc. The system does not perform high-level semantic analysis or make holistic judgments about the classroom experience. Zylich & Whitehill [29] trained custom neural networks to recognize key phrases associated with positive speech such as “please”, “thank you”, “good job”, etc. They showed that the counts of these detected phrases over 15min classroom videos were correlated with some CLASS dimensions. Kelly et al. [19] developed a system to detect how often teachers are asking authentic questions of their students, i.e., questions whose answers are open-ended and facilitate productive classroom discourse. Their approach takes an automatically generated transcript of the classroom audio; extracts word, sentence, and discourse-level features; and then applies regression trees to estimate the proportion, over the entire class period, of the teacher’s questions that were open-ended. James et al. [18] used automatic facial expression recognition from classroom videos to estimate Positive and Negative Climate dimensions of the CLASS. Finally, Qiao and Beling [27] explored a multi-instance learning approach to identifying specific moments within classroom videos that human coders should examine in order to perform CLASS labeling more efficiently.
3. DATASET
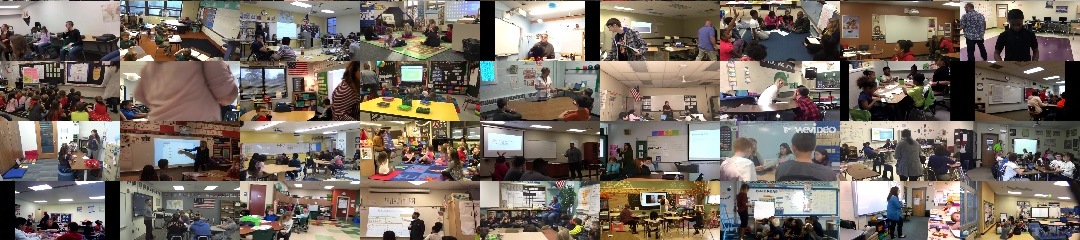
The dataset we used in our experiments (IRB #17-151 at Worcester Polytechnic Institute) was shared with our research group by a California-based company for teacher training. It consists of 957 classroom observation videos (20min each) ranging from kindergarten through middle school in a Midwestern state in the USA. Each video contains a different teacher and set of students. The videos were recorded by the teachers themselves to obtain feedback on their teaching; hence, the video camera model, placement, lighting, etc., can vary strongly between videos. While the teachers’ faces and voices are usually clearly captured in each video, the students’ often are not. See Figure 1.
4. MACHINE SENSORS
Our definition of negative moments involves the teacher’s affect as well as the content of their speech and their actions. While capturing all facets of classroom negativity using automated tools is likely infeasible, there already exist machine perception tools that can detect certain aspects of negativity and that might help to find negative moments more quickly than by watching whole videos one-by-one. In particular, we explored the utility of modern (i.e., developed during the past 5 years) AI-based tools for speech recognition, text sentiment analysis, facial expression recognition, and auditory emotion recognition. We describe them below.1
4.1 Auditory Emotion Recognition
To analyze auditory emotion, we used the convolutional neural network described in [6]. The network takes a 162-dimensional feature vector (extracted by the Librosa package [21]) as input consisting of zero-crossing rates, Chroma-STFT, MFCC, RMS, and Mel spectrograms, which are all standard features in modern audio analysis. The features are extracted from 5sec audio segments, whereby each segment is split into multiple windows in time, and the features extracted from the windows are averaged before being passed to the network. The network was trained to classify 8 emotions (anger, calm, disgust, fear, happiness, neutral, sadness, and surprise) on a combination of 4 different datasets: CREMA-D [7], RAVDESS [20], SAVEE [17], and the TESS [26]. These datasets are widely used for auditory emotion recognition and contain recordings of individual adult speakers. They do not span the highly challenging conditions (overlapping speech, high background noise) found in school classrooms, nor do they contain children’s voices; nonetheless, they are likely some of the best publicly available training datasets available. The test accuracy (61% over 8 emotions) of the trained network on these datasets is consistent with that reported by the authors of [6].
For our study, to obtain a speech-based emotion estimate for each 10sec moment of every classroom video, we split each moment into two 5-sec chunks, classified each chunk over the 8 emotion categories, and then averaged the estimates over the two chunks. Finally, to obtain an estimate of “negativity”, we summed the emotion probabilities for the “anger” and “disgust” categories; since the focus of our study is on the teacher’s expressed negativity, we did not include the “sad” emotion in this sum. We note that, in practice, since most of the sound recorded in the videos comes from the teacher’s speech, the auditory emotion detector is most likely to contain information on the teacher’s expressed emotion rather than the students’ auditory emotional responses.
Custom detectors: We also conducted a pilot experiment, using the same audio features, on training a custom detector (using 50 negative moments for training; see Section 5). The motivation was that training detectors on actual classroom data, rather than a general-purpose auditory emotion dataset, might be more effective. However, the test accuracy was basically at-chance, and we abandoned the approach.
4.2 Facial Expression Recognition
We first considered using OpenFace [3], but this software is specialized for analyzing a single face per image, not multiple faces and it detects facial Action Units [11] rather than semantic emotion labels (“anger”, “disgust”, etc.). Hence, we instead used the pre-trained facial emotion recognition convolutional neural network from [2], which achieves an overall accuracy, over a set of 7 detected emotions (anger, disgust, fear, happiness, sadness, surprise, neutral), of 66% on the FER2013 dataset [12]. FER2013 spans a wide range of lighting conditions and head poses (though not as extreme as those in classroom videos), but contains mostly adults.
To obtain a facial emotion estimate for each 10sec moment of every classroom video, we split each moment into 10 frames (spaced at 1 Hz); detected all the faces in the frame using OpenCV’s built-in Haar-based cascaded face detector; and then analyzed the face for facial emotion using the trained emotion classifier. To compute an aggregate score for each emotion, we averaged the emotion estimates over all detected faces within the set of all 10 frames. (If no frames in the moment contained any detected faces, then the floating-point value NaN (“not a number”) was assigned to all emotions in the 10sec moment.) Finally, to obtain a score of “negativity” for each moment, we added together the probability estimates for the “anger” and “disgust” emotions. We note that the facial expression sensor is most likely to contain information on the teacher’s emotion, as the teacher’s face is often the visual focus of the camera in most videos.
Summed over all sampled frames from all 957 classroom videos in the dataset, a total of 160398 faces were detected and analyzed for facial expression. On average, therefore, there were only about \(0.14\) faces detected per video frame, i.e., most people were not detected in most frames.
4.3 Text Sentiment Analysis
To analyze text for its sentiment, we first transcribed each video using the Web Speech API [22] developed by Mozilla and Google. Each video was split into 10sec chunks of audio, and each chunk was passed to the Web Speech API separately. The average number of 10sec moments in which the Web Speech API detected any speech at all was 80.19 (out of 120 total 10sec moments in a 20min video). The average number of transcribed words per video was 917.83. Each automatic transcription was then classified for sentiment using the Google Cloud Natural Language API. It returns a numeric score between -1.0 (most negative) and +1.0 (most positive) for each input. Examples: “a handle like it why do you think she got in his face and got upset with him” (sentiment: \(-0.9\)); “okay go ahead what’s your favorite season” (sentiment: \(0.4\)); and “very nice job on making your pros and cons very even very lined up makes it easy to count” (sentiment: \(0.9\)). To obtain an estimate of “negativity” using the sentiment analyzer’s raw output \(s\), we remapped the range \([-1,1]\) to \([0,1]\) and reversed the scale, i.e., the negativity \(n\) was computed as \(n=1 - (s/2 + 0.5) \in [0,1]\).
5. FINDING NEGATIVE MOMENTS AUTOMATICALLY (RQ1)
In our first analysis we assess how accurately modern machine sensors can find classroom negative moments.
5.1 Annotation Process
Ideally, we would have ground-truth annotations of every 10sec moment of all 957 videos; however, this would be prohibitively expensive. Moreover, annotating a uniformly random sample from the dataset would likely uncover very few negative moments since they occur so sparsely. We thus use a different strategy: Since we have a form of automated labeling available to us (i.e., the sensors), we can use each sensor to find videos in which there is, according to the sensor’s outputs, the largest variance of negativity. We then select the most negative and least negative moments (according to the sensors) within each of those videos, label these moments by hand, and then compute the accuracy of the machine w.r.t. human labels. With this procedure, we are essentially measuring the sensors’ abilities to identify coarse-grained differences in negativity rather than very fine-grained differences if we had randomly selected pairs of moments from anywhere in the whole dataset. We applied this strategy for each of the three sensors as well as two ensemble models. All in all, we obtained 100 moments (20 from each automated method).
The annotation team consisted of the three authors of this paper, of whom the senior author is CLASS-trained. Prior to annotation, the team examined a handful of video examples, and each annotator labeled them independently. Next, the team came together to discuss their labels and arrive at a consensus understanding. Finally, each labeler proceeded to annotate the remaining examples. We assessed inter-rater reliability (IRR) as the average pairwise agreement between annotators using the linearly weighted Cohen’s \(\kappa \) coefficient.
5.2 Annotation Tasks
The labeling task consisted of both an absolute rating task and a relative rating task. The former is about distinguishing the negativity between any two moments of classroom teaching at any moment and from any teacher, whereas the latter is about comparing the negativity of two moments within the same teacher’s classroom.
Absolute negativity: Annotators were presented with a set of 100 moments and were asked to rate each one as “negative”, “positive”, or “neutral”. These labels were then converted into integers -1, 0, and +1, respectively. On this task, the average pairwise IRR was \(\kappa =0.39\). Over the \(3\times 100\) total labels across the three annotators, only 16 were negative. None of the 100 moments received a label of “negative” (\(-1\)) from all three labelers. Only 1 out of the 100 moments received 2 votes (out of 3) of “negative”. These numbers reflect how classroom negativity often occurs very sparsely in a classroom observation session.
Relative negativity: Annotators were presented with a set of 50 pairs of 10sec moments, whereby each pair came from the same video but different pairs came from different videos. For each moment in each pair, they were asked to label which of the two moments was more negative (-1 if the first moment was more negative, and +1 if the second video was more negative), with an option for “neither” (0) if no difference in negativity could be discerned. On this task, the average pairwise IRR was \(\kappa =0.37\). Only 4 of the 50 moment-pairs received a unanimous vote across all 3 labelers that one moment was either “more negative” than the other.
5.3 Accuracy of Machine Sensors
Finding Negative Moments Automatically
| ||
|---|---|---|
| Sensor | Absolute | Relative |
| Auditory Emotion | 0.64 | 0.52 |
| Facial Expression | 0.41 | 0.35 |
| Text Sentiment | 0.61 | 0.52 |
Absolute negativity: To estimate each sensor’s accuracy, we first averaged the three annotators’ integer labels for each moment to obtain a “ground-truth” label. For instance, if two annotators labeled a moment as “neutral” and one labeled it as “negative”, then the average is \(-1/3\). We then computed binary labels for each moment (1 for “negative” and 0 for “non-negative”) by thresholding this average with 0. After doing so, we obtained a set of 15 negative moments and 85 non-negative moments. We then computed the Area Under the ROC Curve (AUC) of each machine sensor using these binary labels. Using this procedure (see Table 1), we obtained an AUC of \(0.64\) for the auditory emotion sensor, \(0.41\) for the facial expression sensor (i.e., slightly worse than just randomly guessing, though this is likely due to just statistical noise), and \(0.61\) for text sentiment.
Relative negativity: We selected the set of moment-pairs in which the average integer label (-1, 0, or +1) over the three annotators was non-zero, i.e., the consensus was that one of the two moments in each pair was “more negative” than the other. This resulted in a set of 31 (out of the original) 50 moment-pairs. We then computed the fraction, for each machine sensor, of the pairs in which the sensor’s output agreed with the average label. Using this procedure, we obtained a score (% correct) of \(0.52\) for the auditory emotion sensor, \(0.35\) for the facial expression sensor, and \(0.52\) for the text sentiment sensor. These accuracies are not significantly better than just randomly guessing (0.5 in this case).
5.4 Discussion
No sensor performed substantially above chance for either the absolute or relative negativity detection tasks, despite the fact that the data was sample was selected to have a high variance of negativity – i.e., the machine was tasked with discerning coarse-grained rather than fine-grained differences. Moreover, the IRR for both the absolute and the relative negativity labeling tasks was fairly low (0.3-0.4). This suggests that the machine sensors we tried had basically no ability to identify negative moments, and that randomly selecting moments from a video will uncover very few such moments of classroom interaction. This agrees with the annotation team’s subjective experiences that there was little clear negativity in the moments they labeled.
Based on manually watching hundreds of classroom video segments, we suggest several possible explanations for why the sensors did not perform well: (1) The emotion categories recognized by the sensors do not closely match academic emotions [24] that occur in school classrooms. (2) The demographic diversity and difficulty of the training data is much more limited compared to the classroom videos in our dataset. (3) The face detector misses the majority of faces that occur in our video dataset; when it is visible, it is often difficult to perceive the person’s facial expression.
With regards to the more promising results reported in [18, 29], we speculate that the larger timescale in their studies (15min) compared to ours (10sec) may help their models to “smooth out” measurement noise in the sensors’ outputs.
6. FINDING NEGATIVE MOMENTS SEMI-AUTOMATICALLY (RQ2)
With the limited success of the fully automated approach, we next explored a semi-automatic approach that combines algorithmic filtering with human annotation. Our method was based on our observation that the automatic transcripts of the classroom videos, though imperfect, still hold insight into what transpired in each 10sec moment; moreover, in pilot data exploration we found that simple keyword searches for certain phrases such as “sit down” would already find moments in which the teacher was correcting students’ behavior and possibly also exhibiting negativity. In particular, we heuristically formed a list of phrases that we deemed likely to contain moments of behavioral corrections [14], such as asking students to sit down, stop talking, pay attention, etc. Corrections are not inherently negative, particularly if the teacher redirects students toward more constructive behaviors and in a way that does not demean them. In practice, they are often associated with teacher negativity, and thus detecting behavioral corrections can help to uncover some (but by no means all) kinds of negative moments.
We assembled a list containing the following phrases that we deemed likely to capture situations that are associated with behavioral correction: “excuse me”, “keep your”, “why are you”, “I need you”, “stop”, “be quiet”, “sit down”, “eyes on me”, “can you please”, “can you stop”, “listen”, “attention”, “don’t talk”, “don’t yell”, “on your bottom"2, “noise”, and “keep the volume”. We then devised the following procedure to identify “corrective” moments: (1) Use automatic speech recognition (ASR) to transcribe each 10sec moment from all the videos. (2) Filter the set of all moments to include all and only those that contain at least one of the keyphrases above. (3) Manually read the transcripts (but do not watch the corresponding video segment) of the filtered moments; keep only those that are deemed to be “corrective”.
We performed the procedure above on our entire dataset of 957 classroom videos. In practice, we found the procedure to be both intuitive to perform – i.e., the transcripts are usually quite readable and give some sense of the classroom interaction – and efficient – i.e., it took only a few person-hours to read the transcripts filtered through step 2.
6.1 Annotation Process
To assess accuracy of the procedure, the annotation team examined 100 moments: 50 that passed step 3, and 50 that were filtered out during step 2 (since they did not contain any keyphrase). They labeled each moment as “negative” (-1), “neutral” (0), or “positive” (+1). To do so, they examined these 10sec moments with the video (i.e., not just from the transcript like in step 3), including a few seconds of context before/after the start/end of each video segment so as to understand the moment more thoroughly. The average pairwise IRR on this task was \(\kappa =0.60\). In a similar manner, the team also labeled each moment as “corrective” vs. “not corrective” (IRR: \(\kappa =0.8\)).
6.2 Accuracy of Semi-Automatic Procedure
Negative moments: Of the 50 moments that passed step 3 of the semi-automatic procedure, 29 (i.e., 58%) were confirmed – by taking the average numeric label across all 3 labelers and thresholding at 0 – to be “negative”. Of these 29 moments, 26 were further confirmed as “corrective”. Moreover, there were 12 moments in which all 3 labelers unanimously agreed were negative, and 5 more moments in which 2 out of 3 labelers agreed were negative. The AUC of the semi-automatic procedure for distinguishing between negative and non-negative moments was \(83.3\%\).
Corrective moments: Of the 50 moments that passed step 3 of the semi-automatic procedure, 33 (i.e., 66%) were confirmed by the labelers, after taking majority vote of their corrective vs. not corrective labels, as being corrective. The AUC of the procedure for distinguishing between corrective and non-corrective moments is also \(83.3\%\).
6.3 Discussion
This semi-automated procedure showed more promise for accurately finding negative moments than did the fully automated sensors. The IRR of manually validating the output of the procedure was also much higher (0.6 compared to 0.3-0.4 for labeling the results of the fully automated approach) and provides further validation that it is making meaningful distinctions in negativity.
When examining the false detections – i.e., moments output by the procedure that were not actually negative – we found several in which the teacher was talking about negativity (e.g., about why it is important to follow rules in society), rather than actually exhibiting negativity. This semantic distinction would likely be very difficult for a machine to make automatically. Another source of false detections that we found was the transcription error made by the Web Speech API, such that a keyphrase in our list was not actually spoken within the video. In terms of missed detections – i.e., negative moments that were missed by the procedure – there are likely many kinds of classroom negativity that are not associated with corrective behavior and would thus be missed. However, by assembling a different list of keyphrases and/or applying more sophisticated methods of analyzing the transcripts, it is possible that other kinds of negative moments could also be discovered.
7. MANIFESTATIONS OF NEGATIVITY
Given that the machine sensors showed little success in uncovering negative moments, we wanted to examine whether this was because the negative moments in our dataset truly do not actually exhibit any differences in facial expression and/or auditory emotion, or whether the detectors we used were too poor in accuracy or perhaps not trained on the right kinds of data. To this end, we performed further annotation about which of the two 10sec moments in a pair from the same video are “less negative” (-1) or “more negative” (+1) in terms of facial expression, and (separately) in terms of auditory emotion. If no difference could be ascertained, a label of 0 was assigned. Importantly, the focus of this annotation task was to examine the facial and auditory emotion in isolation, and to ignore higher-level semantics of the content of the teacher’s speech or the trajectory of their actions. We performed the annotation on the same set of 100 videos described in Section 6.1.
7.1 Negative Auditory Emotion
When judging which of the two moments exhibited more negative auditory emotion, the average pair-wise IRR of the annotators was \(\kappa =0.32\), suggesting low to moderate agreement on individual moments. This number agrees with our subjective impression that discerning differences in negativity based on auditory emotions is challenging, and that the differences are much smaller than, say, the difference between “happy” and “angry” in standard datasets used for training speech emotion classifiers (Section 4.1). Nevertheless, once we averaged all three labelers’ responses for each moment-pair, we found stronger evidence that the auditory emotion of a moment is diagnostic for labeling it as “negative”: in 78% of the moment-pairs, the moment that was identified as having “more negative” audio was the moment in the pair that was labeled as a “negative moment” overall.
| Teacher Action | Descriptive Example |
|---|---|
| Direct Correction (Verbal) |
The teacher is counting down from five to have her class be quiet. When she reaches zero, she says, “shhhhhh", to have the last few students be quiet. |
| Direct Correction (Physical) |
The teacher verbally tells the child, “No, no", while physically gesturing with her hand for the child to direct them to stop talking. |
| Sarcasm | “[Name], we will hear from you first… since you are eager to speak."
|
| Threat |
“I want you to put this stuff away and follow directions, or I am going to have to call dad… and grandma again, ok?" |
| Body Motion |
The teacher is providing instructions to the class and the child in front of her is playing with a plastic bag, which leads to the teacher physically removing it from the child’s hands. |
| Deflection |
A child walks to the front of the room when they aren’t supposed to. The teacher walks them back to their seat. The child protests; the teacher replies, “Ok, I am not hearing any of that." |
| Justification | “I see a lot of people who are off task…so we need to bring our attention up front."
|
7.2 Negative Facial Expression
When examining facial expression, the IRR was \(0.40\), which was slightly higher than for auditory emotion. After taking the average label across all three annotators, we found that, in only 58% of the moment-pairs was the moment identified as having “more negative” facial expression the moment in the pair that was labeled as a “negative moment” overall.
7.3 Discussion
Together, these results suggest that, while there is some relationship between the facial and/or auditory emotion of the classroom and the overall negativity of each 10-second classroom moment, there is still considerable subjectivity when judging each individual moment. Similar to our results on fully automated approaches to finding negative moments with different sensors, here too we found that auditory emotion was more informative than facial expression. All in all, it seems that examining auditory and facial expressions in isolation is insufficient – what defines classroom negativity depends on more detailed analysis of what transpires.
First | Second | Third | Fourth | Total | |
|---|---|---|---|---|---|
| Direct Correction | |||||
| Verbal | 15 | 13 | 5 | – | 33 |
| Physical | 12 | 8 | 3 | 2 | 25 |
| Sarcasm | 2 | 3 | 1 | 1 | 7 |
| Threat | 2 | – | 2 | 1 | 5 |
| Body Motion | 8 | – | – | – | 8 |
| Deflection | 1 | – | – | 1 | 2 |
| Justification | 3 | 5 | 2 | – | 10 |
8. NEGATIVE MOMENT ANALYSIS (RQ3)
To understand better the semantic structure of negative moments, we examined a set of 43 video clips that were labeled by our annotation team as “negative moments” in our previous analyses on fully automatic (Section 5) as well as semi-automatic (Section 6) methods for finding classroom negativity. We qualitatively examined each video clip to obtain a deeper understanding of the subject (the nature or cause) of the negativity, as well as the trajectory of actions and utterances that the 10sec moment comprised. As an example, the subject of several negative moments was the teacher asking students to sit down in their seats. This might involve actions and utterances such as pointing to the student’s seat, approaching the student’s desk, and directing the student to sit down. Through our qualitative coding process (described below), we identified 4 recurrent subjects: “Stop Fidgeting”, “Sit Down”, “Listen”, and “Stop Talking”. Further, we identified 6 types of actions & utterances: Direct Correction (expressed either verbally or physically) of the student’s behavior, Sarcasm, Threat, Body Motion (e.g., aggressive posturing of the teacher’s body w.r.t. the student), Deflection (e.g., brushing off a student’s comment through a verbal rejoinder), and Justification (explaining why the teacher is correcting the student’s behavior). See Table 2.
Procedures: The review process of the negative moments went as follows: (1) The annotation team watched the moment two times in a row together to gain a preliminary understanding; (2) The annotators discussed their opinions of the moments, how they believed each moment to break down into multiple stages, and what they believed the trajectory of actions and utterances to be; (3) The annotators watched the moment, pausing at notable points in time, to agree or disagree on each other’s labels; and finally, (4) the annotators formed a consensus on the label trajectory of actions/utterances in the 10sec moment. The qualitative codes we used to analyze each clip, along with illustrative examples, can be found in Table 2.
Results: Through the analysis of the 43 10-second video clips we categorized using Table 2, we found that teachers, on average, performed about 2 actions (\(\overline {X} = 2.09\), \(SD = 1.00\)) per 10sec moment. Some negative moments even contained up to 4 distinct actions/utterances. The action frequencies can be seen in Table 3, where each column corresponds to a different stage with each moment’s trajectory.
8.1 Vignettes of Classroom Negativity
To give a more vivid sense of what kinds of negative moments emerged, we describe three “vignettes” that illustrate different subjects of negativity that we identified.
8.1.1 Vignette #1: Stop Fidgeting
There is a small round table in the classroom with four students (likely between grades 2 and 4) surrounding it, with a teacher standing a few feet away. The teacher is standing next to a whiteboard with math (i.e. \(4 \times 5 = 20\)) written down. The teacher is providing instructions to the group of students on how to complete a printed assignment in front of each student. Most students are sitting still, watching the teacher, and looking at their papers. However, one student, who appears to be African-American, who is closest to the camera, and whose back is facing the camera, begins to dance in her seat: Her left arm is angled down towards the floor, and her right arm is angled up towards the ceiling; she is rocking her shoulders forward and back, causing her arms to sway. The teacher is distracted by the dancing, looks at the student with an angry expression, and then issues a verbal command with a harsh tone: “I need you to stop. Thank you." [Direct Correction – Verbal]. The teacher then turns to look at a boy seated at the table, who says something to the teacher which elicits a verbal response of “Oh great, great".
We speculate that this student’s body movements and expressiveness might be an instance of verve, which is a learning style associated with African-American students that “can be defined as having energy, being intense, having expressive body language, and having a tendency to attend to several different areas of focus"; it is sometimes misinterpreted by teachers as challenging or assertive [14]. The last comment (“Oh great, great”) was spoken in a tone that sounded sarcastic. This is a case where accurate and temporally precise recognition of negative auditory emotion is important to correctly interpret a teacher’s action.
8.1.2 Vignette #2: Sit Down
About 15 students (between grades 1 and 3) are sitting on a large carpet with the teacher sitting on a rocking chair in front of the students. The moment begins with the teacher speaking to one male near the back of the carpet, asking him to sit down [Direct Correction – Verbal]. Her voice becomes more stern when she realizes multiple students are not following the direction to sit down. Her facial expression becomes more frustrated, and she states, “If I have to remind the boys in the back how to sit sharp one more time, you are going to lose points" [Threat] while giving a single downward nod followed by her pointing behind the easel. At this point, the students sit properly and the teacher, after waiting a few seconds, resumes teaching.
8.1.3 Vignette #3: Listen
The classroom consists of about 15 students (likely between grades 4 and 6) all situated at large communal tables in groups of two to four, and one teacher. The teacher is walking to the front of the room while discussing Día de Los Muertos (Day of the Dead) when she looks up and notices a group of students in the back of the class who are not on task. The teacher stops walking around the room, looks at the boys and, with a serious facial expression, she says: “Boys? I hope you are listening, don’t play with the folder..." [Direct Correction – Verbal]. While making her comments to the boy, she extends her arm [Direct Correction – Physical] and motioning for them to stop. After a short pause to make sure the boys are listening, the teacher resumes teaching.
8.2 Discussion
Within the moments we analyzed, the Direct Correction action was most frequent. Most moments contained multiple distinct actions within them, despite the short duration (10sec). One of the least frequent actions we observed was Justification, even though this would likely be beneficial to students. Finally, in order to fully understand what happened as well as the intensity of each negative moment, the annotation team found it was necessary to combine information about what was said or done (semantic content), how it was said (tone of voice, facial expression), and what gestures and body language accompanied the action/utterance. The particular facial expressions and body movements that we observed in the vignettes were often short (\(<\)1 sec), which makes automatic detection even more challenging.
9. CONCLUSIONS
We conducted a machine learning analysis of how different automated tools for facial expression recognition, auditory emotion recognition, speech recognition, and text sentiment analysis can be used to identify classroom “negative moments” automatically. We considered both fully automatic as well as semi-automatic (i.e., speech recognition combined with some human annotation) approaches to finding negative moments in a large collection (957 videos, 20min long) of classroom videos. Moreover, we examined, on an utterance-by-utterance and action-by-action level, a set of 43 negative moments that were found by the semi-automated procedure.
Lessons learned: (1) Negative moments occur rarely, and a random sample from a classroom observation is unlikely to contain many of them. (2) The differences in facial and auditory emotion that distinguish negative moments from normal instruction are subtle – much more so than the differences in emotion categories (happy, sad, etc.) found in contemporary emotion datasets. (3) Full automation of the search process for negative moments is very challenging for contemporary AI systems that are trained on basic emotions such as happy, sad, angry, etc. We found more promise in a simple semi-automated procedure that combines automatic speech recognition, keyphrase search, and some human annotation. (4) Even short 10sec negative moments often comprise multiple actions and/or utterances by the teacher.
Future research can explore whether large language models (LLMs) such as ChatGPT [23] can be trained (by fine-tuning and/or few-shot learning) to identify classroom negativity more accurately. One bottleneck, however, is the accuracy of speech recognition, especially given the noisy classroom conditions with overlapping and sometimes inaudible speech. In addition, training custom multimodal detectors of new behaviors and states such as “fidgeting”, “sarcasm”, etc., could be useful to understand classroom interactions.
Acknowledgment: This research was supported by the NSF National AI Institute for Student-AI Teaming (iSAT) under grant DRL #2019805. The opinions expressed are those of the authors and do not represent views of the NSF. We also gratefully acknowledge NSF awards #2046505 and #1822768.
10. REFERENCES
- K. Ahuja, D. Kim, F. Xhakaj, V. Varga, A. Xie, S. Zhang, J. E. Townsend, C. Harrison, A. Ogan, and Y. Agarwal. Edusense: Practical classroom sensing at scale. Proceedings of the ACM on Interactive, Mobile, Wearable and Ubiquitous Technologies, 3(3):1–26, 2019.
- O. Arriaga, M. Valdenegro-Toro, and P. Plöger. Real-time convolutional neural networks for emotion and gender classification. arXiv preprint arXiv:1710.07557, 2017.
- T. Baltrusaitis, A. Zadeh, Y. C. Lim, and L.-P. Morency. Openface 2.0: Facial behavior analysis toolkit. In 2018 13th IEEE international conference on automatic face & gesture recognition (FG 2018), pages 59–66. IEEE, 2018.
- Y. Baveye, E. Dellandrea, C. Chamaret, and L. Chen. Liris-accede: A video database for affective content analysis. IEEE Transactions on Affective Computing, 6(1):43–55, 2015.
- M. Burchinal, L. Vernon-Feagans, V. Vitiello, M. Greenberg, F. L. P. K. Investigators, et al. Thresholds in the association between child care quality and child outcomes in rural preschool children. Early childhood research quarterly, 29(1):41–51, 2014.
- S. Burnwal. Speech emotion recognition, 2020.
- H. Cao, D. G. Cooper, M. K. Keutmann, R. C. Gur, A. Nenkova, and R. Verma. Crema-d: Crowd-sourced emotional multimodal actors dataset. IEEE transactions on affective computing, 5(4):377–390, 2014.
- T. W. Curby, L. L. Brock, and B. K. Hamre. Teachers’ emotional support consistency predicts children’s achievement gains and social skills. Early Education & Development, 24(3):292–309, 2013.
- T. W. Curby, J. T. Downer, and L. M. Booren. Behavioral exchanges between teachers and children over the course of a typical preschool day: Testing bidirectional associations. Early Childhood Research Quarterly, 29(2):193–204, 2014.
- S. M. Curenton, I. U. Iruka, M. Humphries, B. Jensen, T. Durden, S. E. Rochester, J. Sims, J. V. Whittaker, and M. B. Kinzie. Validity for the assessing classroom sociocultural equity scale (acses) in early childhood classrooms. Early Education and Development, 31(2):284–303, 2020.
- P. Ekman and W. V. Friesen. Facial action coding system. Environmental Psychology & Nonverbal Behavior, 1978.
- I. J. Goodfellow, D. Erhan, P. L. Carrier, A. Courville, M. Mirza, B. Hamner, W. Cukierski, Y. Tang, D. Thaler, D.-H. Lee, et al. Challenges in representation learning: A report on three machine learning contests. In International conference on neural information processing, pages 117–124. Springer, 2013.
- P. Grossman. Protocol for language arts teaching observations, 2009.
- M.-B. Hamilton and L. DeThorne. Volume and verve: Understanding correction/behavioral warnings in teacher–child classroom interactions involving an african american kindergarten student. Language, Speech, and Hearing Services in Schools, 52(1):64–83, 2021.
- B. Hamre, J. T. Downer, F. M. Jamil, and R. C. Pianta. Enhancing teachers’ intentional use of effective interactions with children: Designing and testing professional development interventions. Handbook of early childhood education, pages 507–532, 2012.
- B. K. Hamre, R. C. Pianta, J. T. Downer, and A. J. Mashburn. Teachers’ perceptions of conflict with young students: Looking beyond problem behaviors. Social Development, 17(1):115–136, 2008.
- P. Jackson and S. Haq. Surrey audio-visual expressed emotion (savee) database. University of Surrey: Guildford, UK, 2014.
- A. James, M. Kashyap, Y. H. V. Chua, T. Maszczyk, A. M. Núñez, R. Bull, and J. Dauwels. Inferring the climate in classrooms from audio and video recordings: a machine learning approach. In 2018 IEEE International Conference on Teaching, Assessment, and Learning for Engineering (TALE), pages 983–988. IEEE, 2018.
- S. Kelly, A. M. Olney, P. Donnelly, M. Nystrand, and S. K. D’Mello. Automatically measuring question authenticity in real-world classrooms. Educational Researcher, 47(7):451–464, 2018.
- S. R. Livingstone and F. A. Russo. The ryerson audio-visual database of emotional speech and song (ravdess): A dynamic, multimodal set of facial and vocal expressions in north american english. PloS one, 13(5):e0196391, 2018.
- B. McFee, C. Raffel, D. Liang, D. P. Ellis, M. McVicar, E. Battenberg, and O. Nieto. librosa: Audio and music signal analysis in python. In Proceedings of the 14th python in science conference, volume 8, pages 18–25. Citeseer, 2015.
- A. Natal, G. Shires, and P. Jägenstedt. Web speech api draft community group report, 2020.
- OpenAI. Gpt-4 technical report, 2023.
- R. Pekrun and L. Linnenbrink-Garcia. Academic emotions and student engagement. In Handbook of research on student engagement. Springer, 2012.
- R. C. Pianta, K. M. La Paro, and B. K. Hamre. Classroom Assessment Scoring System™: Manual K-3. Paul H Brookes Publishing, 2008.
- M. K. Pichora-Fuller and K. Dupuis. Toronto emotional speech set (tess), 2020.
- Q. Qiao and P. A. Beling. Classroom video assessment and retrieval via multiple instance learning. In International Conference on Artificial Intelligence in Education, pages 272–279. Springer, 2011.
- C. Weiland, K. Ulvestad, J. Sachs, and H. Yoshikawa. Associations between classroom quality and children’s vocabulary and executive function skills in an urban public prekindergarten program. Early Childhood Research Quarterly, 28(2):199–209, 2013.
- B. Zylich and J. Whitehill. Noise-robust key-phrase detectors for automated classroom feedback. In ICASSP 2020-2020 IEEE International Conference on Acoustics, Speech and Signal Processing (ICASSP), pages 9215–9219. IEEE, 2020.
1In addition to the individual sensors, we also tried an ensemble combining multiple sensors; however, the accuracy was no better than one of the individual sensors.
2a phrase sometimes told to young students to sit down
© 2023 Copyright is held by the author(s). This work is distributed under the Creative Commons Attribution-NonCommercial-NoDerivatives 4.0 International (CC BY-NC-ND 4.0) license.