ABSTRACT
In adaptive learning systems, various models are employed to obtain the optimal learning schedule and review for a specific learner. Models of learning are used to estimate the learner’s current recall probability by incorporating features or predictors proposed by psychological theory or empirically relevant to learners’ performance. Logistic regression for knowledge tracing has been used widely in modern learner performance modeling. Notably, the learning history included in such models is typically confined to learners' prior accuracy performance without paying attention to learners’ response time (RT), such as the performance factors analysis (PFA) model. However, RT and accuracy may give us a more comprehensive picture of a learner’s learning trajectory. For example, without considering RT, we cannot estimate whether the learner’s performance has reached the automatic or fluent level since these criteria are not accuracy based. Therefore, in the current research, we propose and test new RT-related features to capture learners’ correct RT fluctuations around their estimated ideal fluent RT. Our results indicate that the predictiveness of the standard PFA model can be increased by up to 10% for our test data after incorporating RT-related features, but the complexity of the question format constrains the improvement during practice. If the question is of low complexity and the observed accuracy of the learner can be influenced by guessing, which results in the imprecision measured by accuracy, then the RT-related features provide additional predictive power. In other words, RT-related features are informative when accuracy alone does not completely reflect learners’ learning processes.
Keywords
INTRODUCTION
As early as Atkinson [4], model-based adaptive scheduling has been explored extensively and deeply to improve learners’ learning efficiency and long-term retention. According to the theory of knowledge tracing [9], one general and important preceding step behind this sort of research is to build a learner model that can accurately estimate the learner’s probability of correctly answering questions they will encounter based on their prior behaviors [10]. One area of learner modeling methods is derived from Item Response Theory (IRT) framework, leveraging the Rasch model's logistic transformation [34]. Several different logistic regression learning models have been successfully built by considering different facets of learners’ learning history, such as the Additive Factors Model (AFM) [7], which uses the number of prior practices, the Performance Factors Analysis (PFA) [32] which uses the performance (correct or incorrect) on previously practiced items, the Instructional Factors Analysis (IFA) [8] which uses the previous instructional interventions the learner has received, in addition to many other predictors reviewed recently [30].
We noticed that the response time (RT), one commonly used indicator in cognitive domains, was not used in such adaptive models, despite its long history as a factor that traced learning [15]. However, when depicting a learner’s performance, accuracy is not enough to give us the whole picture of the learner’s learning trajectory. Accuracy is discrete and may not be precise enough when measuring learners’ learning. For example, the learner’s incorrect responses could be caused by slipping, and similarly, the learners’ correct responses could be caused by guessing [5]. Therefore, to measure learners’ learning and performance more precisely, we hypothesize that RT and accuracy during learning should be used jointly. For example, quicker correct responses indicate learners have stronger memory traces of materials [1, 43]. Furthermore, responding fluently or automatically is often seen as a criterion of learning and training in practical situations [25], such as foreign language, emergency medicine, and simple facts learning [14, 18, 42], so incorporating it as a predictor may increase the generalizability of such modeling.
Considering the connection between learners’ RT and their performance, some researchers have integrated information implied by RT in adaptive learner modeling [11, 37] and experimentally validated the effectiveness of such RT-based components in improving learners’ acquisition and retention [19, 20, 22, 23, 24, 25, 38, 39, 40, 41, 42]. For instance, Sense and van Rijn [42] incorporated the learner’s observed RT to adjust the model’s parameter controlling the decay rate of a specific item and showed that RT is informative and can significantly contribute to predicting recall. Their results showed that the scheduling algorithm incorporating the RT information results in higher retention than the random presentation schedule. Similarly, Mettler and colleagues [25] assumed that compared to slow correct RT, faster correct RT for a specific item reflects the learner has stronger learning strength of the item. Thus, in their adaptive response time-based sequencing system (ARTS), items that have been answered correctly and quickly would be repeated in a longer recurrence interval for the learner. Consequently, the ARTS system outperforms the Atkinson [4] method in learning efficiency [24]. However, Lindsey et al. [19, 20] pointed out that despite the predictiveness power of learners’ future performance provided by RT, it was redundant with information held in the accuracy. Thus, RT information of learners was not used in their later adaptive scheduling system, DASH [22]. Table 1 briefly summarizes both adaptive scheduling systems incorporating RT information.
System | Theoretical Assumption | Model Mechanic | RT-related features |
|---|---|---|---|
Sense & van Rijn [42] | Strength theory: Correct response speed positively correlates to memory trace strength [27] | ACT-R declarative memory module [2, 33] | A parameter (α) represents the decay rate of memory traces |
Mettler et al. [25] | Learning strength: A hypothetical construct related to probability of future successful recall | Adaptive Response Time-Based Sequencing (ARTS) | Priority Score for items that have been answered correctly |
In summary, from a theoretical perspective, RT-related features are informative for capturing facets of individual differences, such as the memory strengths of items during practice. In practical applications, whether the prediction of learning models can be improved after incorporating RT-related features still needs further exploration due to the noisy nature of RT data in many applications. Therefore, in the current research, we investigated if the predictiveness of the standard PFA model can be improved by incorporating the learner’s correct RT history. Specifically, we focused on estimating the learner’s fluent RT after reaching the automatic response level, then compared the learner’s correct RT during learning with their estimated fluent RT to capture the strength changes of memory traces.
METHOD
Performance Factors Analysis
Performance factors analysis (PFA) is a logistic regression model using learners’ prior practice performance on knowledge components (KC) to estimate their future probability of a correction [32]. A KC is defined as a mental structure or process a learner uses alone or in combination with other KCs to solve problems [17] and can be operationalized as facts, concepts, or complex skills depending on the granularity of analyses. In PFA, the learner’s performance, correct and incorrect responses are selected as indicators of learners’ learning processes. The mathematical format for PFA is shown in Equation 1 and Equation 2. Equation 1 captures the strength values for KCs, where represents an individual learner, represents a specific KC, represents the easiness of the KC, represents the ability of the learner, tracks the prior successes for the KC for the learner ( scales the effect of these prior successes count), and tracks the prior failures for the KC for the learner ( scales the effect of these prior failures counts). Equation 2 converts strength values to predictions of correctness probability according to the logistic distribution. Since the standard PFA does not integrate the information provided by learners’ RT, which is also probably a strong indicator of learners’ learning, we believed the modifications we conducted for the standard PFA described in the following sections would be helpful.
(1)
(2)
Variants of PFA with Correct-RT-Related Features
The Exponential Law of Practice
The “law of practice” function describes the relationship between RT and practice opportunities. Many researchers have shown that simple mathematical functions can fit this relationship [3, 13, 28]. Anderson [3] showed that RT is an exponential function of memory activation, and the intercept can capture a learner’s neural integration time and motor response time. Newell and Rosenbloom [28] showed that RT follows a power function of prior practice opportunities. Heathcote and colleagues [13] extensively compared the overall fitting of exponential functions and the power functions across 40 sets of data, and they found that for unaveraged data, such as data from individual learners which were commonly used in adaptive modeling, the exponential function fitted the data better than the power function. As it turns out, averaging exponential functions produces power functions, making these results sensible [3].
Thus, in the present research, to fit the individual learner’s RT as a function of the practice opportunity, we used the exponential function as shown in Equation 3, where represents the expected value of RT on practice opportunity , represents the change in the expected value of RT from the beginning of learning (n = 0) to the end of learning (the xth practice opportunity when the learner reaches their fluent RT), represents the expected value of RT after learning has been completed for the individual learner , and is the rate parameter and controls the amount of nonlinearity displayed by the exponential function.
(3)
Our main goal was to estimate the value of for the individual learner , which represents the RT needed for the learner to perform fluently (fluentRT). In other words, we assumed that if the learner truly mastered the materials, no retrieval time would be included in implying an automatic response that captures a learner’s neural integration time and motor response time. The estimation was conducted using the optim function from the ‘stats’ R package [35].
Correct-RT-Related Features and PFA Variants
After having the estimated fluentRT value of each learner, we need other correct RT information from the learner’s practice history to calculate predictive components to examine whether incorporating such correct-RT-related features added to the standard PFA improves its predictiveness. We followed the method used by Eglington and Pavlik [10]. For each learner , for each KC , and each trial , a median trial RT was calculated from the previous trials for which the learner was correctly answered. For the first trial for a specific learner, and all trials before a correct response had been produced, the value was set to zero (hereafter, this value was named mediancorRT). A dummy variable (dummy) was also created and also added to the model. The dummy captures the performance difference between first trials and other consecutive wrong trials at the beginning of the practice session where calculating the mediancorRT is impossible. For example, suppose the learner’s responses are (wrong, wrong, wrong, wrong, correct with latency 4000ms) for the first five trials for the same KC. In that case, the calculation for this learner’s running mediancorRT is (0, 0, 0, 0, 4000), where the corresponding dummy code for the learner’s first five responses was (1, 1, 1, 1, 0). This dummy provides a baseline for all trials before the first correct result, which offsets the value of 0 that is needed to predict the correct latency effect (0 since there has been no correct latency). Since we cannot use 0 for these trials (since it is just a placeholder), we need this dummy to characterize the baseline performance when we have no correct prior trials for the KC. Indeed, by itself, the dummy provides some small improvement since it marks a one-time increase in the prediction after the first correct response is counted. The main purpose, however, is to allow the coefficient for the effect of the prior correct median to be fit freely without the 0 placeholder data values affecting this result.
According to the above correct RT-related component mediancorRT, we computed a new feature to capture how the learner’s correct RT during the practice process fluctuates around their estimated ideal fluentRT. The logic behind this feature calculation is that if a learner’s correct RT fluctuation for a specific KC is large, even if they just answered the question correctly, the memory traces for the KC maybe still unstable, and the learner probably needs more practice trials on the same KC. The calculation is straightforward, for each learner , for each trial , the fluentRT is subtracted from the mediancorRT. The new feature is labeled as fmediancorRT.
Logistic Knowledge Tracing (LKT) package in R
For logistic regression models, like PFA, the additive nature of features increases their flexibility, making it easy for researchers to add new or drop out old features and build their models. We used the ‘LKT’ package [30], which makes the logistic model-building and parameter-searching processes simpler by reducing high-level technical skills and knowledge demands for researchers. For example, the models in this paper were run with single calls to LKT following the data preparation for latency analysis. The LKT code has been publicly shared as an R package in GitHub, and examples with detailed notes are available for reference [31].
Datasets and Data Preprocessing
The model comparison was conducted across several datasets to examine the improvement from the addition of the correct RT-related features we mentioned above. For calculating the mediancorRT and the estimation of fluentRT, the dataset needs to include a column identifying the time elapsed between the start of the presentation of the specific practice trial and the response reaction made by the individual learner. We used the time from the first seeing the question to the learner’s first action as our RT measurement by assuming that this time duration reflected the learner’s retrieval time. Specifically, for multiple-choice questions, the learners’ response was measured by the mouse click; for short-answer and cloze questions, the response duration was from the first keypress. Furthermore, for fitting logistic models in LKT, columns are required to identify the learners’ deidentified id, response accuracy (correct or incorrect), KC id, and the practice opportunity of each KC for the individual learner. We expected that the model predictiveness improvement after incorporating RT-related features should generalize across datasets with different learning materials and formats of practice trials.
The same data preprocessing criteria were applied to all datasets by adopting the procedure of Pavlik and colleagues [30]. Within each dataset, students with less than 25 observations were omitted. KCs with less than 300 observations overall were also omitted. Extreme correct RT outliers (>95th percentile) were winsorized to equal the 95th percentile correct RT values. Missing RT values were imputed with the overall median trial duration for the student. Observations relevant to instructions, learning and review trials, or hints were omitted since we focused on RT values from learners’ practice attempts for this study. Furthermore, learners whose accuracy values during the practice session were less than the probability of a random guess were omitted (less than 25%). We used 25% as a general accuracy criterion to maintain consistency across all datasets.
Dataset1. Chinese Vocabulary Pronunciation Memory Multiple-Choice Questions
Dataset 1 was from an experiment designed to explore the best practice context and review spacing schedule for learners to remember the pronunciation of foreign vocabulary words. The learning materials were 27 aural Chinese words. The experiment was conducted by using an online Flashcard learning system. Participants were recruited from Amazon’s Mechanical Turk. The format of practice trials was multiple-choice. For each trial, learners were asked to select the correct meaning of the aural Chinese word they had just heard. Learners have 5 seconds to make their choice. Correct answers were provided for learners after their incorrect attempts, and they were encouraged to learn from the feedback within 5 seconds. The 5-second response threshold was chosen because for such a simple task it results in very little truncation of the latency distribution and prevents outlier data from being collected, preferring to mark such unlikely long-duration responses wrong [29]. One Chinese word pronunciation was seen as a unique KC. After data cleaning, 190 learners and a total of 39,282 observations, of which 23,981 correct observations were retained in dataset 1.
Dataset 2. Japanese-English Word Pairs Short Answer Questions
Dataset 2 was from an experiment in optimal learning [9], Experiment 2. The experiment was designed to investigate the effectiveness of an optimal difficulty threshold adaptive scheduling for improving learners’ memory retention. The learning materials were 30 Japanese-English word pairs. Participants were recruited from Amazon’s Mechanical Turk. All practice trials were short-answer questions, and learners were asked to type in English translations after seeing Japanese words. One unique Japanese-English word pair was seen as a unique KC. The initial dataset included 72,455 observations from 291 adult learners, after data cleaning, 262 learners and a total of 59,885 observations were retained in the dataset, of which 42,482 correct observations were retained.
Dataset 3. Statistics Content Cloze Questions
Dataset 3 from practice with cloze sentences about introductory statistics was downloaded from the Memphis Datashop repository (https://datashop.memphis.edu) [16]. The experiment was designed to explore the effect of spacing schedules and repetition of KCs on learners’ memory of simple statistical concepts. The learning materials were 36 sentences about different statistical concepts. Participants were recruited from Amazon’s Mechanical Turk. All practice trials were cloze items, and learners were asked to type in the missing word for each sentence. The initial dataset consisted of 58,316 observations from 478 learners. After data screening, 462 learners and a total of 53,277 observations were retained, of which 29,708 were correct observations.
Results
The fluentRT Estimation Results
Within each dataset, we used Equation 3 and the optim function from the ‘stats’ R package [35] to estimate the ideal fluentRT value for each learner. We also calculated the correlation between the learners’ estimated fluentRT and their average RT during the practice session (averageRT). Table 2 shows the descriptive statistics and correlation test results for all three datasets.
Dataset | FluentRT M (SD) | AverageRT M (SD) | FluentRT and AverageRT correlation |
|---|---|---|---|
1 | 1381.717 (558.811) | 1917.562 (655.858) | 0.898*** |
2 | 2442.846 (855.596) | 3231.382 (1132.548) | 0.934*** |
3 | 3883.096 (956.854) | 5910.799 (1215.972) | 0.908*** |
Note. *** p <.001
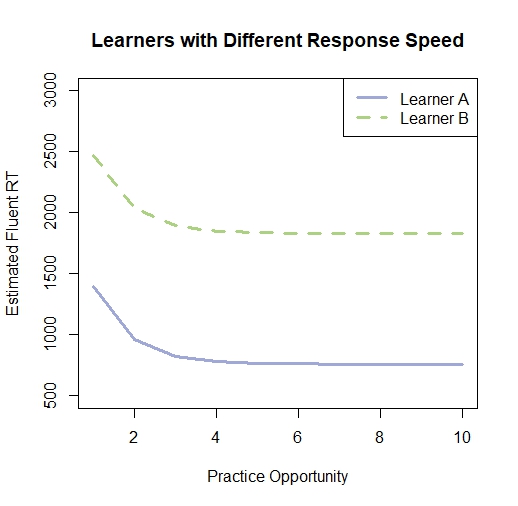
First, we found a highly positive correlation between the learner’s estimated neural integration time (fluentRT) and motor response time , and the learner’s averageRT during the practice session in all datasets. The consistent highly positive correlation suggested that learners’ averageRT reflected their neural integration time and motor response time which is reasonable since the individual differences in neurons’ response speed. Second, individual differences in neural integration time and motor response time were observed from the fluentRT. For instance, the estimated fluentRT of two learners with different response speed tendencies from Dataset 1(the multiple-choice dataset) was shown in Figure 1. It was clear that learner A tended to respond faster than learner B. Based on each learner’s correct RT history, the estimated neural integration time and motor response time for learner A was only 759.56 milliseconds, while for learner B, 1830.72 milliseconds corresponded to fluent responding.
Model Fit and Comparison Results
Five models were fitted to the three datasets. Table 3 shows the features included in each model. The $ operator produces a unique coefficient for each learner and each KC. For example, the ‘intercept$learner’ feature fits a unique intercept for each learner. While for features without the $ operator, a single coefficient would be fit for the feature. All features shown in Table 3 represent independent variables in logistic regression. The third model (PFAdummy) we built here was used as a baseline model to split the unique effects of RT-related features, mediancorRT and fmediancorRT, which we were most interested in.
Model | Features |
|---|---|
1_PFA | intercept$learner + intercept$KC + linesucKC + linefailKC |
2_PFAfluentRT | intercept$learner + intercept$KC + linesucKC + linefailKC + fluentRT$learner |
3_PFAdummy | intercept$learner + intercept$KC + linesucKC + linefailKC + dummy |
4_PFAmediancorRT | intercept$learner + intercept$KC + linesucKC + linefailKC + dummy + medianRT$learner |
5_PFAfmediancorRT | intercept$learner + intercept$KC + linesucKC + linefailKC + dummy + fmedianRT$learner |
Table 4 shows the model comparison and five-fold unstratified cross-validation results. According to McFadden’s R2 and Akaike information criterion (AIC) values, we can examine whether the predictiveness of standard PFA is improved after incorporating RT-related features. By inspecting the averaged R2 after 5-fold cross-validation, we want to ensure that the improvement is not caused by over-fitting.
Model | Model Comparision | ||
|---|---|---|---|
R2 (AIC) | Δ R2 (Δ AIC) | CV R2 | |
Multiple-Choice Dataset | |||
PFA | 0.1082 (47273.57) | - | 0.0984 |
PFAfluentRT | 0.1082 (47275.56) | - | 0.0984 |
PFAdummy | 0.1315 (46053.14) | 0.0233 (-1220.43) | 0.1215 |
PFAmediancorRT | 0.1417 (45516.02) | 0.0102 (-537.11) | 0.1318 |
PFAfmediancorRT | 0.1438 (45409.95) | 0.0123 (-643.18) | 0.1338 |
Short-Answer Dataset | |||
PFA | 0.1966 (58704.92) | - | 0.1855 |
PFAfluentRT | 0.1966 (58706.92) | - | 0.1855 |
PFAdummy | 0.2133 (57503.39) | 0.0166 (-1201.53) | 0.2022 |
PFAmediancorRT | 0.2217 (56898.67) | 0.0084 (-604.71) | 0.2105 |
PFAfmediancorRT | 0.2163 (57287.38) | 0.0030 (-216.00) | 0.2052 |
Cloze Dataset | |||
PFA | 0.2752 (54229.77) | - | 0.2564 |
PFAfluentRT | 0.2752 (54232.25) | - | 0.2564 |
PFAdummy | 0.2920 (53002.99) | 0.0168 (-1226.78) | 0.2728 |
PFAmediancorRT | 0.2929 (52940.5) | 0.0008 (-62.49) | 0.2736 |
PFAfmediancorRT | 0.2923 (52979.33) | 0.0003 (-23.65) | 0.2731 |
Note. Δ McFadden's R2 calculates the difference between PFAdummy and PFA; the difference between PFAmediancorRT and PFAdummy; the difference between PFAfmediancorRT and PFAdummy, respectively. Values reflect the pure influence predicted by the mediancorRT and fmediancorRT features.
First, the model comparison results showed that adding the fluentRT feature did not improve the predictiveness of standard PFA much for all three datasets. This suggested that the learner’s overall processing speed contributed little to predicting their future performance. Second, after incorporating the mediancorRT and the fmediancorRT features to model learning-correlated speedup, the predictiveness of the standard PFA was improved most in the Multiple-choice dataset (Dataset 1). At the same time, the improvement was not crucial for both the Short-answer dataset (Dataset 2) and the Cloze-question dataset (Dataset 3). Third, the dummy feature caused stable improvement for the standard PFA model across three datasets, indicating that incorrect trials before the first correct response of the learner, perhaps represented the learner’s encoding phase [44].
Discussion
When predicting learners’ future performance, accuracy-based features have been used in various learner modelings, such as knowledge tracing [9, 12] and logistic regression [7, 8, 30, 32]. Recently, some researchers have argued that learners’ response time (RT) during practice is also informative for predicting their future performance [21, 23, 24, 25, 26, 41, 42]. The key theoretical rationale behind such assumptions is the strength theory [27] which emphasizes the positive correlation between the correct RT and the strength of memory traces. Quicker correct responses indicate more stable memory traces have been generated than slower correct responses.
Following the strength assumption, in the present research, we calculated two RT-related features, then investigated how much the predictiveness of the standard performance factor analysis model (PFA) can be improved after combining the learner’s RT history. The first feature, mediancorRT, captures the sequential median correct RT for the specific KC of an individual learner. The second feature, fmediancorRT, captures how the learner’s median correct RT fluctuates around their estimated ideal fluent RT (fluentRT). The fluentRT for each learner is estimated using the exponential law of practice function [13]. The intercept of the exponential function is seen as the fluentRT which represents the neural integration time and motor response time without retrieval time, in other words, the assumption here is that the intercept reflects the minimum RT needed for an individual learner to correctly answer a specific KC after reaching to the automatic level.
Our results show that the improvement of standard PFA by mediancorRT and fmediancorRT features on the learner’s future performance are constrained by the practice questions format. For multiple-choice questions, the observed accuracy perhaps cannot precisely reflect the learner’s latent learning processes since the correct responses might be caused by guessing. Thus, after incorporating RT-related features, such measurement imprecision of accuracy can be somewhat offset, resulting in improvements of predictiveness. While for short-answer and cloze questions, the lack of precision of the latency in representing strength limits the method's effectiveness.
One exciting aspect of the research was the unexpected benefit of using the dummy variable we computed to differentiate trials before the first correct response from trials after a correct response. This improvement is not directly related to reaction time hypotheses we had, and indicates future work is needed to understand this result and its generality (though it was more broadly applicable than the RT terms themselves). We speculate that the dummy feature may trace the transition between stages of learning. Perhaps indicating the student is moving from an encoding to responding stage of learning similar to what has been proposed in cognitive theories of skill acquisition [36, 44]. Another possible underlying construct traced by the dummy feature may be relevant to the moment-to-moment learning proposed by Baker and colleagues for Bayesian knowledge tracing [6]. For instance, the dummy feature which detects the first correct response in a series of responses could indicate a learner's state change between unlearned and learned at a coarse grain size.
Limitations of the present research should be noted here as future research directions. One limitation is the method we used to estimate the learner’s ideal fluentRT. In Equation 3, for simplifying calculations, and values were assumed as the same for all learners across all to-be-learned items to keep the parsimonious model. Consequently, the practice curves for different learners have the same shape and are only different in the vertical y-coordinate direction (see Figure 1). We also estimated the same value for each learner across all items. These simplifications may constrain the implications of RT-related features since the same learner's fluent RT for different items is variable, and more difficult items typically require longer RT than easier items [15]. Thus, in future research, more precise estimated fluentRT values for each specific KC may be required before incorporating RT-related features in the real-time adaptive scheduling system. Another limitation in the current research is that our results are most relevant to simple-fact memory tasks. Thus, one further research direction is how to generalize the RT-related features to more complex tasks such as arithmetic. However, different from simple memory tasks, how to accurately decompose learners’ RT data to precisely reflect their cognitive processes involved in complex tasks requires more effort before generating the RT-related features.
ACKNOWLEDGMENTS
This work was partially supported by the National Science Foundation Learner Data Institute (NSF #1934745).
REFERENCES
- Anderson, J. R. 1981. Interference: The relationship between response latency and response accuracy. Journal of Experimental Psychology: Human Learning and Memory, 7, 5, 326–343. DOI= https://doi.org/10.1037/0278-7393.7.5.326.
- Anderson, J. R., & Schooler, L. J. 1991. Reflections of the environment in memory. Psychological Science, 2, 6, 396–408. DOI= https://doi.org/10.1111/j.1467-9280.1991.tb00174.x.
- Anderson, R. B. 2001. The power law as an emergent property. Memory & Cognition, 29, 7, 1061–1068. DOI= https://doi.org/10.3758/bf03195767.
- Atkinson, R. C. 1972. Ingredients for a theory of instruction. American Psychologist, 27, 10, 921–931. DOI= https://doi.org/10.1037/h0033572.
- Baker, R.S.J.d., Corbett, A.T., Aleven, V. 2008. More accurate student modeling through contextual estimation of slip and guess probabilities in Bayesian knowledge tracing. In: Woolf, B.P., Aïmeur, E., Nkambou, R., Lajoie, S. (eds) Intelligent Tutoring Systems. ITS 2008. Lecture Notes in Computer Science, vol 5091. Springer, Berlin, Heidelberg. DOI= https://doi.org/10.1007/978-3-540-69132-7_44.
- Baker, R. S., Goldstein, A. O., & Heffernan, N. T. 2011. Detecting learning moment-by-moment. Artificial Intelligence in Education, 21(1), 5–25. DOI= https://doi.org/10.3233/jai-2011-015
- Cen, H., Koedinger, K., & Junker, B. 2006. Learning factors analysis: A general method for cognitive model evaluation and improvement. Intelligent Tutoring Systems, vol 4053, 164–175. DOI= https://doi.org/10.1007/11774303_17.
- Chi, M., Koedinger, K. R., Gordon, G. J., Jordan, P. W., & VanLehn, K. 2011. Instructional factors analysis: A cognitive model for multiple instructional interventions. Educational Data Mining, 61–70. DOI= https://doi.org/10.1184/r1/6475808.v1.
- Corbett, A. T., & Anderson, J. R. 1995. Knowledge tracing: Modeling the acquisition of procedural knowledge. User Modelling and User-Adapted Interaction, 4, 4, 253–278. DOI= https://doi.org/10.1007/bf01099821.
- Eglington, L. G., & Pavlik Jr, P. I. 2020. Optimizing practice scheduling requires quantitative tracking of individual item performance. Npj Science of Learning, 5, 1. DOI= https://doi.org/10.1038/s41539-020-00074-4.
- Eglington, L. G., & Pavlik, Jr, P. I. 2019. Predictiveness of prior failures is improved by incorporating trial duration. Journal of Educational Data Mining, 11, 2, 1–19. DOI= https://doi.org/10.5281/zenodo.3554675.
- Gervet, T., Koedinger, K. R., Schneider, J., & Mitchell, T. M. 2020. When is deep learning the best approach to knowledge tracing. Educational Data Mining, 12, 3, 31–54. DOI= https://doi.org/10.5281/zenodo.4143614.
- Heathcote, A., Brown, S., & Mewhort, D. J. K. 2000. The power law repealed: The case for an exponential law of practice. Psychonomic Bulletin & Review, 7, 2, 185–207. DOI= https://doi.org/10.3758/bf03212979.
- Housen, A., & Kuiken, F. 2009. Complexity, accuracy, and fluency in second language acquisition. Applied Linguistics, 30, 4, 461–473. DOI= https://doi.org/10.1093/applin/amp048.
- Judd, W. A., & Glaser, R. 1969. Response latency as a function of training method, information level, acquisition, and overlearning. Journal of Educational Psychology, 60, 4, Pt.2, 1–30. DOI= https://doi.org/10.1037/h0020058.
- Koedinger, K. R., Baker, R.S.J.d., Cunningham, K., Skogsholm, A., Leber, B., Stamper, J. 2010. A Data Repository for the EDM community: The PSLC DataShop. In Handbook of Educational Data Mining. Romero, C., Ventura, S., Pechenizkiy, M., Baker, R.S.J.d. (Eds.). Boca Raton, FL: CRC Press.
- Koedinger, K. R., Corbett, A. T., & Perfetti, C. 2012. The knowledge-learning-instruction framework: Bridging the science-practice chasm to enhance robust student learning. Cognitive Science, 36, 5, 757–798. DOI= https://doi.org/10.1111/j.1551-6709.2012.01245.x.
- Krasne, S., Stevens, C. D., Kellman, P. J., & Niemann, J. T. 2020. Mastering electrocardiogram interpretation skills through a perceptual and adaptive learning module. AEM Education and Training, 5, 2. DOI= https://doi.org/10.1002/aet2.10454.
- Lindsey, R. 2014. Probabilistic models of student learning and forgetting (Doctoral dissertation, University of Colorado at Boulder).
- Lindsey, R., Mozer, M. C., Cepeda, N. J., & Pashler, H. 2009. Optimizing memory retention with cognitive models. In 9th International Conference on Cognitive Modeling (ICCM), A. Howes, D. Peebles, & R. Cooper, Eds. Manchester, UK: ICCM, 74–79.
- Lindsey, R. V., Lewis, O., Pashler, H., & Mozer, M. C. 2010. Predicting students’ retention of facts from feedback during training. In Proceedings of the 32nd annual conference of the cognitive science society S. Ohlsson & R. Catrambone, Eds. Austin, TX: Cognitive Science Society, 2332–2337.
- Lindsey, R. V., Shroyer, J. D., Pashler, H., & Mozer, M. C. 2014. Improving students’ long-term knowledge retention through personalized review. Psychological Science, 25, 3, 639–647. DOI= https://doi.org/10.1177/0956797613504302.
- Mettler, E., & Kellman, P. J. 2014. Adaptive response-time-based category sequencing in perceptual learning. Vision Research, 99, 111–123. DOI= https://doi.org/10.1016/j.visres.2013.12.009.
- Mettler, E., Massey, C. M., & Kellman, P. J. 2016. A comparison of adaptive and fixed schedules of practice. Journal of Experimental Psychology: General, 145, 7, 897–917. DOI= https://doi.org/10.1037/xge0000170.
- Mettler, E., Massey, C. M., & Kellman, P. J. 2010. Improving adaptive learning technology through the use of response times. Cognitive Science, 33, 33. DOI= https://escholarship.org/content/qt2xs4n8wz/qt2xs4n8wz.pdf?t=op2jwo.
- Mozer, M. C., & Lindsey, R. V. 2016. Predicting and improving memory retention: Psychological theory matters in the big data era. Big Data in Cognitive Science, 43–73. DOI= https://doi.org/10.4324/9781315413570-8.
- Murdock, B. B. 1985. An analysis of the strength-latency relationship. Memory & Cognition, 13, 6, 511–521. DOI= https://doi.org/10.3758/bf03198322.
- Newell, A. & Rosenbloom, P. S. 1993. Mechanisms of skill acquisition and the law of practice. In The Soar Papers (Vol. 1): Research on Integrated Intelligence, 81–135 (MIT Press).
- Pavlik, P. I. 2007. Understanding and applying the dynamics of test practice and study practice. Instructional Science, 35(5), 407–441.DOI= https://doi.org/10.1007/s11251-006-9013-2
- Pavlik Jr, P., Eglington, L., & Harrell-Williams, L. 2021. Logistic knowledge tracing: A constrained framework for learner modeling. IEEE Transactions on Learning Technologies, 14, 5, 624–639. DOI= https://doi.org/10.1109/tlt.2021.3128569.
- Pavlik Jr, P., Eglington, L. "LKT." github.com. https://github.com/Optimal-Learning-Lab/LKT (accessed Dec. 1, 2020).
- Pavlik Jr, P., Cen, H., & Koedinger, K. R. 2009. Performance factors analysis: A new alternative to knowledge tracing. Artificial Intelligence in Education, 1, 531–538. DOI= https://doi.org/10.3233/978-1-60750-028-5-531.
- Pavlik Jr, P. I., & Anderson, J. R. 2008. Using a model to compute the optimal schedule of practice. Journal of Experimental Psychology: Applied, 14, 2, 101–117. DOI= https://doi.org/10.1037/1076-898x.14.2.101.
- Rasch, G. 1966. An individualistic approach to item analysis. In Readings in mathematical social science, Lazarsfeld PF, Henry NW, editors. Chicago: Science Research Associates; 89-108.
- R Core Team. 2020. R: A language and environment for statistical computing [Computer software]. R Foundation for Statistical Computing. http://www.R-project.org/
- Rickard, T. C. 1997. Bending the power law: A CMPL theory of strategy shifts and the automatization of cognitive skills. Journal of Experimental Psychology: General, 126, 3, 288–311. DOI= https://doi.org/10.1037/0096-3445.126.3.288.
- Ritter, S., Yudelson, M., Fancsali, S. E., & Berman, S. R. 2016. How mastery learning works at scale. In Proceedings of the Third (2016) ACM Conference on Learning@ Scale, 71-79.
- Schmucker, R., Wang, J., Hu, S., & Mitchell, T. 2022. Assessing the performance of online students - new data, new approaches, improved accuracy. Journal of Educational Data Mining, 14, 1, 1–45. DOI= https://doi.org/10.5281/zenodo.6450190.
- Sense, F., van der Velde, M., & van Rijn, H. 2021. Predicting university students’ exam performance using a model-based adaptive fact-learning system. Journal of Learning Analytics, 8, 3, 155–169. DOI= https://doi.org/10.18608/jla.2021.6590.
- Sense, F., Meijer, R. R., & van Rijn, H. 2018. Exploration of the rate of forgetting as a domain-specific individual differences measure. Frontiers in Education, 3. DOI= https://doi.org/10.3389/feduc.2018.00112.
- Sense, F., Behrens, F., Meijer, R. R., & van Rijn, H. 2016. An individual’s rate of forgetting is stable over time but differs across materials. Topics in Cognitive Science, 8, 1, 305–321. DOI= https://doi.org/10.1111/tops.12183.
- Sense, F., & van Rijn, H. 2022. Optimizing fact-learning with a response-latency-based adaptive system. DOI= https://doi.org/10.31234/osf.io/chpgv.
- Shih, B., Koedinger, K., & Scheines, R. 2010. A response time model for bottom-out hints as worked examples. In Proceedings of the 1st International Conference on Educational Data Mining, R. S. Baker and J. E. Beck Eds., Montreal, Canada, 117-126.
- Tenison, C., Fincham, J. M., & Anderson, J. R. 2016. Phases of learning: How skill acquisition impacts cognitive processing. Cognitive Psychology, 87, 1–28. DOI= https://doi.org/10.1016/j.cogpsych.2016.03.001.
© 2023 Copyright is held by the author(s). This work is distributed under the Creative Commons Attribution-NonCommercial-NoDerivatives 4.0 International (CC BY-NC-ND 4.0) license.