ABSTRACT
The goal of this paper is to gain insight into the problem-solving practices and learning progressions by analyzing the log data of how middle school and college players navigate various levels of Baba Is You, a puzzle-based game. In this paper, we first examine features that can capture the problem-solving practices of human players in early levels. We then examine how these features can predict players’ learning progressions and their performance in future levels. Based on the results of the current quantitative analyses and grounded in our previous in-depth qualitative studies, we propose a novel metric to measure the problem-solving capability of students using log data. In addition, we train artificial intelligence (AI) agents, particularly those utilizing Reinforcement Learning (RL), to solve Baba Is You levels, contrast human and AI learning progressions, and discuss ways to bridge the gap between them.
Keywords
1. INTRODUCTION
1.1 Problem-solving & Log Data
There is ubiquitous agreement that problem-solving is an important goal of STEM education [8, 4, 3]. However, there is little agreement as to what features compose effective problem-solving or how to teach and measure these features [14]. Advancements in AI and human behavior analysis introduce the possibility of identifying these features, capturing problem-solving performance in rich detail, and consequently providing problem-solvers with just-in-time feedback and scaffolding [16]. Several works have tried to accomplish this using log data generated from interaction with a digital environment. For example, Wang et al. [17] have examined how to engineer features from log data to capture the efficacy of problem-solvers’ data collection when solving electric circuit problems. Bumbacher et al.[2] and Perez et al. [13] have used log data to determine how deliberately a person engages in problem-solving related to physics. Here we continue this line of work by using log data of problem-solvers interacting with the puzzle-based game Baba Is You. We also compare the problem-solving processes of human problem-solvers with a standard reinforcement learning agent and discuss the potential underlying causes of these differences.
1.2 Reinforcement Learning & Human Comparisons
It has long been noted human learning behaviors in game environments differ significantly from those of standard Reinforcement Learning (RL) algorithms, with much attention paid to the sample inefficiency of the latter [11]. Tsividis et al. [15] study human learning behaviors in the Arcade Learning Environment (commonly referred to as Atari [1]), and hypothesize a range of mechanisms for their differences with RL algorithms. Human and reinforcement learning behavior and attention [9] as well as neural activity [5] have been also compared within the Arcade Learning Environment. Works have investigated the inclusion of object representations [6] and linguistic grounding [10] so as to close the gap between human and RL behaviors. Dubey et al. [7] compare human and RL algorithm behavior in environments specifically designed to limit the usefulness of human visual priors. Our work, while preliminary, eventually seeks to characterize the sorts of representations and motivations RL systems need in order to engage in human-like problem-solving behaviors in challenging problem-solving environments.
2. METHODS
2.1 Baba Is You
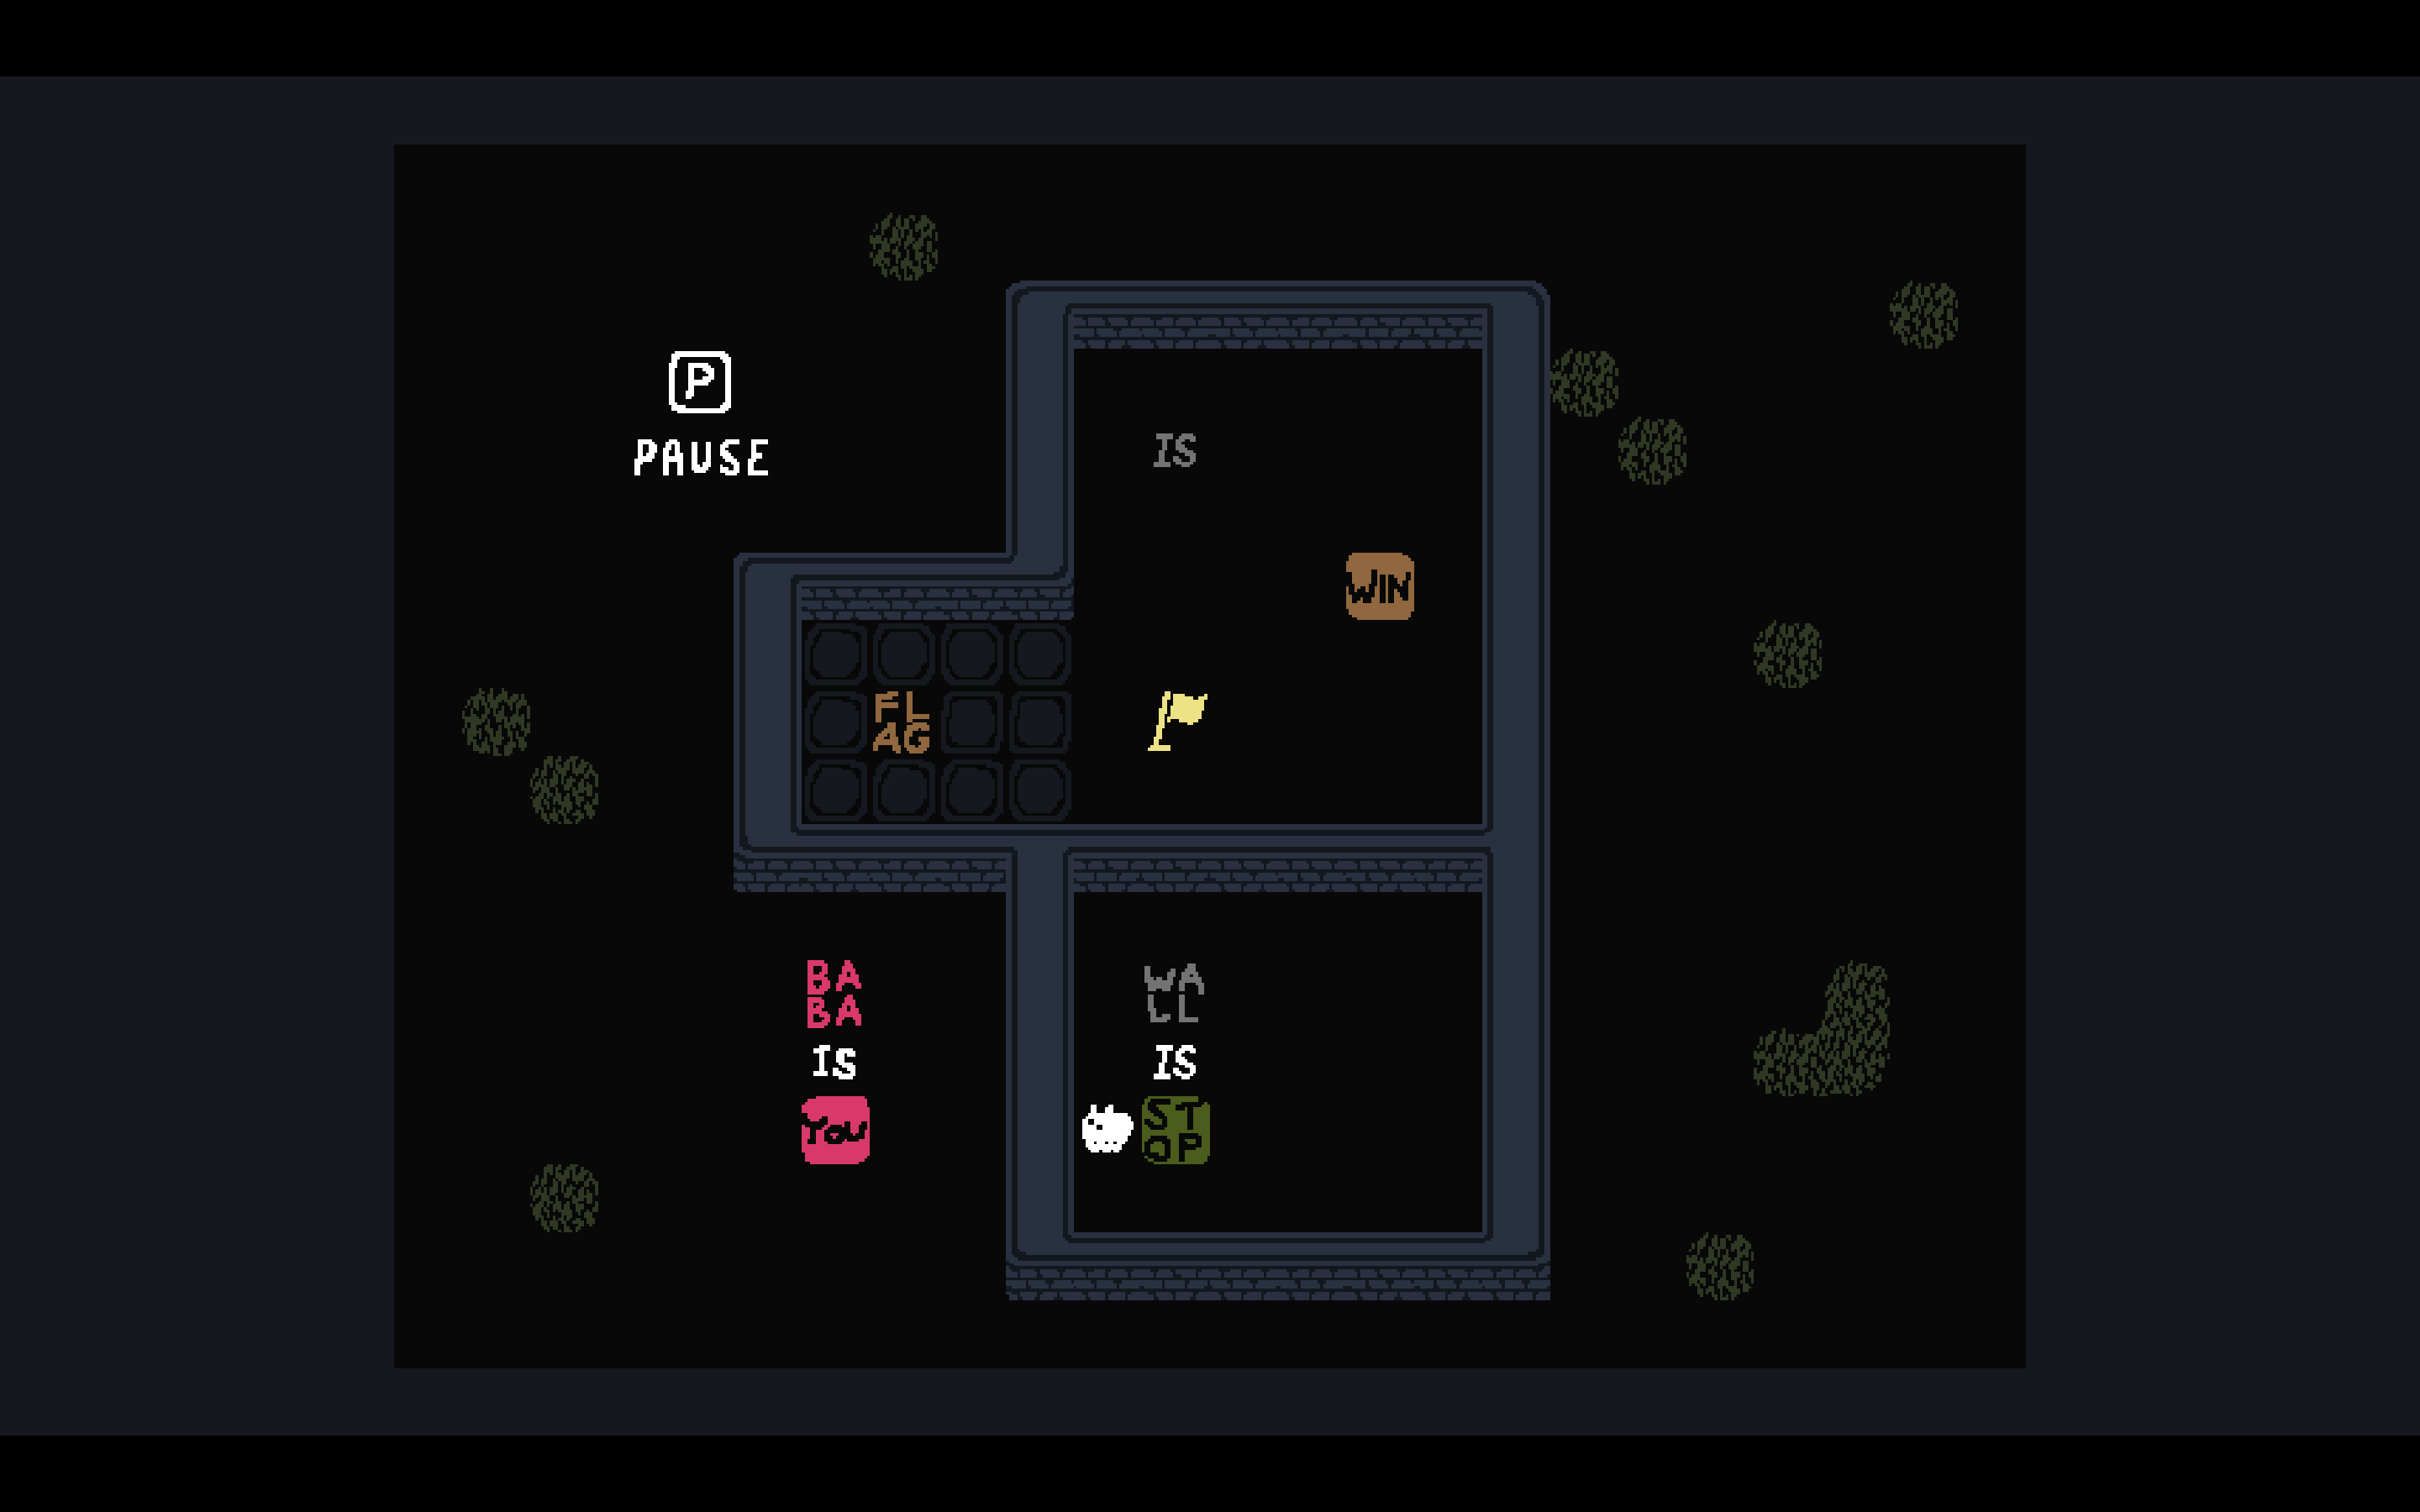
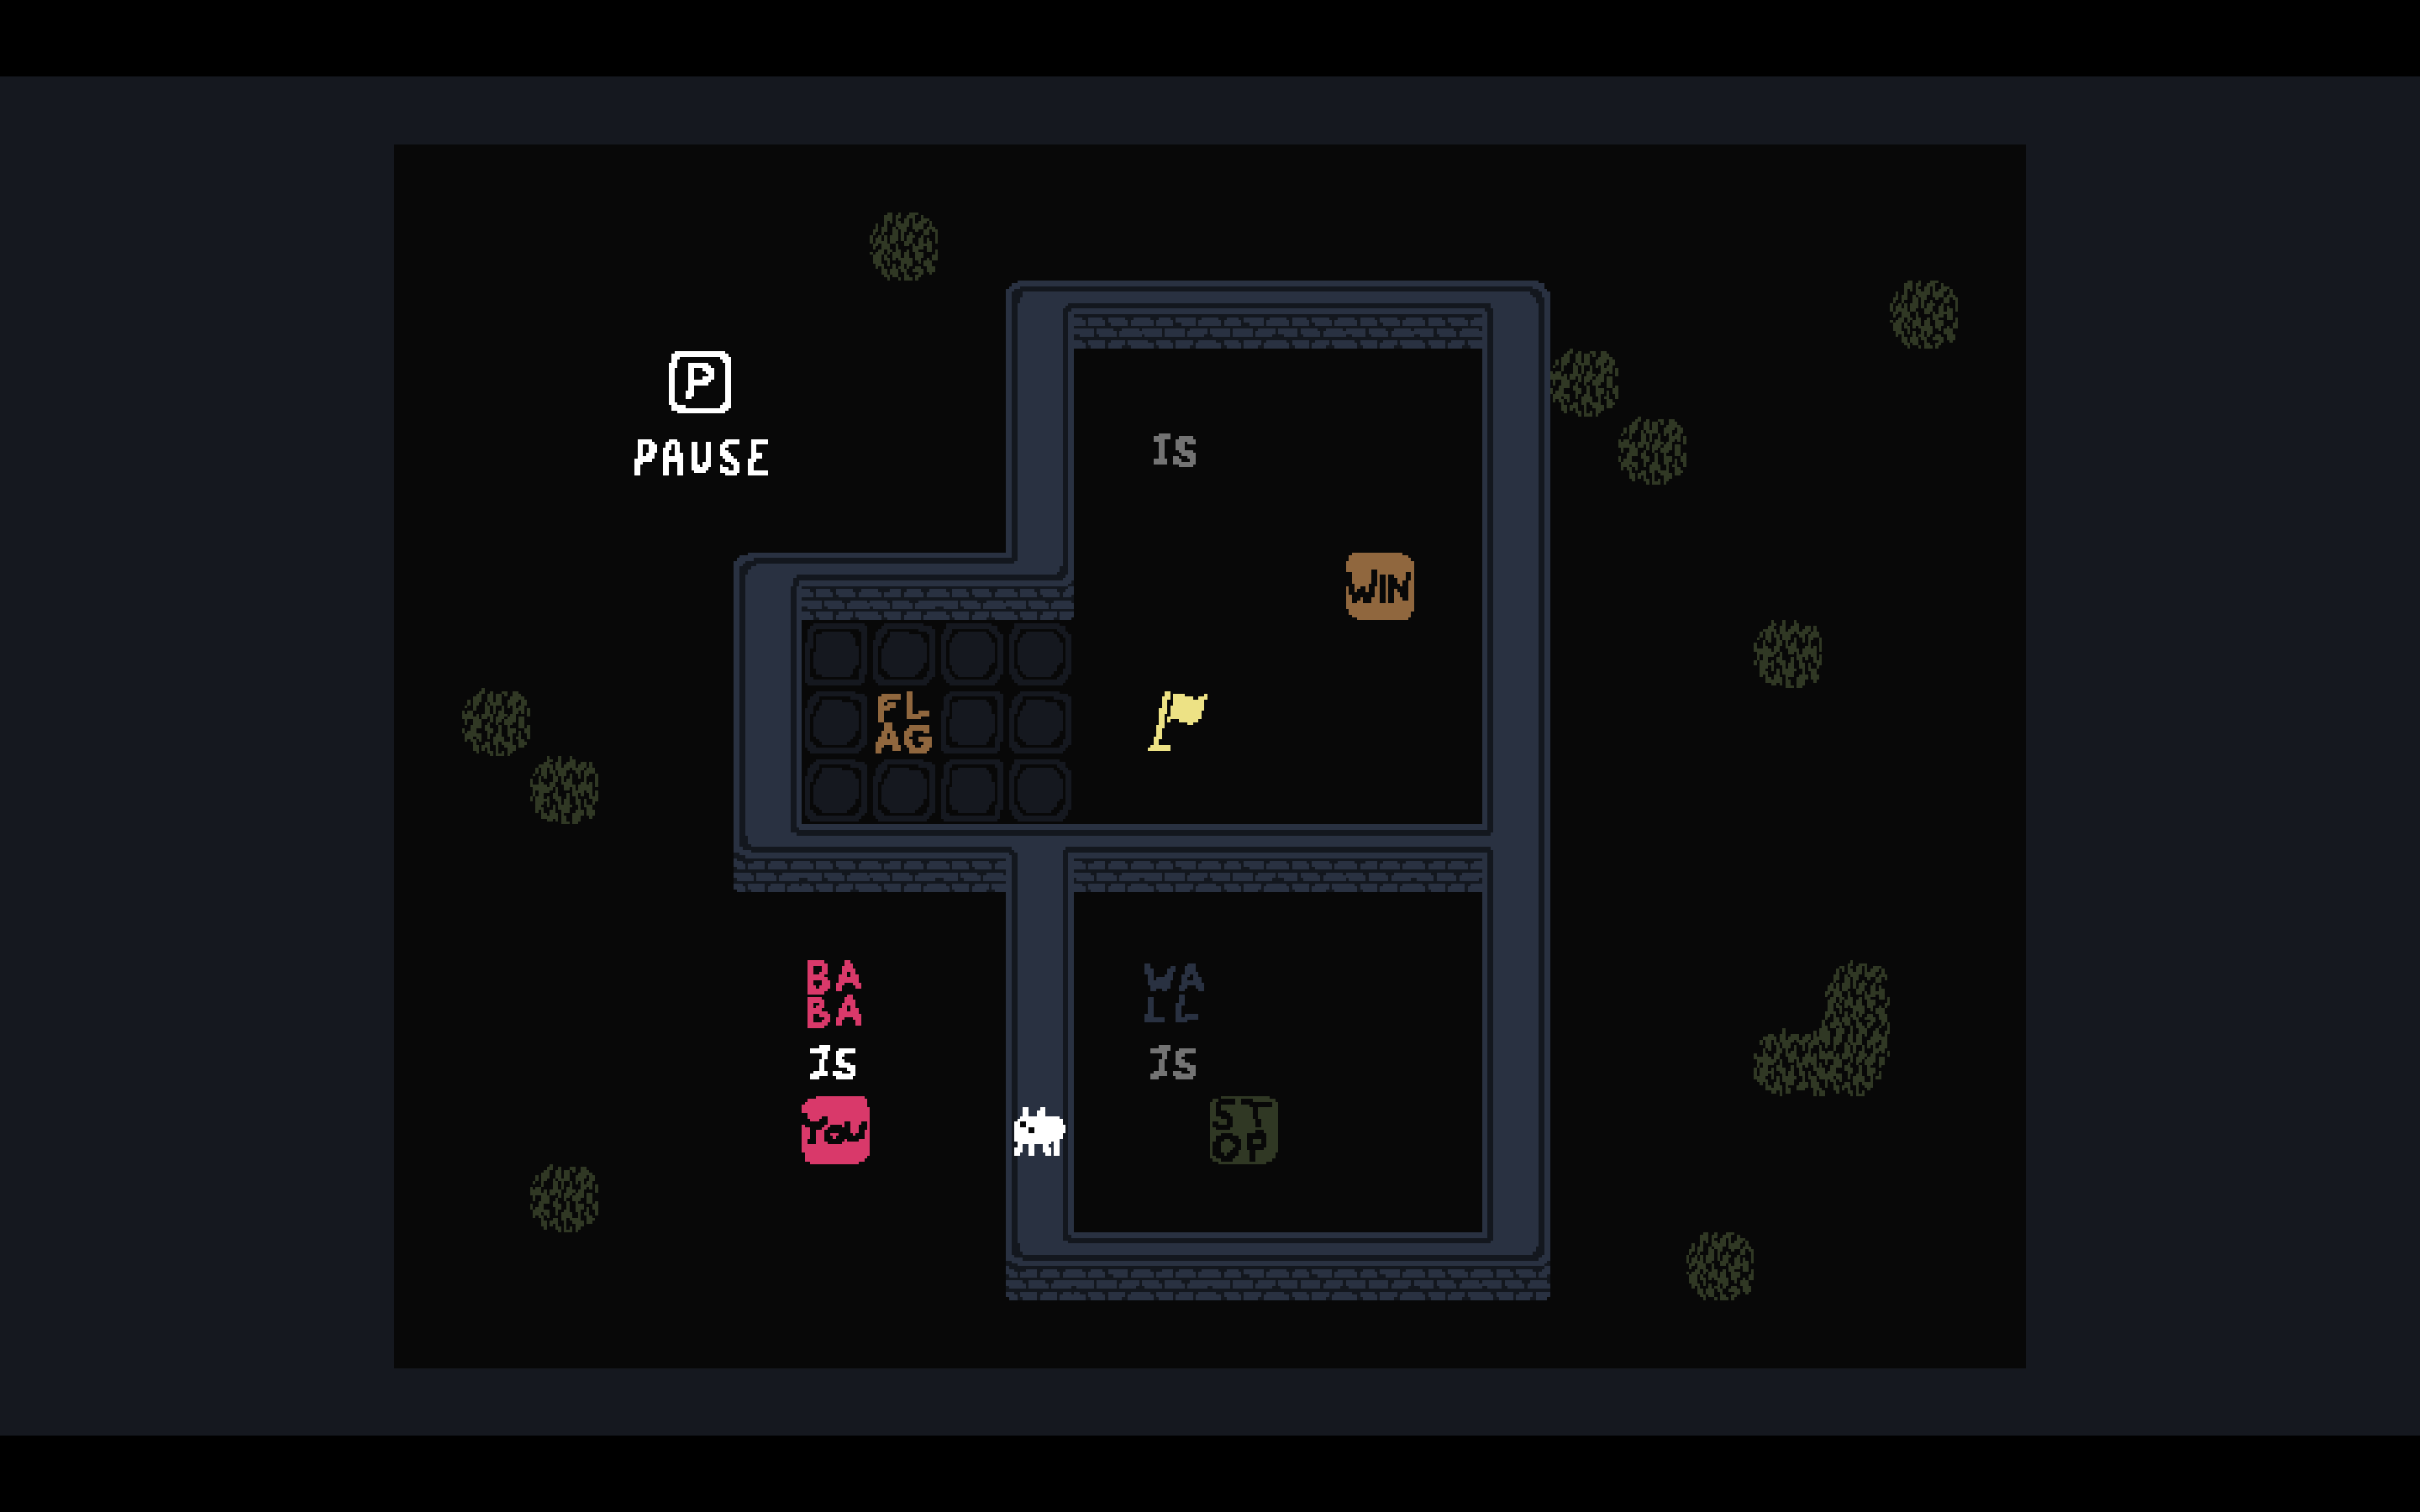
Baba Is You is a puzzle game where players can change the rules by which they play. In Baba Is You, players move Baba, a small sheep-like creature, by pressing keys or buttons/joysticks on a controller to make Baba move up, down, left, or right; players can also reverse their actions in a level or restart the level completely. At every level, the rules themselves are present as text blocks that players can interact with, and by manipulating them, they can change how the level works (see Fig. 1).
The game has various levels, with similar levels grouped into one map. In the beginning, there is a map with 7 tutorial levels that players are required to finish at least 4 of them in order to proceed. Players can then go to the Lake map, which contains 13 normal and 2 extra challenge levels. For all following maps, to unlock the next map, players have to finish at least 8 levels. Map 1 (The Lake) can only be followed by Map 2 (Solitary Island); Map 2 by both Map 3 (Temple Ruins) and Map 4 (Forest of Fall). Finally, after Map 3, players can proceed to all the other maps.
2.2 Participants
Middle school students (n = 54) and college students (n = 113) were recruited via online flyers to participate in the study. We recruited both groups of players to capture a potential range of prior problem-solving expertise. All participants had never played Baba Is You before. Each participant was asked to play the game for three separate sessions. Sessions last up to 150 minutes, and during these sessions, players played as many levels as they wished. They were not required to finish each level they attempted, and they did not have to play a fixed set of levels. Both middle school and college students finished all tutorial levels and some levels from early maps.
2.3 Dataset
2.3.1 Log Data
We extracted game log data, which has the timestamps of all player inputs, all game events (e.g., rule-add, rule-remove, no-you) that happened because of player inputs (e.g., left, right, down, up), and the number of the levels completed by each student at any given timestamp.
2.3.2 Survey Data
We surveyed participants about their age, grade, and general computer gaming experience, as well as self-reported scores on factors such as approach toward failure and self-efficacy via an online survey after all play sessions ended.
2.3.3 Aggregated Data
We created one large aggregated dataset that stores the IDs of the students, their survey answers, the length of their play sessions, the average amount of time they spent on each level, as well as some simple aggregated count features extracted from the log data such as the overall number of restarts, undo.
3. ANALYSIS
3.1 Exploratory Data Analysis
Our goal is to develop a model that predicts student performance on later levels from interpretable variables on earlier levels — such interpretability is crucial for future scaffolding interventions which use this model. Standard feature selection methods from all log data features for this predictive problem may sacrifice such interpretability. Hence, we first explore what features from aggregated data are most predictive of a simplified overall problem-solving progression proxy: the number of levels completed. Then, for predicting future problem-solving performance, we layer in additional level-based features.
3.1.1 Predicting Overall Problem-solving Progression
To predict overall problem-solving progression, the aggregated features used are: the number of levels tried, the number of undo inputs, the number of restart inputs, the number of “no you" states (when the player has no controllable representation in the game due to having dismantled "X IS YOU" for all objects X and has no possible moves other than restart or undo), the average session time, the player’s game experience level, and their school grade. To examine which features significantly predict the learning progress of students as operationalized by the number of levels completed, we implement k-fold cross-validated linear regression with intercept: \[Y = \beta _0 + \beta _1 X +\epsilon \] Here, X denotes any single feature after standardization,(mean 0, sd 1) and Y denotes the number of completed levels. For this k-fold cross-validated linear regression, we use cross-validated \(R^2\) to measure the goodness of fit. For this analysis, we took \(k=10\). We then choose the most important features, as measured by goodness of fit in this analysis, for predicting future problem-solving performance in the subsequent logistic regression analysis as described below.
3.1.2 Predicting Future Problem-solving Performance
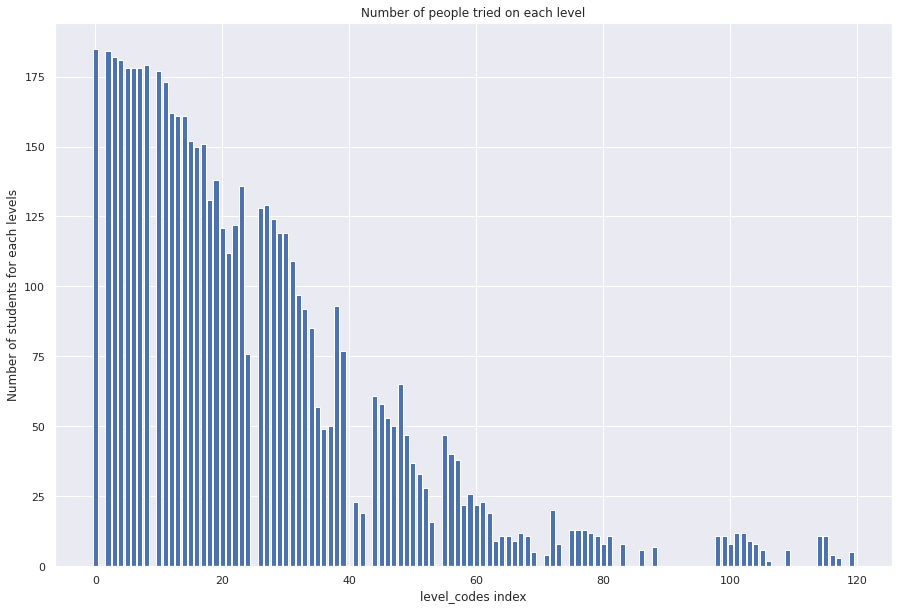
Because of the small sample size and the distribution of students who tried each level (shown in Fig. 2), we only extract input features from the initial levels for which at least 150 students have attempted (all levels before Lake-9). Then, we build models predicting future performance based on input features from three groups of initial levels: all finished levels before level Lake-9 (‘all-previous’), the eight hardest levels finished before level Lake-9 (‘8-hardest’), and from the first and last levels before level Lake-9 (‘first-and-last’). We use features found to be predictive in the preceding linear regression analysis (Section 3.1.1), and use the performance of students in these features in the selected initial levels to predict students’ problem-solving performance in future levels. We use the selected features from overall problem-solving progression prediction as model inputs for this future performance prediction in two different ways: using averages across previous levels, labeled as average values, or including separately all the values of the selected features from the previous levels, labeled as progressive values.
To make future performance prediction tractable, we categorize students into ‘high’ and ‘low’ performance and predict these coarse-grained outcomes. To categorize students’ performance in a given collection of future levels, we count the number of those levels for which each student finishes within the fastest 50%. We then cut the population along the 50th percentile of this count distribution: students with a higher-than-median count are labeled \(1\) (‘high’ performance), and those with lower-than-median count are labeled \(0\) (‘low’ performance). Note that these labels depend on the collection of levels for which we predict performance.
We then use logistic regression on these inputs to predict three future problem-solving performance measures separately: performance in the immediate next level, performance in all future levels in the same map, and performance in all future levels in a different map. Logistic regression is used in this analysis as it is a simple and interpretable method that can be effective for binary classification problems, and it does not require any assumptions for the independent variables. Hence, it is a good choice for this preliminary attempt to gain insight into the prediction power and weights of the features. Because of dividing both the performance and the population by median, the random performance of the model (performance by chance) would be 50%. Therefore, we can compare our logistic regression model accuracy relative to this 50% baseline performance. We conduct a shuffle test to make this random prediction rigorous. The shuffle test involves training a model to predict randomly permuted output labels (e.g., high vs. low performance), giving us a “random" model baseline.
Overall, We have then 2 (average or progressive values) * 3 (all-previous, 8-hardest, or first-and-last initial levels) * 3 (to predict performance in the next level, all future levels in the same map, or all future levels in a different map) = 18 fitted logistic regression models in total. For each of these 18 logistic regression models, we run a 10-fold cross-validation on the data-set to estimate generalization of model accuracy. We leave hyperparameters in the default settings for this exploratory analysis.
3.2 Reinforcement Learning
We aim to compare the performance of Reinforcement Learning (RL) agents with human players. We selected three levels (i.e. baba-is-you, out-of-reach, and volcano) with available human play data and trained RL agents on them. The RL agents have a discrete action space of size 4, which includes left, right, up, and down. The state space, or map, is represented by one-hot encodings. For instance, a \(6 \times 5\) environment with 10 distinct tiles would be represented by a floating point tensor in \(\mathbb {R}^{10 \times 6 \times 5}\).
We implemented a DQN algorithm [12] with an epsilon-greedy strategy to train the RL agents. The discount factor gamma in the DQN algorithm is set to 0.99. The initial exploration rate epsilon is set to 0.9 and decays by a factor of 0.99 after every episode, with a minimum exploration rate of 0.01. The neural network architecture consists of four 2D convolutional layers, followed by batch normalization layers and a linear feed-forward layer. We employed a batch size of 128 and a replay buffer size of 10,000.
For the RL agents, an episode ends when the number of actions taken exceeds 200, when no available action is left, or when the level is solved. In the case of human players, we considered the end of an episode when the player hits the reset button, when no available action is left, or when the level is solved. We devised a reward system to measure the performance of both RL agents and human players. The RL agents receive -100 points for failing to solve the level, +200 points for completing the level, and -0.5 points for each action taken, to incentivize the agent to find more efficient solutions.
To compare human learning progress with the learning progress of RL agents, we scored human play based on the same reward system, even though such a scoring system is not visible to them. As human players typically only solve a level once, we assumed that they can at least repeat their solutions. In our visualizations, we maintained their scores at their top scores after they stopped solving for a particular level.
4. RESULTS
4.1 Important Features
| Feature | CV-\(R^2\) |
|---|---|
| no-you count | 0.317 |
| tried-levels count | 0.470 |
| restart count | 0.057 |
| undo count | 0.001 |
| Game experience (hour) | -0.187 |
| Avg session time (hour) | -0.159 |
| Age group (Middle school=0, College=1) | -0.136 |
The results of feature selection from aggregated data show that (Table 1) while we initially hypothesized that the no-you event is a major reason that students hit restart, the count of no-you is more important than the count of restart in predicting the number of levels completed. With \(R^2 = 0.317 < 0.5\), no-you, as a single feature, has a weak predictive power. Thus, we introduce more features directly from the game’s log data that improve the model fit significantly, including the count of rules added, count of rules removed, count of a single undo, count of blocks of undos, average time between inputs, maximum time between inputs, and the count of input signals. Overall, the three features that can significantly predict problem-solving progression and the number of initial levels completed are no-you count, tried-level count, and restart count.
4.2 Predicting Future Performance
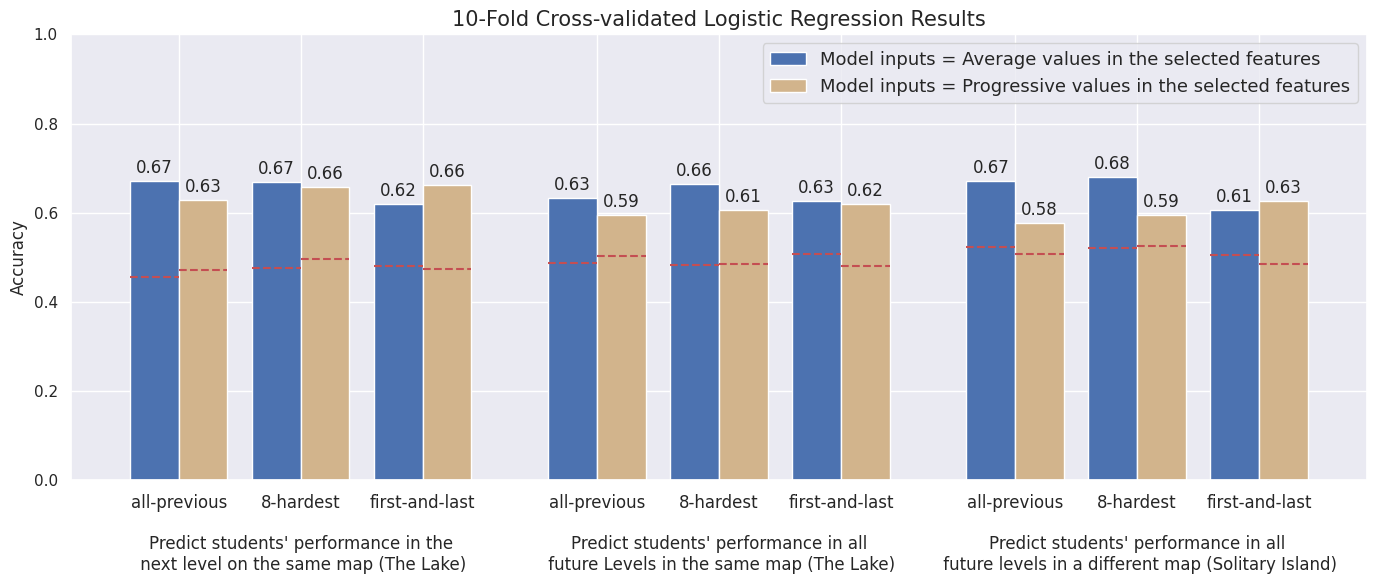
The results of cross-validated logistic regression to predict future problem-solving performance are shown in Fig. 3. The model that used the features from the first and last previous levels in the current map has reached the highest accuracy when predicting students’ future performance in the next single level or all future levels in the same map. Also, there is no significant difference between using average values of the selected features and using progressive values of the selected features. When predicting performance in the levels in a new map, the accuracy of all 3 models (all-previous, 8-hardest, first-and-last) decreases. In addition, it is interesting that for the levels in a new map, using all-previous and 8-hardest models are more accurate than using the first-and-last model while making predictions using the average values of the selected features.
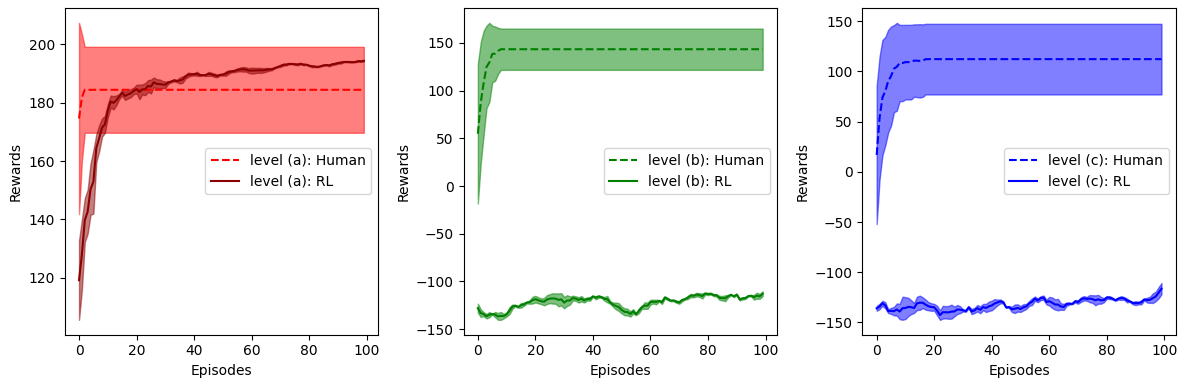
4.3 Reinforcement Learning Comparison
The results of the RL experiment are shown in Fig. 4. Three levels of increasing difficulty (a — Tutorial1, b — Tutorial2, and c — Tutorial3) were chosen for the experiment. It was observed that RL agents were only able to solve level (a), while human players could, on average, solve all levels. Note that a positive reward always indicates that the level has been solved since the only positive reward signal is obtained from solving the level. For level (a), the RL agent was trained to improve its policy, resulting in rewards that increased with more training episodes. Human participants, however, typically only solve each level once. To visually compare the performance of humans with that of the RL agent, we aggregate human performance curves as if they were to continue playing their best score after play had ceased — hence, the human reward curve is flat after episode 10, as most humans solved these levels within 10 episodes. Note that we are plotting these reward curves as a function of episode; as noted in analysis, these definitions differ slightly between human and RL agents. The above plot is our best attempt to compare human learning progress with RL learning progress despite this discrepancy.
5. CONCLUSIONS
Our exploratory regression analysis identifies significant features of human problem-solvers that help them succeed overall in the game as well as help them perform in future levels. We found that features like the number of no-you and undos can predict the problem-solver overall progression. One can hypothesize that the frequency of these features capture the extent that a player explores the game mechanics, and hence impact their overall problem-solving progression in the game. Furthermore, we can predict problem-solving performance in future levels using performance in these features in the hardest previously attempted levels as well as only the first and the last previously attempted levels.
While the RL agent’s performance fares similarly to human problem-solvers in an initial level, their performance falls significantly behind in the more challenging levels, and they exhibit significantly different sample efficiency in arriving at solutions. This is entirely expected, as we are training standard RL methods from scratch on these data. One interesting challenge we hope to make progress on is in closing this gap: the sorts of pre-training experience, subsequent representations, agent motivations, and inter-level transfer mechanisms that lead to more human-like problem-solving performance.
6. REFERENCES
- M. G. Bellemare, Y. Naddaf, J. Veness, and M. Bowling. The arcade learning environment: An evaluation platform for general agents,” arxiv preprint arxiv: 1207.4708. 2012.
- E. Bumbacher, S. Salehi, C. Wieman, and P. Blikstein. Tools for science inquiry learning: Tool affordances, experimentation strategies, and conceptual understanding. Journal of Science Education and Technology, 27(3):215–235, 2018.
- N. R. Council et al. Learning science through computer games and simulations. National Academies Press, 2011.
- N. R. Council et al. Next generation science standards: For states, by states. 2013.
- L. Cross, J. Cockburn, Y. Yue, and J. P. O’Doherty. Using deep reinforcement learning to reveal how the brain encodes abstract state-space representations in high-dimensional environments. Neuron, 109(4):724–738, 2021.
- C. Diuk, A. Cohen, and M. L. Littman. An object-oriented representation for efficient reinforcement learning. In Proceedings of the 25th international conference on Machine learning, pages 240–247, 2008.
- R. Dubey, P. Agrawal, D. Pathak, T. L. Griffiths, and A. A. Efros. Investigating human priors for playing video games. arXiv preprint arXiv:1802.10217, 2018.
- O. for Economic Co-operation and D. (OECD). PISA 2012 results: Creative problem solving: Students’ skills in tackling real-life problems (Volume V). OECD Publishing Pisa, 2014.
- S. S. Guo, R. Zhang, B. Liu, Y. Zhu, D. Ballard, M. Hayhoe, and P. Stone. Machine versus human attention in deep reinforcement learning tasks. Advances in Neural Information Processing Systems, 34:25370–25385, 2021.
- K. Kansky, T. Silver, D. A. Mély, M. Eldawy, M. Lázaro-Gredilla, X. Lou, N. Dorfman, S. Sidor, S. Phoenix, and D. George. Schema networks: Zero-shot transfer with a generative causal model of intuitive physics. In International conference on machine learning, pages 1809–1818. PMLR, 2017.
- V. Mai, K. Mani, and L. Paull. Sample efficient deep reinforcement learning via uncertainty estimation. arXiv preprint arXiv:2201.01666, 2022.
- V. Mnih, K. Kavukcuoglu, D. Silver, A. Graves, I. Antonoglou, D. Wierstra, and M. Riedmiller. Playing atari with deep reinforcement learning. arXiv preprint arXiv:1312.5602, 2013.
- S. Perez, J. Massey-Allard, D. Butler, J. Ives, D. Bonn, N. Yee, and I. Roll. Identifying productive inquiry in virtual labs using sequence mining. In International conference on artificial intelligence in education, pages 287–298. Springer, 2017.
- S. Salehi. Improving problem-solving through reflection. Stanford University, 2018.
- P. A. Tsividis, T. Pouncy, J. L. Xu, J. B. Tenenbaum, and S. J. Gershman. Human learning in atari. In 2017 AAAI spring symposium series, 2017.
- K. D. Wang, J. M. Cock, T. Käser, and E. Bumbacher. A systematic review of empirical studies using log data from open-ended learning environments to measure science and engineering practices. British Journal of Educational Technology, 2022.
- K. D. Wang, S. Salehi, M. Arseneault, K. Nair, and C. Wieman. Automating the assessment of problem-solving practices using log data and data mining techniques. In Proceedings of the Eighth ACM Conference on Learning@ Scale, pages 69–76, 2021.
© 2023 Copyright is held by the author(s). This work is distributed under the Creative Commons Attribution-NonCommercial-NoDerivatives 4.0 International (CC BY-NC-ND 4.0) license.