ABSTRACT
College students have great flexibility in choosing when they take specific courses. These choices sometimes are constrained by prerequisite requirements, which determines the order in which pairs of courses may be taken. However, even in these cases the student can choose the number of semesters, or gap, between the pairs of courses. In this paper we study the impact that this gap has on student learning, as measured by course grades. Our methodology accounts for differences in instructor grading policies and in student ability as measured by overall grade point average. Our results can be used to inform course selection and advising strategies. Our study is applied to eight years of undergraduate course data that spans all departments in a large university. Due to space limitations, in this paper we focus our analysis on the semester gaps in Computer Science courses and in Spanish courses. Our results do not show a consistent negative impact on increasing semester gaps between all pairs of courses in a department; however, a negative impact is shown when the gap increases between courses that have a particularly strong relationship and overlapping content.
Keywords
INTRODUCTION
Undergraduate college students have considerable flexibility in when they can take specific courses. Course sequencing is typically determined by certain courses being deemed as prerequisites for others. However, even in such cases, there is no requirement that the prerequisite must be taken in the prior semester. Thus there may be a “gap” between when the two courses are taken. A gap may also exist between courses that have no prerequisite relationship. In this study we compute, for all possible course pairs, the impact that this gap has on the course that is taken second. We ignore course pairs with an insufficient number of students in common and focus our analysis on course pairs with a clear connection and overlapping topics.
Our study is based on course grade data from Fordham University, a large university [2] with approximately 15,000 undergraduate and graduate students. As discussed in detail in Section 2, we account for some important factors that could distort our results, such as whether a particular instructor is an easy or hard grader, and whether a course section happens to have a stronger or weaker set of students, based on student overall grade point average (GPA). We introduce a general set of metrics that can be used to assess the impact of semester gaps. Our findings indicate that when courses are very strongly related and cover overlapping topics, that an increasing semester gap degrades student performance. However, our results do not show this pattern over the broader set of courses, even if the courses are offered by the same department. The information that we compute can be used to inform the course selection process and to improve departmental advising strategies.
Our study is a special case of the more general work on course sequencing, especially the work on course sequencing as it impacts student grades. Work on the more general area of course sequencing is generally quite limited and has often been restricted to a single discipline, such as communications [5] or psychology [1]. A prior study of ours did span all academic disciplines in a university, and compared student grades between pairs of courses when the courses are taken in the two possible orderings [3]. Our current study is similar in that we also study only course pairs, but rather than comparing the two sequential orderings, we evaluate the impact of the numbers of semesters between the courses.
Course-grade Data Set
The initial data set includes course enrollment and grade data for each undergraduate student in the university. Each individual record corresponds to a specific student taking a specific course (identified by the course department, course number and title, section number, and semester and year) and also has the earned student grade in the course. Grades are represented using a 4-point scale, where a 0 represents an “F” and 4.0 represents an “A.” Our ability to identify individual course sections is important because, as discussed in Section 3.2, student grades are normalized at the section level to account for differences in instructor grading schemes. The data set contains 473,527 records that cover 24,969 students. Due to strict privacy laws, we are unable to share our data set even though the student identifiers have been anonymized.
Our study is focused on student grades as well as the timing between courses. Before proceeding, we need to acknowledge that the course gaps have additional implications. For example, if a large gap exists, then the student will be more advanced in their education (and age) when taking the second course. This by itself can impact student learning. Similarly, the courses that tend to have larger gaps are more likely to have a higher course level, designated by the first digit of the course number (where 1000 represents a first year freshman course and 4000 represents a fourth year senior class). However, this numbering is only a rough guideline and there are even cases where a freshman takes a 4000 level course.
Table 1 shows how “Student Year” and “Course Level” impact a grade, as these factors can influence grade patterns tied to semester gaps. Table 1 shows the average grade by student year (freshman to senior) for each course level and then averaged over all course levels. The final column shows that the average grade increases monotonically with student year; the final row shows that the average grade also increases monotonically with course level. The number of students in each student year that take courses at a particular course level varies greatly. We track these numbers, although they are not included in Table 1, and use them to compute the displayed averages, which are weighted by the number of students corresponding to each entry. If our results show that an increasing gap degrades student performance, this effect would run counter to the general trend of higher grades as one advances in one’s college career.
Course Level | |||||
|---|---|---|---|---|---|
Student Year | 1000 | 2000 | 3000 | 4000 | Average |
Freshman | 3.108 | 3.271 | 3.034 | 3.209 | 3.120 |
Sophomore | 3.189 | 3.281 | 3.215 | 3.244 | 3.222 |
Junior | 3.167 | 3.310 | 3.278 | 3.305 | 3.261 |
Senior | 3.182 | 3.342 | 3.327 | 3.385 | 3.320 |
Average | 3.136 | 3.301 | 3.271 | 3.364 | |
Calculating Gap Performance
In this section we describe how gap performance is measured. Our methodology and the associated metrics incorporate two types of grade normalization, discussed below.
Basic Methodology
We measure gap performance for potentially every pair of undergraduate courses. For each pair (Course A, Course B), we consider both orderings (i.e., placing Course A first and then placing Course B first). For each ordering, we further partition the students based on the number of semesters between the pair of courses. If the number of students in a partition associated with a particular gap size is at least gap-threshold, we calculate the average grade of the students in the second course. If the number of students is below this threshold, the partition is omitted since any average grade may not be reliable. We then compare average grades for different gap lengths to detect the relative impact of larger semester gaps.
For this study we omit summer courses and consider only fall and spring semester courses – we consider the gap between a fall 2014 and spring 2015 course to be the same as the gap between a spring 2015 and fall 2015 course. We do this because summer courses are taken with relative infrequency, and because summer courses compress the material from a fifteen week fall or spring semester into a five week summer session. This compressed schedule, even though it may maintain the number of lecture hours, is likely to have a deleterious impact on student learning. We consider courses taken in consecutive semesters to have a gap of 1 (i.e., one semester difference), although we recognize it might be more natural to consider this as a gap of 0. However, using our scheme courses taken in the same semester can be represented with a gap of 0; we ignore such cases from our present analysis but may consider them in the future. Taking courses simultaneously is very different from taking courses sequentially, and merits a separate analysis.
Normalizations
We normalize our student grades to account for two confounding factors. We first normalize grades at the course section level to account for instructors that are easy versus harsh graders; we then normalize for student ability, as measured by the student’s grades across all of their courses (i.e., their GPA). We apply these sequentially, so we never normalize only for student ability. We refer to the resulting normalized student grades as instructor normalized and compound (instructor and student ability) normalized grades. In order to provide more succinct names and table headings, and to reflect that these normalizations are applied sequentially, we refer to these as Level 1 and Level 2 normalizations. These two levels of normalization have been used in several of our labs other studies, including the previously discussed study on the impact of course pair orderings on student grades [3].
The Level 1 instructor normalization takes the raw student grades in an individual course section and applies z-score normalization. This will account for instructors who assign grades with higher, or lower, overall means, so that these factors do not obscure the semester gap effects. Equation 1 describes the normalization process. In this equation, L1i represents the L1 instructor normalized grade of student i in the course section, xi represents the initial grade of the student, µ represents the mean grade of the course section, and σ represents the standard deviation of the course section grades.
(1)
The next normalization accounts for student ability. That is, a particular section may contain students who are stronger-than-usual overall. While such affects may be expected to average out, they nonetheless could distort our results. We measure student ability by the student’s grades in all of their courses. We could try to do better by using a student’s major GPA for major courses, humanities GPA for humanities courses, and so on, but we do not want to overly complicate the calculations. This step takes the normalized scores produced by Equation 1 and then applies another round of z-score normalization, as described by Equation 2. In this equation, L2i represents the Level 2 compound normalized grade of student i in the course section, L1i represents the L1 instructor normalized grade of student i, µi represents the mean instructor normalized grade across all courses taken by student i (i.e., instructor normalized GPA), and σi represents the standard deviation of this student’s instructor normalized grades.
(2)
These steps are done at the course section level. These values are then aggregated over all course sections for each course. These are the values that we report in our results as long as there are a sufficient number of values (i.e., students). As mentioned in Section 3.1, our metrics are based on the students who take the second course a specific number of semesters after the first course. We refer to the metrics computed over these partitions of student grades as the L1 gap and L2 gap metrics, where each of these metrics in turn is associated with a specific gap length (e.g., we can talk about the L1 gap=1 value versus the L1 gap=2 value). In our discussion we prioritize the L2 gap metric over the L1 gap metric.
Example Gap Performance Entry
An example is provided in Table 2 to provide a better understanding of the metrics that were just introduced. The table includes just a single entry, which corresponds to “Introductory Biology I” followed by “General Chemistry 1.” In our dataset there are a total of 1301 students who took these two courses in this sequence. The number of students who took it with a gap of 1 and a gap of 2 is not provided in the table but is above gap-thresh (the results in Section 4 use gap-thresh=40 unless otherwise specified). Table 2 only includes the Level 2 results. The value for students taking “Gen Chem 1” in the semester right after taking “Intro Bio 1” is 0.519, while the value for those waiting an extra semester (so they take it the same semester in the following year) is -0.362. Since the value decreases, the delay hurts student performance. The difference between these values (gap 1 minus gap 2) is 0.881 and is denoted as the L2 difference (L2 Diff). We generally do not show the gap values past a gap of 2 because there are often insufficient numbers of students to satisfy gap-thresh. For this reason we focus on the difference between a gap of 1 and 2, although we provide one example with a larger gap in Table 3. As we accumulate additional student data, we may be able to extend our analyses to look at larger gap lengths.
Level 2 Gap | L2 Diff | |||||
|---|---|---|---|---|---|---|
Course 1 | Course 2 | Corr. | Students | 1 | 2 | (gap 1-2) |
Intro Bio1 | Gen Chem1 | 0.64 | 1301 | 0.519 | -0.362 | 0.881 |
We tend to focus our analyses on courses that are normally taken closely together—if this is not the case then the courses are most likely not highly linked, and a delay is less likely to matter. Table 2 specifies the Pearson correlation (Corr.) between the student grades in the two courses. This correlation, which is computed independent of order, tends to identify courses that are highly related/linked. The link may not be causal—it could just be that the courses utilize similar skills so that students who perform well in one perform well in another. But we do feel that a high grade correlation is a necessary, but not sufficient, condition for two courses to have their grades causally linked—and hence have the possibility of a semester gap having a substantial influence on student performance. Thus we can use grade correlation to help guide our search for courses to focus our attention on. This use of grade correlation was studied in one of our prior studies [4], which suggested that a grade correlation of 0.5 or higher suggests that courses are linked.
Table 3 includes the only entry in this paper with a gap length greater than 2. The example involves “General Chemistry 1” followed by “General Chemistry 2.” This example was selected by sorting all of our results by decreasing levels of grade correlation and then selecting the first entry. Note that the performance degrades when the gap transitions from 1 to 2. This trend does not continue to a gap length of 3, but student performance at gap length of 3 is still below that of gap length of 1. The entries for gap length of 3 may be less reliable since they involve fewer students, although they still exceed the gap-threshold of 40.
Gap Length | |||||
|---|---|---|---|---|---|
Metric | Corr. | Students | 1 | 2 | 3 |
L1 | 0.730 | 1328 | -0.040 | -0.753 | -0.615 |
L2 | 0.730 | 1328 | -0.337 | -1.012 | -0.689 |
Main Results
This section covers our main results. Section 4.1 take a detailed look at Computer Science courses and then Section 4.2 looks at Spanish courses. We study Computer Science courses because all of the authors of this study are affiliated with a Computer Science department. Foreign language courses were selected since our intuition is that courses in a foreign language will be heavily sequenced and the performance in one course will impact the performance of subsequent courses; Spanish courses were selected because Spanish is the most popular foreign language studied in our university.
Computer Science Results
In this section we take a detailed look at the course gap results for Computer Science (CS) courses. In order to provide a fair analysis, all course pairs that satisfy a gap-threshold of 40 are displayed in Table 4.
Before analyzing the results, it is important to understand the relationship between CS courses, since the gap values are not as likely to be meaningful for courses that are not highly related. Thus we first highlight the course pairs where the courses cover the same topic(s), although perhaps at different levels. In these cases the first course will be an essential prerequisite for the second course. Our introductory programming sequence is CS1→CS2→Data Structures, and each course builds on the prior ones and utilizes the same programming language. While other courses may be related by a prerequisite, the prerequisite may not be as essential. For example, Databases has CS1 as a prerequisite, but mainly just to ensure that the student has had a general exposure to programming. The only other course pair in Table 4 that may share an “essential” relationship is “Data Structures” and “Algorithms,” although there are substantial differences, as the first course has a heavy programming component, while the second course generally does not.
L1 | L2 | L1 gap | L2 gap | ||||||
|---|---|---|---|---|---|---|---|---|---|
Course 1 | Course 2 | Diff | Diff | Corr. | Stdnts | 1 | 2 | 1 | 2 |
CS1 | CS2 | .250 | .808 | .568 | 582 | .052 | -.198 | .078 | -.730 |
CS2 | DataStruct | .301 | .357 | .549 | 351 | .072 | -.229 | .063 | -.293 |
Databases | DataComm | .044 | .346 | .526 | 170 | .000 | -.044 | .452 | .107 |
Databases | OS | -.017 | .069 | .520 | 187 | .146 | .163 | .188 | .118 |
CS1 | Databases | .116 | .024 | .443 | 274 | -.193 | -.309 | -.087 | -.111 |
CS2 | Databases | -.029 | -.009 | .469 | 238 | .069 | .098 | .304 | .313 |
DiscMath | CS1 | -.196 | -.137 | .382 | 300 | -.320 | -.125 | -.160 | -.024 |
DataStruct | Algrthms | -.163 | -.346 | .526 | 232 | .011 | .174 | -.131 | .215 |
DataStruct | OS | -.168 | -.353 | .550 | 226 | -.114 | .054 | -.284 | .069 |
DataStruct | TOC | -.143 | -.412 | .460 | 251 | -.149 | -.006 | -.402 | .010 |
CS1 | CompOrg | -.292 | -.446 | .410 | 268 | -.238 | .053 | -.151 | .296 |
CS2 | CompOrg | -.239 | -.533 | .463 | 256 | .101 | .340 | .166 | .699 |
CS2 | DataMining | -.129 | -.821 | .492 | 212 | -.070 | .059 | -.176 | .646 |
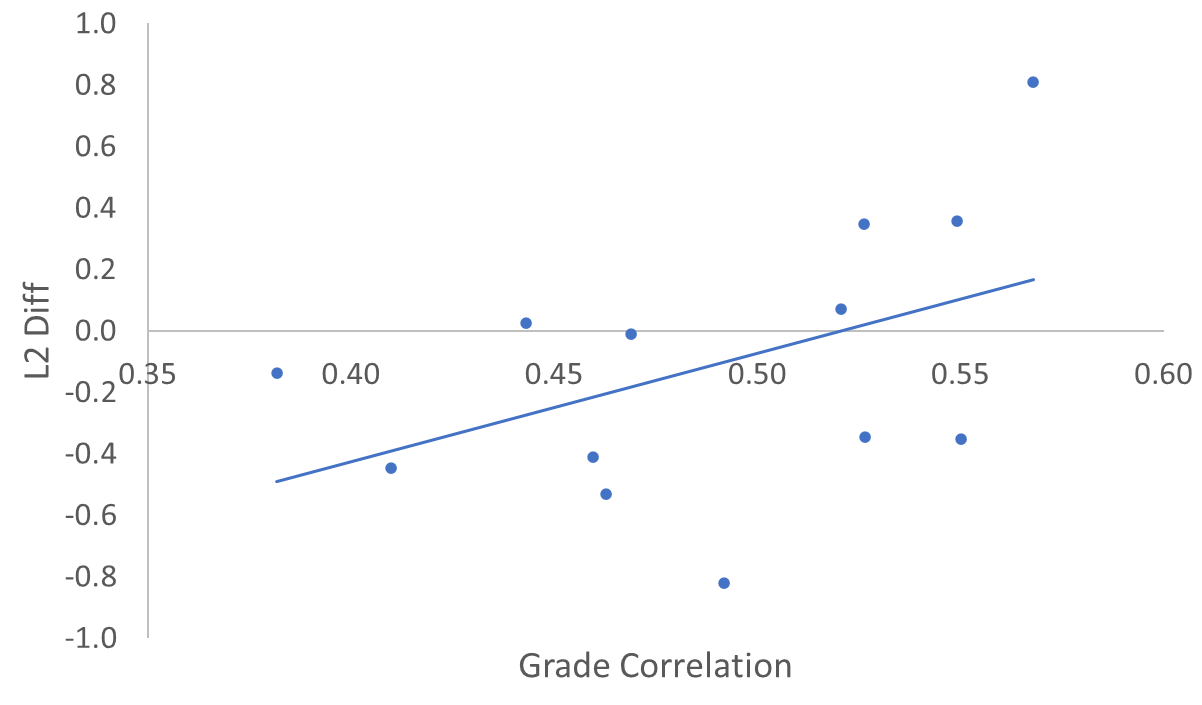
The key observation from Table 4 is that the gap between CS1 and CS2, and the gap between CS2 and Data Structures, has a large L2 difference—and in fact they have the two largest positive differences. The same pattern is also observed with the L1 normalized differences. The grade correlation between students who take CS1 and CS2 (0.568), and CS2 and Data Structures (0.549), is quite high, and in fact are higher than for just about all other course pairs. This further supports the strong relationship between these pairs of courses. In other cases, when the grade correlation is high it could just be that the courses rely on similar student abilities and there is no causal link. Nonetheless, we generally would expect a relationship between grade correlation and L2 Difference, even if some of the relationships are not causal. The scatter plot and associated trendline in Figure 1 demonstrates that there is such a relationship, and the Pearson correlation coefficient between these two measures of 0.459 confirms this (this is considered to be a moderate positive correlation).
The remaining entries in Table 4 do not support the hypothesis that a larger gap will yield poorer performance, since in many cases the L1 and L2 differences are negative. This suggests that the gap has no substantive negative impact on student learning in those cases. Often negative differences are associated with first-courses intended to be taken early in the major (CS1, CS2, and Data Structures) and second-courses intended to be taken in the middle years of the major with relatively few official prerequisites. Perhaps the gap poses a benefit in these cases by allowing the students time to reflect and grow through partially-tangential academic experiences before joining the second course. It should be noted that we already advise students to take our introductory programming sequence CS1→CS2 → Data Structures as quickly as possible, but our universities’ large liberal-arts core curriculum, which includes well over a dozen courses, sometimes interferes with this advice.
Spanish Results
The next discipline/department that we look at is Spanish, for the reasons provided earlier. Students who do not major in a science are all required to take a substantial amount of a foreign language—beyond the placement credits that most students receive. Our university catalog reveals the following prerequisite structure for the Spanish courses that appear in Table 5:
Spanish 1 → Spanish 2 → Language and Literature → Approaches to Literature → Latin America: Literature and Culture
The first two courses in the sequence are standard intermediate-level courses that focus on language fundamentals such as reading, writing, listening, and speaking. They do require two introductory Spanish courses, but most students receive placement credit for those based on their high school foreign language requirement. The Spanish Language and Literature course introduces Spanish literature, but a key focus in the course is using these topics to review the language fundamentals. The last two courses assume language competence and the focus goes beyond language fundamentals. Based on this background, one would expect that “Spanish 1” and “Spanish 2” would have the strongest relationship, followed by “Spanish 2” and “Language & Literature.”
L1 | L2 | L1 gap | L2 gap | ||||||
|---|---|---|---|---|---|---|---|---|---|
Course 1 | Course 2 | Diff | Diff | Corr. | Stdnts | 1 | 2 | 1 | 2 |
Spanish1 | Spanish2 | .686 | .420 | .663 | 2348 | .001 | -.685 | -.036 | -.456 |
Spanish2 | Lang&Lit | .471 | .232 | .640 | 2472 | -.023 | -.494 | -.236 | -.468 |
ApprToLit | LatinAmerica | -.111 | .151 | .592 | 166 | -.092 | .019 | -.451 | -.602 |
Spanish1 | Lang&Lit | -.317 | -.246 | .583 | 2020 | -.395 | -.078 | -.580 | -.334 |
Lang&Lit | ApprToLit | -.113 | -.397 | .390 | 496 | .009 | .122 | -.747 | -.350 |
The data in Table 5 agrees with the expectation that the courses that are most related will most negatively impacted by an extra semester gap. Those courses also have the highest grade correlation, which further suggests a close relationship.
Conclusion
This paper introduced a methodology for evaluating the impact of semester gaps between courses on student performance. Performance is measured based on student grades and two levels of normalization are used to account for differences in instructor grading policies and in student ability. This methodology was applied to eight years of undergraduate course data. This initial study focused on the impact of semester gaps on Computer Science courses and on Spanish courses; the former was selected to utilize the domain knowledge of the authors while the latter was selected due to the expected strong impact between introductory foreign language courses. In both cases a longer gap did not consistently degrade student performance. This may be explained by the fact that even within a given discipline, the knowledge gained in one course may not necessarily have a strong impact on the performance in the other course. However, for both Computer Science and Spanish, the courses with the clearest direct connections did show a degradation in performance with a longer gap. In these two cases the courses with the largest such degradation were introductory courses where both pairs of courses share the same name, but with a different suffix (i.e., “Computer Science 1” and “Computer Science 2” and “Intermediate Spanish 1” and “Intermediate Spanish 2”). We believe that this connection is not accidental and that performance in highly related courses suffer from degradation in retained knowledge over time, as measured in the present work. We further note that if two courses have no meaningful link in grades, a larger gap should lead to improved performance in the second course based on our results in Table 1, which show that students earn higher grades the further along they are in their academic career. Our work has the potential to improve academic advising in that an advisor, or an automated tool, could warn students when a delay is most likely to lead to degraded performance.
This study has several limitations that will be addressed in future work. Although our university is considered a large university by the Carnegie classification [2] since it has more than 10,000 degree seeking students across all levels, we often found that the number of students taking pairs of related courses was often quite modest, and the number quickly diminished with the number of intervening semesters. Our immediate plan is to obtain several years of additional data, since our data is currently three years old. Longer term, we hope to obtain data from another university, or to lend our analysis tool to other researchers, who can apply it to their university data. We also plan to form higher level hypotheses about the role of time between courses, and combine it with domain knowledge across many disciplines, so that we can generate more reliable conclusions. For example, if we had a list of the two most highly related courses in each academic major, we could compare the impact of gap length on these collective pairs of courses.
REFERENCES
- Betancur, L., Rottman, B. M., Votruba-Drzal, E., and Schunn, C. 2019. Analytical assessment of course sequencing: The case of methodological courses in psychology. Journal of Educational Psychology, 111(1), 91.
- The Carnegie Classification of Institutions of Higher Education. https://carnegieclassifications.iu.edu/.
- Gutenbrunner, T., Leeds, D.D., Ross, S., Riad-Zaky, M., and Weiss, G.M. 2021. Measuring the academic impact of course sequencing using student grade data. In Proceedings of The 14th International Conference on Educational Data Mining, International Educational Data Mining Society, Paris France, June 29-July 2, 799-803.
- Leeds, D.D., Zhang, T., and Weiss, G.M. 2021. Mining course groupings using academic performance. In Proceedings of The 14th International Conference on Educational Data Mining, International Educational Data Mining Society, Paris France, June 29-July 2, 804-808.
- Richards, A. S. 2012. Course sequencing in the communication curriculum: A case study. Communication Education, 61(4), 395-427. DOI= 10.1080/03634523.2012.713500
© 2022 Copyright is held by the author(s). This work is distributed under the Creative Commons Attribution-NonCommercial-NoDerivatives 4.0 International (CC BY-NC-ND 4.0) license.