ABSTRACT
The contract termination remains a persistent challenge in vocational education and training (VET), yet existing dropout prediction models overlook the tri- stakeholder dynamics inherent to apprenticeships, i.e., involving the apprentice, workplace master, and training provider. We propose ESPM (Ensemble Stacking with Perception-aware Meta-learning), a two-stage architecture that combines gradient boosting base learners with a neural meta-layer encoding stakeholder presence patterns and perception gaps. For interpretability, we introduce the Engagement Asymmetry Index (EAI) and an Engagement-Performance Decomposition module. Evaluated on 3,511 apprenticeship contracts (143, 983 skill evaluations) from the French VET system, ESPM achieves an F1 of 72.21% and a recall of 71.92%, outperforming nine baselines. Interpretability analysis reveals that employer-related features dominate predictions (52.2%) and engagement features outweigh performance features (56.1% vs. 43.9%), challenging the conventional focus on academic grades for dropout prediction.
Keywords
1. INTRODUCTION
VET systems play an important role in addressing the demands of the labor market by developing skilled workforces. Apprenticeship, which combines theoretical and practical training, has emerged as an effective structure to facilitate the transition from education to employment across numerous countries [8, 20]. France offers two main forms of VET or work-study programs (fr. formation en alternance): (1) Apprenticeship (fr. Apprentissage), i.e., employment contract combining vocational training with paid work experience; and (2) Professionalization Contract (fr. Contrat de Professionnalisation), i.e., employment contract targeting specific groups. The apprenticeship system has witnessed a significant rise in popularity, with over 800,000 active contracts recorded in 2023, reflecting a massive increase over the last few years [13]. Despite this rise, the contract termination rate in apprenticeships is concerning, with approximately 30% of contracts ending prematurely at the national level [14]. In France, the apprenticeship system is governed by frameworks like the National Directory of Professional Certifications (fr. Répertoire National des Certifications Professionnelles, RNCP), which serves as a key pathway for youth employment, with over 500,000 contracts annually. This growth was driven by the 2018 reform, which increased financial incentives, simplified administrative procedures, expanded eligibility criteria, and created industry-led funding mechanisms [16]. French national agency France Compétences1, established by the same law that governs the VET and apprenticeship. Its key functions include: regulating training quality and costs, managing the RNCP, distributing funding for apprenticeships and VET, ensuring that qualifications meet labor market needs, and evaluating or monitoring the effectiveness of the system. Digital training booklets (fr. livrets de formation) like Campus skill, Kwark, Sheldon skills, STUDEA, track apprentice progress against these competency frameworks, providing a structured record of skills acquisition throughout the training program.
In general, apprenticeship programs have been demonstrated to be an effective method to prepare youth for the labor market through a combination of classroom instruction and workplace training. However, contract rupture or dropout has been a major problem in apprenticeships, which affects both learners and training organizations. The dropout rates in apprenticeship programs are significantly high and range between 10% and 20%, depending on the sector and program level. The high dropout rate has negative economic consequences beyond individual disappointment. Employers invest their resources in training and supervision, but they face disruption in operational continuity while generating recruitment costs [12]. The providers or training institutions face difficulties in managing program quality metrics, and experience reduced funding tied to completion rate as well [3]. The apprentices or learners often lead to an extended period of unemployment, diminished motivation, and long-term career setbacks due to contract termination [9]. Previous ML studies for dropout prediction have focused on learners in a higher education context and considered several individual-level factors such as academic performance, demographic data, and social and economic aspects. In contrast, apprenticeship education is a triad (tri-stakeholder) structure, which involves (1) apprentice (student) who learns skills and has personal characteristics, (2) master (employer) who provides workplace supervision, task allocation, and practical skills development, and (3) training provider (tutor) who delivers lessons in the classroom, sets the curriculum, and provides institutional support. The concept of apprenticeship inherently involves multi-stakeholder contexts where the learner and other stakeholders may hold asymmetric engagement or have varying levels of expectations. This difference may increase the risk of students dropping out. However, current studies of dropout prediction often neglect these dynamics and adopt the perspective of a single stakeholder, either the learner or the institution. By narrow framing and focusing only on immediate context, several issues may be overlooked, which include (1) critical interactions, (2) perception gaps encountered between apprentices, employers, or providers, (3) engagement asymmetries where stakeholders participate at different intensities, and (4) misalignment between training content and workplace needs.
Our study addresses these gaps by proposing the Ensemble Stacking with Perception-aware Meta-learning (ESPM), a two-stage ensemble approach that models tri-stakeholder dynamics through: (1) a neural meta-learner incorporating perception gap and stakeholder presence features, and (2) two interpretability modules, the EAI computing seven engagement-derived features for SHAP analysis, and Engagement - Performance decomposition that is responsible for separating the predictive signal into engagement-versus-performance and stakeholder-specific contributions. The approach is evaluated on one of the French training booklets’ real-world datasets that contains 3,511 apprenticeship triads encompassing 143,983 skill evaluations from a VET platform. The proposed work is evaluated and compared with nine top baseline models, among which ESPM achieves the superior F1 (72.21%) and recall (71.92%). Beyond performance gain, ESPM provides interpretability through EAI-enhanced SHAP analysis, revealing that employer features contribute 52.2% among all stakeholders, engagement features outweigh performance metrics (56.1% vs 43.9%), and students with engagement patterns "apprentice-only" show 41.7% dropout rates, nearly \(5\times \) higher than triads where engagement pattern is complete.
The major contributions of this paper are fourfold: (1) a domain-specific feature set incorporating RNCP certification details, tri-stakeholder evaluations, and perception gap features, (2) ESPM’s architecture, which fuses base learners with domain-specific encoders for stakeholder presence and perception gaps, (3) EAI and decomposition modules, enabling granular interpretability, and (4) empirical validation on real-world apprenticeship data, demonstrating that disengagement between stakeholders occurs before performance decline. The rest of the paper is structured as follows: Section 2 discusses a literature review. In section 3, we share the details of the dataset and preprocessing. Section 4 presents the detailed methodology. In 5, we share the details of the experimental setup. Section 6 highlights the results, and section 7 concludes the paper.
2. LITERATURE REVIEW
The ML application to dropout prediction has experienced significant growth. The use of gradient boosting methods consistently demonstrates strong performance on structured educational data. [5] adopted gradient boosting to identify GPA and credit hours to retain students, while [2] achieved more than 0.85 AUC score using an XGB model on higher education data. In [18], the study reinforces these findings by demonstrating that LightGBM and CatBoost with Optuna hyperparameter tuning outperformed the traditional approaches. The authors in [15] have also achieved state-of-the-art results by incorporating the ADASYN resampling approach with CatBoost on Moodle log data. In a recent meta-synthesis by [4], the authors analyzed 70 studies and 666 dropout variables. They confirm that prior research is mainly focused on individual-level dropout features while neglecting the learning environments of the workplace, which is a critical gap in the context of apprenticeship.
Some recent studies also confirm that gradient boosting methods often achieve similar or exceed the performance as compared with deep learning-based approaches while using tabular datasets [17, 10]. On the other side, ensemble methods, specifically the stacking architecture where a meta-learner is used to combine base model predictions [19], have shown promising results for capturing complementary strengths of the model. Recent work studied a neural meta-learner that learns non-linear combination functions [11], but these approaches remain domain-independent without incorporating task-specific knowledge into their architecture. [21] introduced a transformer-based stacking approach that uses an attention mechanism to dynamically integrate base classifier predictions. The research studies that specifically address dropout in apprenticeships remain sparse. The authors in [9] found that factors like prior education, training sector, and age have a significant effect on the likelihood of non-completion in England. [12] concluded in their work that employer training quality significantly affects retention in Switzerland. In France, [1] highlights the variation across qualification levels but notes the limited availability of data capturing the experience of apprenticeship. A recent report [7] emphasizes the urgency of this problem. They documented that in England, approximately 40% apprentices fail to complete their courses. The concept of perception gaps has been studied in educational psychology [6], but their integration into predictive models is limited. In our work, we address these gaps through four major contributions. First, we develop tri-stakeholder features to capture engagement patterns from the perspectives of all three stakeholders, which directly overcomes the challenge identified by [4] regarding the workplace learning environment gap. Second, we introduce a perception-aware neural meta-learner that encodes stakeholder presence patterns, perception gaps, and domain knowledge directly into the model architecture. Third, we propose the EAI in dropout prediction as a separate interpretability module that enables SHAP to decompose predictive contributions across stakeholders. Fourth, we develop an Engagement-Performance Decomposer to distinguish engagement and performance-related features, revealing that dissengagement precedes performance decline.
3. DATASET
The French apprenticeship system operates as a form of alternating training, where the contracts span is typically 12-36 months. During training, the learner spends most of their time in the workplace. Skill evaluations by stakeholders are a core component of monitoring throughout the contract. Along with three primary stakeholders (Student, Master, and Tutor) in each contract, there is another stakeholder in some contracts (less consistently implemented), called the LEA (Livret Électronique d’Apprentissage) manager, who oversees the digital apprenticeship portfolio. During the program, each stakeholder assesses the apprentice’s competencies across various skill domains by recording scores.
Data Collection and Pre-Processing: Our dataset is obtained from one digital booklet system for apprenticeship management and is subject to confidentiality and data protection agreements. The study analyzes fully anonymized data, collected as part of standard educational practice and handled with institutional data protection policies. All personally identifiable information (PII) related to students, institutions, and workplaces is removed before analysis. The study uses secondary analysis of de-identified data and does not require institutional review board (IRB) approval under our institution’s guidelines for educational research. The anonymized records of apprenticeship contracts initiated between 2020 and 2023. The raw data contains 143,983 individual skill evaluation records encompassing 3,529 unique triads (contracts), 6,179 unique skills, and 2,953 unique students. The unique skills contained 407 distinct skill categories, which we consolidated into 10 broad skill domains (e.g., technical skills, communication, professional attitude, etc.) through keyword-based mapping on French skill descriptions to reduce dimensionality while preserving domain-specific predictive signals. In data cleaning, we dropped the records where the apprentice ID or skill evaluation score is missing. The overall stats of the dataset after cleaning are presented in Table 1. Individual evaluations were aggregated to the contract level. All the contracts are strictly ordered by start date within each student to prevent data leakage.
| Category | Details |
|---|---|
| Dataset size | |
| Total skill evaluation records | 143,550 |
| Apprenticeship triads (contracts) | 3,511 |
| Unique apprentices/students | 2,935 |
| Unique skills | 6,130 |
| Original skill categories | 407 |
| Mapped skill categories | 10 |
| Contract characteristics | |
| Repeat-apprentice triads | 1,070 |
| Triads with prior rupture history | 116 (3.3%) |
| Dropout contracts | 367 (10.5%) |
| Completed contracts | 3,144 (89.5%) |
| Class imbalance ratio | \(\sim \)8.6:1 |
| Evaluation distribution
| |
| Apprentice (self): triads/evaluations | 2,815 / 77,872 |
| Tutor: triads / evaluations | 252 / 5,192 |
| Master: triads / evaluations | 2,507 / 55,651 |
| LEA/Manager: triads/evaluations | 154 / 4,835 |
| Category | Group | Count | Source |
|---|---|---|---|
| Contract & Demo. | Shared | 5 | Raw |
| Student History | Apprentice | 2 | Raw |
| Skill Evaluation | Shared | 6 | Raw |
| Self-Evaluation | Apprentice | 5 | Raw |
| Master Evaluation | Employer | 5 | Raw |
| Perception Gap | Shared | 1 | Raw |
| Skill Categories | Shared | 10 | Raw |
| Stakeholder Engagement | Shared | 5 | Raw |
| RNCP Certification | Provider | 8 | Scraped/Eng. |
| Interaction Features | Shared | 6 | Engineered |
| Total | — | 53 | — |
Overall Features: The raw features in the dataset are mainly related to demographic, contract, and skill evaluations. The Table 2 summarizes the overall 53 features used in our experiments, organized by category, stakeholder group, and data source. The features belong to three different sources: (1) Raw features used directly from the database, (2) Scraped features obtained by web scraping the RNCP1 registry to fetch RNCP meta-data like total skill blocks/skill counts, and number of organizations that offer any RNCP, etc., and (3) Engineered features computed by transforming the raw features. The group column refers to the features ownership within the triad stakeholders, including Apprentice features that purely belong to student history and self-assessment, Employer features refer to workplace master evaluations, Provider features represent training institute and RNCP related data, and Shared features apply across all stakeholders to capture cross interactions. This group distribution or stakeholder mapping is defined for the ESPM to compute asymmetry patterns and perception gaps. The target variable broken_contract is binary (\(0=\text {retained}\), \(1=\text {dropout}\)) and is separate from 53 input features. The original dataset contains more than 54 columns, from which we exclude all the non-predictive identifiers, leaky and sparse features with coverage below 25% (including tutor and LEA evaluation statistics), as in most of the triads, tutor and LEA evaluations are missing. Despite low coverage, binary engagement indicators of both stakeholders are retained in the features as the presence/absence signal of their evaluation, which carries meaningful information regarding triad completeness.
4. PROPOSED APPROACH
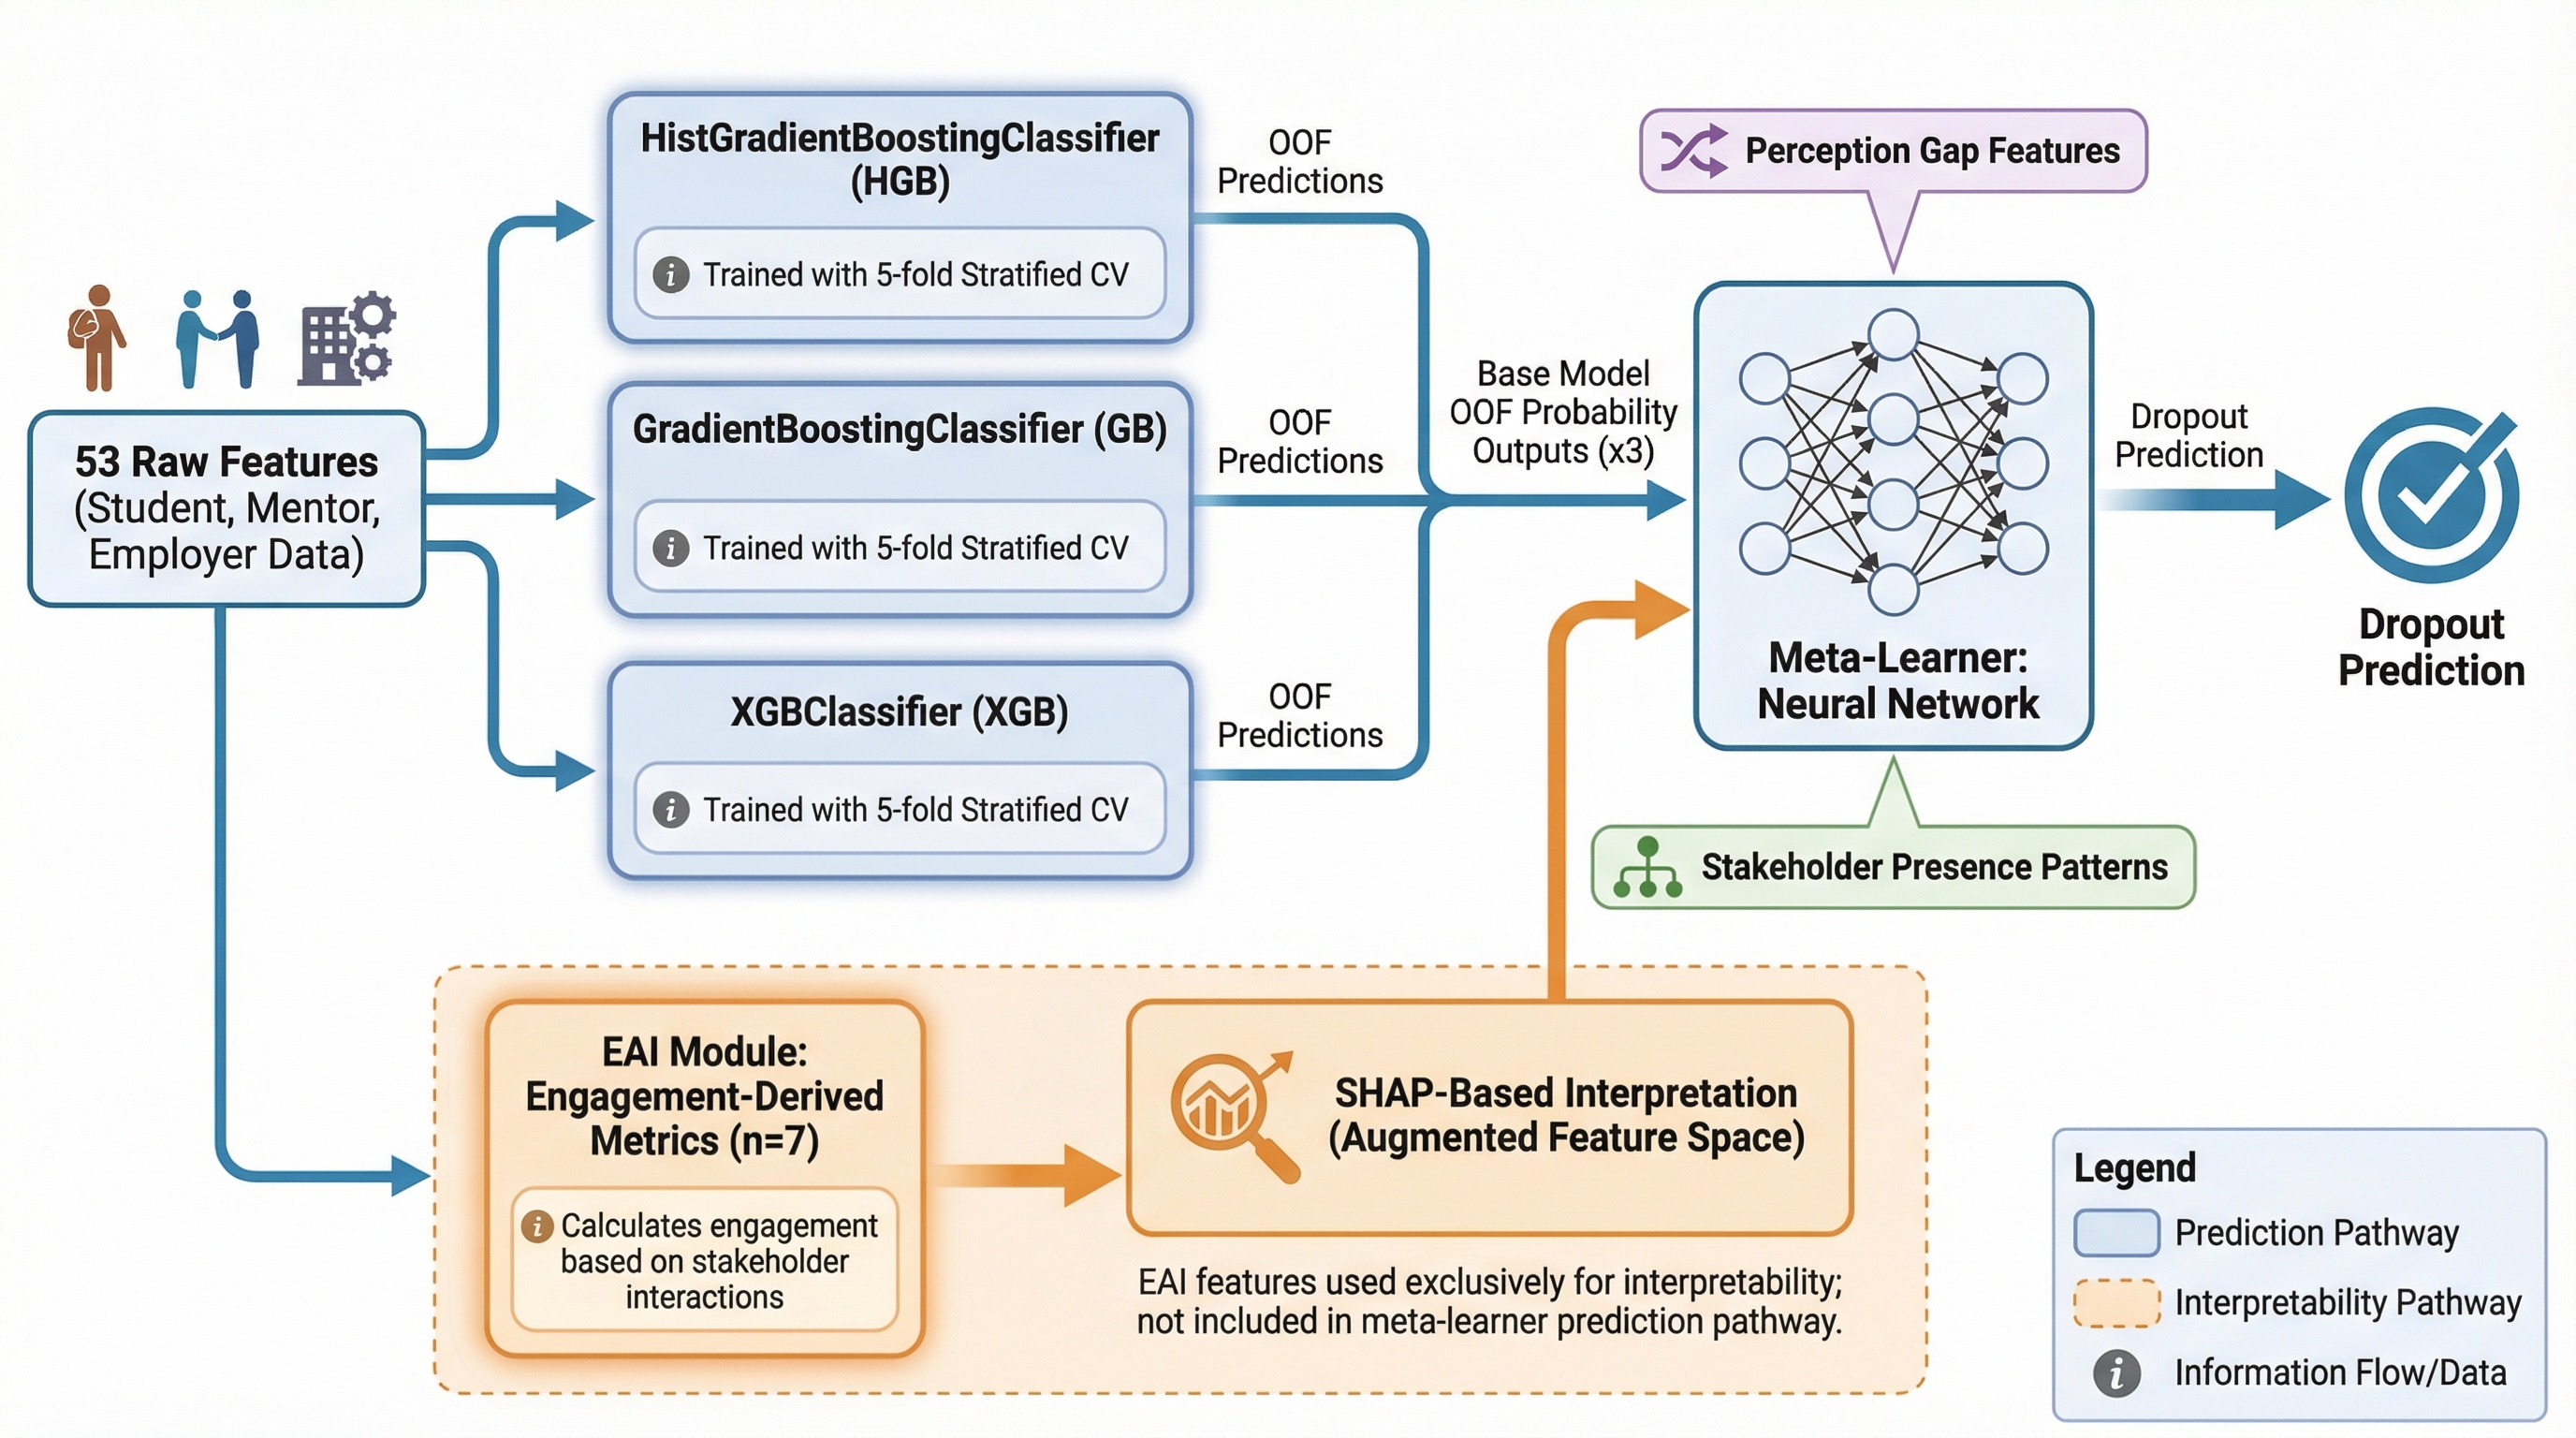
The ESPM employs a novel two-stage architecture to predict dropout in apprenticeship. ESPM leverages the complementary strengths of multiple gradient boosting algorithms while incorporating domain-specific knowledge of tri-stakeholder dynamics that are inherent to apprenticeship. The model is designed using two complementary components: (1) a two-stage prediction module that combines the gradient boosting ensembles with a perception-aware neural meta-learner, and (2) an Engagement Asymmetry Index (EAI) module, which helps to provide interpretability through engagement analysis. The overall architecture of the ESPM is presented in Figure 1.
ESPM uses separate modules for prediction and interpretability. The prediction module is designed using a two-stage stacking architecture. In stage 1 (S1), an ensemble of gradient boosting models trains on the complex feature interactions to learn from the complete feature set. In stage 2 (S2), a neural network-based meta-learner combines base models’ predictions with presence and perception-aware features to generate final dropout probabilities. Separately, we also computed EAI engagement metrics by using the EAI module, which is exclusively for SHAP-based analysis and risk stratification. The EAI features are not fed into the meta-layer for predictions to ensure clean separation between prediction accuracy and model interpretability. The design and module separation reflect our finding that EAI features are valuable for understanding the dynamics of stakeholders but do not contribute to predictive performance (see ablation results in section 6.1).
4.1 S1 - Base Model Ensemble
In ensemble stacking, we used three gradient boosting classifiers with class weighing, including (1) Histogram-based Gradient Boosting (HGB), (2) Gradient Boosting (GB), and (3) Extreme Gradient Boosting (XGB), which serve as base learners. The selection of classifiers is based on their complementary learning characteristics and their ability to efficiently handle imbalanced classes. The diversity of base models helps to capture different patterns of the data. Each base model is trained using 5-fold stratified nested cross-validation to generate out-of-fold (OOF) predictions, which help to avoid data leakage. For fold \(k\), model trained on folds \(\{1, \dots , K\} \setminus \{k\}\) to generate predictions for samples in fold \(k\). This produces an \(n \times 3\) matrix of OOF predictions, where each entry is the predicted dropout probability \(P\) (dropout) that later serves as meta-features for stage 2. The ensemble produces a prediction matrix \(\mathbf {P} \in \mathbb {R}^{n \times 3}\) where each row represents probabilities generated from all three base models.
4.2 S2 - Perception-Aware Meta-Learning
The meta-learner is a feed-forward neural network structure that combines base model predictions with additional domain-specific features to encode stakeholder dynamics. Unlike generic stacking approaches that combine base predictions, ESPM processes three distinct input streams via specialized encoders, including base predictions, perception gaps, and a presence mask. The base predictions are the OOF probability outputs of base models (XGB, GB, HGB), processed through a prediction encoder \((\text {Linear} \rightarrow \text {ReLU} \rightarrow \text {Dropout})\). The perception gaps are the 3 raw input features, extracted from the original 53 feature set (1. self_vs_master_ gap (apprentice vs master perception gap): mean self evaluation - mean master evaluation (e.g., apprentice rates their skills at 4.2/5.0, while master rates them at 3.0/5.0, the gap is +1.2, indicating overconfidence). 2. fe_gap_magniture: the absolute value of the perception gap (|1.2| = 1.2, where a large value (>1.0) regardless of direction, indicates strong misalignment). 3. fe_self_master_interaction: product of self_mean and master_mean) that are passed through a gap encoder \((\text {Linear} \rightarrow \text {Tanh} \rightarrow \text {Dropout})\) to make the meta-layer aware of perception gaps. The presence mask is a binary vector [1 (always true for apprentice), has_master_eval (employer participation flag), has_provider_eval (institutional engagement flag)] that indicates the participation of stakeholders in the evaluation, processed through a pattern encoder \((\text {Linear} \rightarrow \text {ReLU})\) to capture the completeness of the triad. The three representations are concatenated to generate a combined vector. The generated vector representation is passed to an attention layer that produces weights over the three base models, which helps to enable context-dependent model combination. Finally, the predictor network produces the final logit by processing the concatenation of raw base predictions and encoded predictions through a feed-forward network \((\text {Linear} \rightarrow \text {ReLU} \rightarrow \text {Dropout} \rightarrow \text {Linear})\). The architecture allows the meta-learner to use perception gap and presence context to weight base model results, while maintaining access to raw and encoded prediction information.
4.3 EAI Module for Interpretability
We introduce the EAI to identify the imbalanced participation level of each stakeholder group in the triad. In step 1, we compute the stakeholder engagement score, for \(s\), where \(s \in \) {apprentice, employer, provider}. We compute a normalized score in two steps, a. Sum relevant (engagement) features of the stakeholder from the original 53 feature set.
The features include all three stakeholders (1) Apprentice (Fs): self_count (self-evaluation frequency), has_self_ eval (participation flag), self_mean (average self-score). (2) Employer (Fs): master_count (master evaluation frequency), has_master_ eval (participation flag), master_mean (average master score). (3) Provider (Fs): has_tutor_eval (tutor participation), has_lea_ eval (LEA manager participation). b. Apply min-max normalization across all contracts
This produces engagement scores in \([0,1]\). In step 2, Asymmetry Calculation, it uses the vector of engagement score \(\mathbf {e} = [e_{\text {app}}, e_{\text {emp}}, e_{\text {prov}}, e_{\text {lea}}]\) to compute EAI as the coefficient of variation
where \(\sigma \) denotes the standard deviation and \(\mu \) denotes mean, and \(\epsilon = 0.01\) prevents division by zero. The higher EAI score indicates strong asymmetry or one-sided engagement, while the value closer to zero shows balanced engagement across stakeholders. In step 3, we derive interaction features from the engagement scores: \(\text {app\_emp\_sync} = 1 - \lvert e_{\text {app}} - e_{\text {emp}} \rvert \) (measuring apprentice-employer alignment), eng_completeness (proportion of stakeholders with engagement > 0.1), and \(\text {eng\_gap} = \max (\mathbf {e}) - \min (\mathbf {e})\) (capturing the range of engagement). The computed seven features are used for SHAP-based interpretability analysis, enabling decomposition of stakeholder-wise feature importance and engagement-versus-performance categories.
4.4 Meta-Learner Training
The perception-aware meta-learner is trained using BCE (binary-cross-entropy) loss with class weighing to handle the imbalance ratio. Early stopping is also applied with patience to prevent overfitting. The patience hyperparameter is tuned in the range 5 to 20 during optimization.
5. EXPERIMENTAL SETUP
All the experiments are implemented using Python 3.12, PyTorch 2.1, scikit-learn 1.4, and the Optuna hyper-parameter tuning is utilized for all baselines and the proposed approach, with 15 trials each. To evaluate ESPM, we compared it with nine baseline classifiers, including Logistic Regression (LR), Random Forest (RF), Balanced Random Forest (BRF), GB, HGB, XGB, LightGBM (LGB), CatBoost (CB), and AdaBoost (AB). All the models are evaluated using 5-fold stratified nested cross-validation: for each fold, the data split of 80% train and 20% test is performed. To avoid data leakage from repeat triads, folds are grouped by student ID to ensure that all contracts from the same student remain in the same fold to prevent student-level history (e.g., previous_ruptures_count) from leaking into the test set. The fixed random seed (42) is also used to ensure identical splits across all experiments. To evaluate the performance and considering the class imbalance issue, we have used multiple complementary evaluation metrics, Area under ROC curve (AUC) mean for ranking ability, average F1 score (threshold-optimized), average Precision and Recall for imbalanced classification. Considering the importance of identifying at-risk students, recall is prioritized as missing an at-risk student has a higher cost than a false alarm.
| Model | AUC | F1 | Precision | Recall | Specificity |
|---|---|---|---|---|---|
| ESPM | 0.9253 | 0.7221 | 0.7300 | 0.7192 | 0.9675 |
| HGB | 0.9259 | 0.6978 | 0.7360 | 0.6730 | 0.9701 |
| XGB | 0.9255 | 0.6900 | 0.6846 | 0.7026 | 0.9611 |
| GB | 0.9235 | 0.7070 | 0.7338 | 0.6835 | 0.9710 |
| LGB | 0.9223 | 0.7001 | 0.7071 | 0.6946 | 0.9662 |
| CB | 0.9207 | 0.7076 | 0.7320 | 0.6866 | 0.9701 |
| RF | 0.9188 | 0.6651 | 0.6449 | 0.7025 | 0.9513 |
| BRF | 0.9136 | 0.6513 | 0.6164 | 0.7054 | 0.9452 |
| AB | 0.9074 | 0.6701 | 0.6815 | 0.6621 | 0.9634 |
| LR | 0.8812 | 0.5828 | 0.6016 | 0.5832 | 0.9500 |
6. RESULTS AND DISCUSSION
The Table 3 illustrates the overall performance of ESPM and the baseline models. ESPM achieves the highest F1 (0.7221) and recall (0.7192), while maintaining strong precision (0.7300) and specificity (0.9675). It correctly identifies 71.9% of at-risk students compared to 67.3% by the best baseline HGB (as per AUC), representing a 6.8% relative improvement in recall. While the F1 improvement appears modest, its practical impact is significant in apprenticeship. With the highest recall, ESPM identifies additional at-risk students across the 5-fold evaluation, and considering the high cost of dropout, even a small gain in recall justifies the added architectural complexity. For the CFA managing thousands of contracts annually, such improvements could prevent additional dropouts, providing meaningful improvement for both institutional outcomes and student success. The improvement comes with a favorable trade-off, as ESPM achieves higher recall at the cost of slightly lower precision in a context where missing at-risk students carries a higher cost than unnecessary monitoring. Noticing baseline models’ pattern, gradient boosting methods (HGB, XGB, GB, LGB, CB) cluster tightly in AUC (0.9207-0.9259), confirming literature findings that these implementations achieve similar accuracy on well-engineered features. LR substantially underperforms (AUC=0.8812), indicating that non-linear interactions matter for this task.
6.1 Ablation Study
| Variant | F1 | Recall | AUC |
|---|---|---|---|
| ESPM | 0.7221 | 0.7192 | 0.9253 |
| ESPM-PresenceOnly | 0.7207 | 0.7029 | 0.9252 |
| ESPM-GapsOnly | 0.7171 | 0.7166 | 0.9245 |
| ESPM-Baseline | 0.7200 | 0.7165 | 0.9244 |
To understand the contribution of each component, we performed systematic ablation studies comparing four ESPM variants: (1) ESPM (proposed), (2) ESPM-GapsOnly (removes stakeholder presence mask), (3) PresenceOnly (removes perception gap features), and (4) ESPM-Baseline (removes both perception gaps and presence). The study shows that ESPM configuration achieves superior F1 (0.7221) and recall (0.7192). The overall comparative results are shown in Table 4. ESPM’s domain-specific design adds value beyond generic stacking by explicitly encoding tri-stakeholder structure directly into the meta-learner. Removing presence mask and perception gaps declines performance and indicates that these components capture patterns that base models alone miss. Results also show that combined features contribute to superior performance as compared to either alone. The results show that explicitly encoding apprenticeship structure through perception gaps and presence patterns improves predictions beyond what generic ensemble learning achieves.
6.2 Interpretability Analysis
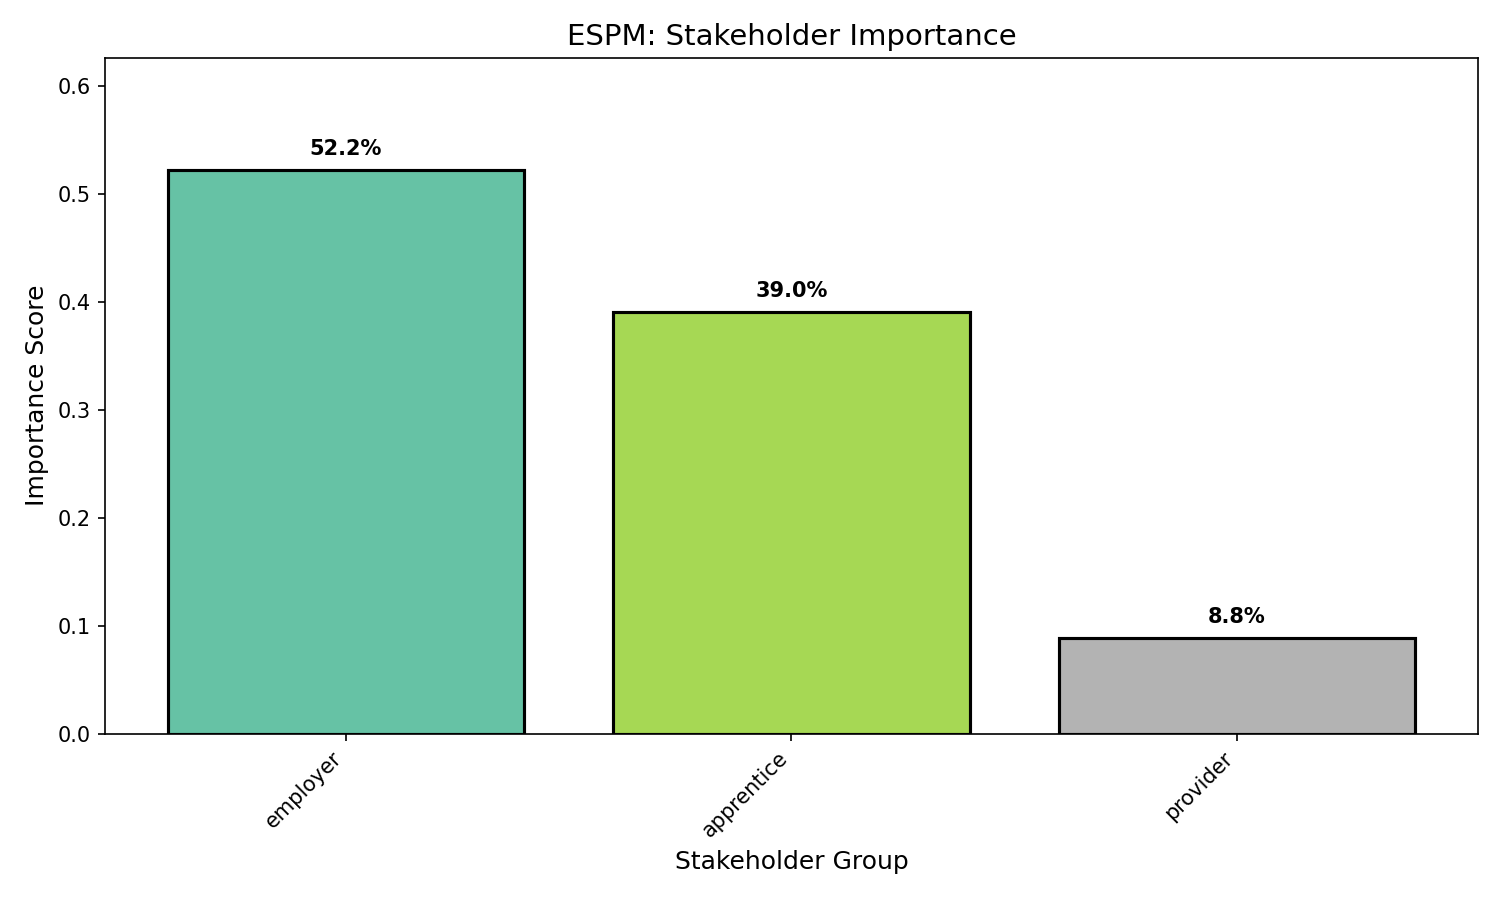
SHAP analysis is applied on the 60-feature space (53 raw + 7 EAI features) to identify which stakeholder features contribute most to the prediction task. As the ESPM meta-layer is not directly interpretable, we use a separate HGB classifier as a surrogate model, because it achieves nearly identical performance to ESPM. HGB is trained on 60 feature set solely for interpretability analysis using SHAP TreeExplainer. Analysis results in Figure 2 show that employer-related features are 52.2% of total predictive features, while the stakeholder importance for apprentice is 39.0%, and Provider features are 8.8%. It shows that workplace dynamics/employer features (52.2%) exceed apprentice and provider combined, with master_count (evaluation frequency) as the top predictor. This suggests that monitoring employer engagement is the primary risk signal. The low provider contribution (8.8%) partly reflects sparse coverage (7.2% tutor evaluation rate), but it also indicates that institution-related features are less diagnostic than workplace interactions.
Features Decomposition Methodology: To enable stakeholder-specific and engagement-vs-performance analysis, we train a separate HGB classifier on the 60-feature augmented space (53 original features + 7 EAI-derived metrics) and apply SHAP TreeExplainer. Features are categorized into two groups: Engagement features (23 features) and Performance features (30 features). The percentage contribution is computed as:
Engagement vs. Performance Decomposition: The decomposition of features into two main categories, engagement (evaluation counts, participation) versus performance (skill scores, grades), reveals that the engagement features are 56.1% of the predictive signal and the remaining 43.9% are performance features. This feature importance split challenges conventional assumptions that dropout predictions should focus on academic grades, but in our study, active stakeholders’ evaluations matter slightly more than what scores they assign. In Table 5, it is presented that the top-most important engagement feature has 75% higher SHAP importance than the most important performance feature. It shows that stakeholder disengagement precedes performance decline, so monitoring evaluation frequency in apprenticeship provides earlier warning signals. It tells that the dropout systems should alert when evaluation rates decline, not just when scores fall. The top 10 features by SHAP importance scores also reveal the dominance of engagement over performance.
| Eng. Features | Score | Perf. Features | Score |
|---|---|---|---|
| master_count | 0.156 | master_mean | 0.089 |
| total_eval_count | 0.142 | overall_skill_mean | 0.072 |
| self_count | 0.128 | self_vs_master_gap | 0.065 |
EAI Feature Contribution: The seven engagement-derived metrics are computed by the EAI module for SHAP analysis. The importance rankings of these metrics reveal which aspects of stakeholders’ asymmetry most strongly predict dropout. The overall EAI Feature Rankings by SHAP importance are (1) Engagement Gap (0.397), the difference between the most and least engaged stakeholders, (2) Apprentice Engagement (0.336), apprentice participation level. (3) Apprentice - Employer Sync (0.235), alignment between apprentice and employer, (4) Employer Engagement (0.171), employer participation level, and (5) EAI (0.159), overall imbalance coefficient. The engagement gap emerges as the most important EAI metric. This suggests that the imbalance magnitude matters more than which specific stakeholder is disengaged. An apprenticeship with one highly engaged stakeholder but two disengaged faces elevates risk regardless of who is engaged. The engagement pattern analysis is presented in Table 6. Students in "apprentice-only" pattern (where only the apprentice evaluates, without employer participation) show 41.7% dropout rate, nearly 5× higher than the minimal baseline (8.5%). This validates the critical importance of employer engagement. The EAI module transforms raw evaluation counts into meaningful stakeholder narratives.
| Pattern | Apprentice | Employer | Provider | Dropout Rate | Sample Size |
|---|---|---|---|---|---|
| Apprentice-Only | High | None | None | 41.7% | 72 |
| Employer-Only | None | High | None | 23.1% | 255 |
| Apprentice-Employer | High | High | None | 28.6% | 35 |
| Full Triad | High | High | Present | 40.0% | 5 |
| Minimal | Low | Low | None | 8.5% | 3144 |
7. CONCLUSION AND LIMITATIONS
This paper presents the ESPM approach for dropout predictions in apprenticeship. By modeling the tri-stakeholder dynamic using perception gap features and stakeholder presence mask pattern, ESPM achieves superior performance in terms of F1, Recall, and interpretability compared to nine baseline models. To achieve interpretability, the separate EAI module is used, which enables decomposition of predictive signal by stakeholder and engagement-vs-performance categories. The analysis reveals that engagement features contribute 52.2% and outweigh the performance features 43.9%. The overall findings show that stakeholder disengagement precedes performance decline, challenging conventional grade / performance-focused dropout prediction. Our findings have some implications beyond apprenticeship. First, the dominance of engagement over performance challenges conventional grade-focused learning analytics assumptions for predictions. Second, perception gap features offer a generalizable approach to model expectations misalignment in any feedback-intensive domain (employee reviews or peer assessments, etc.). Third, the tri-stakeholder framework can generalize to other triad contexts (internships or collaborative projects, etc.) as well. The study has some limitations as well, including limited generalizability to other institutes or countries, as our data originates from a single formation (CFA). Another limitation is the sparse coverage of tutor and LEA evaluations, which limits our ability to fully model provider engagement. The dominance of employer features (52.2%) may reflect feature availability bias, as employer evaluations are recorded more often than provider evaluations, which can inflate SHAP importance. The finding that engagement outweighs performance should therefore be interpreted with caution since evaluation frequency is linked to the contract duration and student persistence, where longer contracts generate more records.
8. REFERENCES
- D. Abriac, R. Rathelot, and R. Sanchez. L’apprentissage, entre formation et insertion professionnelles. Formations et emploi, pages 57–74, 2009.
- L. Aulck, N. Velagapudi, J. Blumenstock, and J. West. Predicting student dropout in higher education. arXiv preprint arXiv:1606.06364, 2016.
- S. Billett. Vocational education: Purposes, traditions and prospects. Springer Science & Business Media, 2011.
- S. Böhn and V. Deutscher. Dropout from initial vocational training–a meta-synthesis of reasons from the apprentice’s point of view. Educational Research Review, 35:100414, 2022.
- D. Delen. A comparative analysis of machine learning techniques for student retention management. Decision Support Systems, 49(4):498–506, 2010.
- D. Dunning, K. Johnson, J. Ehrlinger, and J. Kruger. Why people fail to recognize their own incompetence. Current directions in psychological science, 12(3):83–87, 2003.
- S. Field. A world of difference: International apprenticeship policy and lessons for england, 2025.
- A. Fuller and L. Unwin. Learning as apprentices in the contemporary uk workplace: creating and managing expansive and restrictive participation. Journal of Education and work, 16(4):407–426, 2003.
- L. Gambin and T. Hogarth. Factors affecting completion of apprenticeship training in england. Journal of Education and Work, 29(4):470–493, 2016.
- L. Grinsztajn, E. Oyallon, and G. Varoquaux. Why do tree-based models still outperform deep learning on typical tabular data? Advances in neural information processing systems, 35:507–520, 2022.
- G. Ke, Z. Xu, J. Zhang, J. Bian, and T.-Y. Liu. Deepgbm: A deep learning framework distilled by gbdt for online prediction tasks. In Proceedings of the 25th ACM SIGKDD international conference on knowledge discovery & data mining, pages 384–394, 2019.
- J. Mohrenweiser and U. Backes-Gellner. Apprenticeship training: for investment or substitution? International Journal of Manpower, 31(5):545–562, 2010.
- A. Plé. L’apprentissage en 2023. Dares résultats, no. 72, DARES – Direction de l’Animation de la Recherche, des Études et des Statistiques, 2024.
- A. Plé. L’apprentissage en 2024. Dares résultats, no. 3, DARES – Direction de l’Animation de la Recherche, des Études et des Statistiques, 2026.
- M. Rebelo Marcolino, T. Reis Porto, T. Thompsen Primo, R. Targino, V. Ramos, E. Marques Queiroga, R. Munoz, and C. Cechinel. Student dropout prediction through machine learning optimization: insights from moodle log data. Scientific Reports, 15(1):1–16, 2025.
- République
Française.
Loi
n°
2018-771
du
5
septembre
2018
pour
la
liberté
de
choisir
son
avenir
professionnel.
https://www.legifrance.gouv.fr/loda/id/JORFTEXT000037367660, 2018. - R. Shwartz-Ziv and A. Armon. Tabular data: Deep learning is not all you need. Information Fusion, 81:84–90, 2022.
- A. Villar and C. R. V. de Andrade. Supervised machine learning algorithms for predicting student dropout and academic success: a comparative study. Discover Artificial Intelligence, 4(1):2, 2024.
- D. H. Wolpert. Stacked generalization. Neural networks, 5(2):241–259, 1992.
- S. C. Wolter and P. Ryan. Apprenticeship. In Handbook of the Economics of Education, volume 3, pages 521–576. Elsevier, 2011.
- X. Yang, Y. Zhao, and X. Chen. A novel transformer-based stacking ensemble method with multi-model integration for cancer classification. PeerJ Computer Science, 11:e3314, 2025.
© 2026 Copyright is held by the author(s). This work is distributed under the Creative Commons Attribution-NonCommercial-NoDerivatives 4.0 International (CC BY-NC-ND 4.0) license.