ABSTRACT
Item response theory (IRT) is a modeling framework that defines the probability of a correct response through an item characteristic curve (ICC), which is a function of examinee ability and item characteristics. However, since IRT-based estimation typically requires large-scale pretesting with many examinees, question difficulty estimation from text (QDET) has been proposed to estimate item characteristics directly from text. While prior QDET models designed the objective function to align each parameter separately, we instead focus on the shape similarity of ICCs. In addition, we introduce an approach that leverages not only labeled IRT data but also auxiliary information available on real-world e-learning platforms. This allows us to learn from both items with estimated parameters and items whose parameters have not been estimated, using difficulty ordering information such as curriculum level.
We propose two loss terms that exploit both labeled and unlabeled items while reflecting the relationship between item parameters and the ICC. First, since the ICC can be approximated by the cumulative distribution function of a normal distribution, the similarity between ICCs can be formulated as the similarity between normal distributions. Second, we introduce a contrastive loss that leverages relative difficulty information for unlabeled items by formulating an inequality between the normal distributions induced by the ICCs.
Experiments on real-world data from an e-learning platform show that our method improves binary cross-entropy by 2.02% over an MSE-based baseline when predicting student response correctness on unseen items.
Keywords
1. INTRODUCTION
In recent years, the widespread adoption of online learning platforms has enabled the large-scale collection of learning logs and immediate feedback. Accordingly, personalized learning technologies that leverage data to assess learners’ proficiency levels and progress, and to provide optimal questions from within the platform by considering item characteristics such as difficulty, have garnered significant attention [1, 21]. Consequently, identifying item characteristics within the platform is one of the critical challenges for the realization of personalized learning.
To measure item characteristics, item response theory (IRT) [12, 17, 26] is a widely adopted statistical framework that estimates item parameters, such as difficulty and discrimination, from students’ response data and represents the probability of a correct response through an item characteristic curve (ICC) based solely on these item properties and student ability. The IRT framework has the advantage of enabling stable measurement of ability scores that are independent of test difficulty and student group characteristics, and it has been adopted in various fields, ranging from psychological experiments to large-scale tests such as the SAT and TOEFL.
In applying IRT frameworks, pretest measurement of item characteristics is typically conducted. To obtain stable item parameter estimates, it is necessary to secure a sufficiently large and ability-diverse sample of students and to ensure that they are adequately motivated to engage with the items. Consequently, for platforms containing a large volume of items, measuring the characteristics of every item through pretesting poses a significant challenge in terms of both temporal and financial resources.
To address these resource-intensive requirements, research on question difficulty estimation from text (QDET) [6], which leverages natural language processing (NLP) to estimate item characteristics directly from text, has become active.
In existing approaches of QDET, item parameters are typically predicted by formulating the task as a regression problem. For example, in the two-parameter logistic (2PL) model, a standard model in IRT, each item has two parameters, difficulty and discrimination, and these parameters are commonly predicted by minimizing the sum of squared errors for each parameter.
Since these two parameters collectively define the functional form of the ICC, it is more principled to formulate an ICC-based optimization task rather than individually minimizing the loss function for each parameter. Such an approach enables the inference of item characteristics aligned with learners’ response accuracy, which is expected to capture the interplay between difficulty and discrimination, thereby improving overall predictive performance.
Furthermore, regression-based QDET is typically formulated as a supervised learning problem. Consequently, the training is restricted to items for which item characteristics, such as difficulty and discrimination, have been previously measured through IRT. However, in practical applications, even when explicit item difficulty or discrimination labels are absent, auxiliary data providing implicit signals are often available. For example, if problem sets are labeled as “beginner” or “advanced,” it is natural to assume that items in the advanced set possess higher difficulty.
The contributions of this work are as follows.
- Proposal of a new ICC-based supervised loss for QDET : We propose a novel supervised loss term to jointly characterize the difficulty and discrimination parameters. This loss function is designed based on the discrepancy between latent variable distributions, focusing on the shape of the ICC.
- Proposal of a new contrastive loss using unlabeled data for QDET : We propose a novel contrastive loss term to incorporate unlabeled item texts. This loss term leverages auxiliary information to utilize items with unknown parameters, directly contributing to improved predictive performance.
- Performance evaluation using real-world student response data: We evaluate the effectiveness of our proposed loss terms by comparing them with conventional methods in terms of their ability to predict students’ correct and incorrect responses on an actual e-learning platform.
Since our focus is on the loss function rather than a specific model architecture in this study, the experiments are conducted using relatively simple models. However, we expect them to be broadly applicable to QDET using 2PL models by replacing the training objective in existing text-to-parameter models.
2. RELATED WORK
In this work, we aim to estimate IRT item parameters, specifically difficulty and discrimination, directly from text by leveraging both supervised and contrastive learning. To ground our approach, we first review the foundations of IRT and the current state of QDET. Subsequently, we provide an overview of contrastive learning frameworks.
2.1 Item Response Theory
IRT is a modeling framework that predicts the probability of an examinee’s correct response using parameters such as difficulty, discrimination, and student ability [12, 17, 26]. The item characteristic curve (ICC) describes the relationship between the probability of a correct response and the student’s ability for given item parameters. Because of their interpretability and flexibility, IRT models are widely adopted in various fields, ranging from psychological experiments to large-scale standardized tests such as SAT and TOEFL.
In IRT, the one-parameter logistic (1PL) and two-parameter logistic (2PL) models are standard formulations [17, 26].
The 1PL model, also called the Rasch model, considers only item difficulty and student ability. The probability of a correct response by student \(j\) to item \(i\) is given by:
where the sigmoid function \(\sigma (x)\) is defined as \(( 1+\mathrm {e}^{-x} )^{-1}\). \(\theta _j\) denotes the ability of the student \(j\), and \(b_i\) denotes the difficulty of the item \(i\). As \(b_i\) increases, the probability of a correct response to the item decreases; conversely, as \(\theta _j\) increases, the student’s probability of a correct response increases.
\(D\) is referred to as a scaling constant, typically set to 1.702 to ensure the following approximation holds [8]:
The 2PL model additionally accounts for the item discrimination parameter \(a_i\). For student \(j\), the probability of a correct response to item \(i\) is formulated as:
where \(a_i\) is a parameter that determines the slope of the curve. As item discrimination \(a_i\) increases, the probability of a correct response becomes more sensitive to the difference between \(\theta _j\) and \(b_i\), resulting in a steeper ICC. Consequently, \(a_i\) is an indicator for assessing how effectively an item differentiates between students of varying ability levels.
2.2 Question Difficulty Estimation from Text
To obtain stable item parameter estimates in IRT, it is necessary to secure a sufficiently large and ability-diverse sample of students while ensuring that they are adequately motivated to engage with the items. Consequently, the application of IRT in practice requires extensive field testing, which demands substantial temporal and financial resources. To address this challenge, QDET has been proposed as an approach that leverages NLP to infer item characteristics, such as difficulty, directly from text; for a comprehensive review, see [6].
In early QDET research, the prevailing approach involved applying feature engineering to item text and constructing regression models based on the resulting features. A representative example is R2DE [4, 5], which leverages TF-IDF [28] features to estimate IRT item parameters, specifically difficulty and discrimination.
In recent years, pre-trained language models (PLMs) such as BERT [10] and GPT [25] have emerged as one of the dominant approaches in NLP due to their ability to effectively model complex linguistic contexts. Given their superior performance over conventional feature-based methods, PLM-based approaches have also been applied to QDET. For instance, Benedetto et al. demonstrated that using BERT and DistilBERT to predict IRT parameters outperforms traditional feature-driven models [3]. In addition, Lalor et al. proposed an approach that utilizes multiple PLMs as artificial crowds to generate responses for unlabeled items [13]. This framework enables the zero-shot estimation of IRT parameters based purely on model-generated responses, thus eliminating the need for labeled training data.
2.3 Contrastive Learning
Contrastive learning is a training framework that enhances model performance and representations by contrasting positive and negative samples. It has been widely adopted across various domains, including NLP, recommender systems, and computer vision [11, 24, 27].
In the field of educational technology, contrastive learning has been incorporated into several Knowledge Tracing (KT) studies, which aim to track students’ proficiency over time. For instance, CL4KT generates negative samples by flipping answer correctness, enabling data augmentation grounded in contrastive learning [15]. Additionally, Q-MCKT demonstrates that the inclusion of contrastive learning during training improves prediction accuracy for items with sparse response data [29].
In recent years, one of the most commonly used loss functions in contrastive learning is InfoNCE [20, 22], which aims to maximize the difference between the scores of positive and negative samples. This loss function, also referred to as NT-Xent [9], is defined as follows:
where \(\tau \) is the temperature parameter, and \(s_\pm \) are the scores of the positive and negative samples, respectively. When only a single negative sample is used, the loss function simplifies to:
which is referred to as the pairwise logistic loss or BPR loss [7, 27].
One of the advantages of contrastive learning is that a model can be trained without fully labeled data, provided that relative relationships between positive and negative samples are available. Consequently, it is extensively adopted in scenarios with limited labeled data. On many educational platforms, it is not uncommon for the volume of unlabeled items to far exceed those with labels, due in part to the high cost of obtaining labeled item parameters (e.g., difficulty and discrimination). Therefore, contrastive learning can be expected to be useful in such cases.
Despite this, the role of contrastive learning in IRT and QDET remains underexplored, as existing research has predominantly relied on supervised methods using labeled item parameters [2–5].
3. METHODOLOGY
We propose an ICC-based loss that combines supervised and contrastive terms for learning item parameters from text. The overall loss function \(\mathcal {L}\) is defined as follows:
where \(\mathcal {L}_{\mathrm {CS}}\) and \(\mathcal {L}_{\mathrm {con}}\) represent the supervised and contrastive loss terms, respectively. The hyperparameter \(\lambda \) balances the contributions of these two terms. The detailed definitions of \(\mathcal {L}_{\mathrm {CS}}\) and \(\mathcal {L}_{\mathrm {con}}\) are provided in the following subsections.
3.1 Supervised Loss
The item difficulty \(b_i\) and item discrimination \(a_i\) are inseparable parameters that jointly determine the ICC and the probability of a correct response. Therefore, instead of focusing on \(b_i\) and \(a_i\) as separate scalar values, we focus on the probability distribution of the latent variable \(z_i\) defined by these parameters. This approach enables us to directly optimize the joint distribution, yielding parameter estimates that better reflect the actual response behavior.
By defining the latent variable \(z_i\) as a random variable following a normal distribution, \(z_i \sim \mathcal {N}(b_i, a_i^{-2})\) [16], the 2PL ICC in Eq. (3) can be approximated using the relationship established in Eq. (2):
Since \(z_i\) is a sample from a normal distribution with the difficulty parameter as its mean, it can be interpreted as the realized difficulty faced by examinees, accounting for noise due to factors such as testing conditions.
We define the supervised loss \(\mathcal {L}_{\mathrm {CS}}\), which optimizes the predicted item parameters \(\hat {b}_i\) and \(\hat {a}_i\) so that the induced latent variable distribution \(\mathcal {N}(z \mid \hat {b}_i, \hat {a}_i^{-2})\) is close to the target distribution \(\mathcal {N}(z \mid b_i, a_i^{-2})\). Specifically, we employ the Cauchy-Schwarz divergence (CSD) [23], which serves as a measure of the discrepancy between two probability distributions. The supervised loss \(\mathcal {L}_{\mathrm {CS}}\) is defined as follows:
where \(L_i\) represents the discrepancy for a single item \(i\). Here, \(\mathcal {D}_{\mathrm {CS}}\) is the set of items whose difficulty and discrimination are known.
We also experimented with other closed-form distributional discrepancies (e.g., Kullback–Leibler divergence and Hellinger distance). Among them, CSD yielded the best performance in our experiments(Appendix B).
3.2 Contrastive Loss
We denote \((i_+, i_-)\) as an ordered pair of items where the relative difficulty order is determined by auxiliary information, such as metadata tags or learning course titles. The contrastive loss \(\mathcal {L}_{\mathrm {con}}\) is defined based on the negative log-likelihood of the relationship \(z_+ > z_-\), formulated as follows:
Here, \(\mathcal {D}_{\mathrm {con}}\) is the set of item pairs for which only the relative order of difficulty is known. In Eq. (9), we used the approximation given by Eq. (2).
4. EXPERIMENTS
We conduct experiments to clarify the following two points.
- The supervised loss \(\mathcal {L}_{\mathrm {CS}}\) yields more accurate predictions of correct responses compared to mean squared error (MSE).
- Adding the contrastive loss \(\mathcal {L}_{\mathrm {con}}\) improves model performance.
4.1 Dataset
As experimental data, among the materials available on ZEN Study1, an e-learning platform for students, we selected learning materials designed for junior high and high school students. We focused on the four subjects for which a dedicated pretest was conducted: English, Mathematics, Japanese, and Social Studies. Since the platform manages its materials in HTML format, we performed preprocessing by removing non-text elements (e.g., images and hyperlinks), eliminating duplicate and highly similar materials, and converting the content to Markdown.
The sizes of the datasets used in our experiments are shown in Table 1. To evaluate the model’s performance on unseen items, the supervised training and evaluation datasets are disjoint.
From this supervised dataset, we held out 10% of the items from training directly and used them only for hyperparameter tuning and early stopping. The item characteristics used as supervised training data were estimated under a Bayesian 2PL IRT framework, with normal priors placed on item difficulty and learner ability and a log-normal prior on item discrimination to enforce positivity.
For the contrastive training data, we leveraged auxiliary information available on the e-learning platform (e.g., metadata tags and course titles). Specifically, we selected candidate pairs of items from similar topics, such as those belonging to the same chapter or whose titles became identical after stripping prefix/suffix tags and numbers. From these candidates, we used only pairs whose metadata, such as course names, tags, or title prefixes/suffixes, clearly indicated a difference in difficulty between the two items , excluding those with comparable difficulty levels. Pairs with comparable difficulty levels in the metadata were excluded. To address the data imbalance across subjects, the sampling probabilities during training were adjusted to ensure that each subject (e.g., English, Mathematics, Japanese, and Social Studies) was sampled with equal probability. The sizes of these supervised and contrastive datasets are summarized in Table 1a.
In addition, we conducted an independent evaluation test administration to assess the model’s performance; the sizes of this evaluation dataset are summarized in Table 1b. The "log" column indicates the number of student-item response records, while the "item" and "student" columns show the counts of unique items and unique students, respectively. If the same student participated in multiple subjects, they were treated as distinct students for each subject.
4.2 Model Architecture
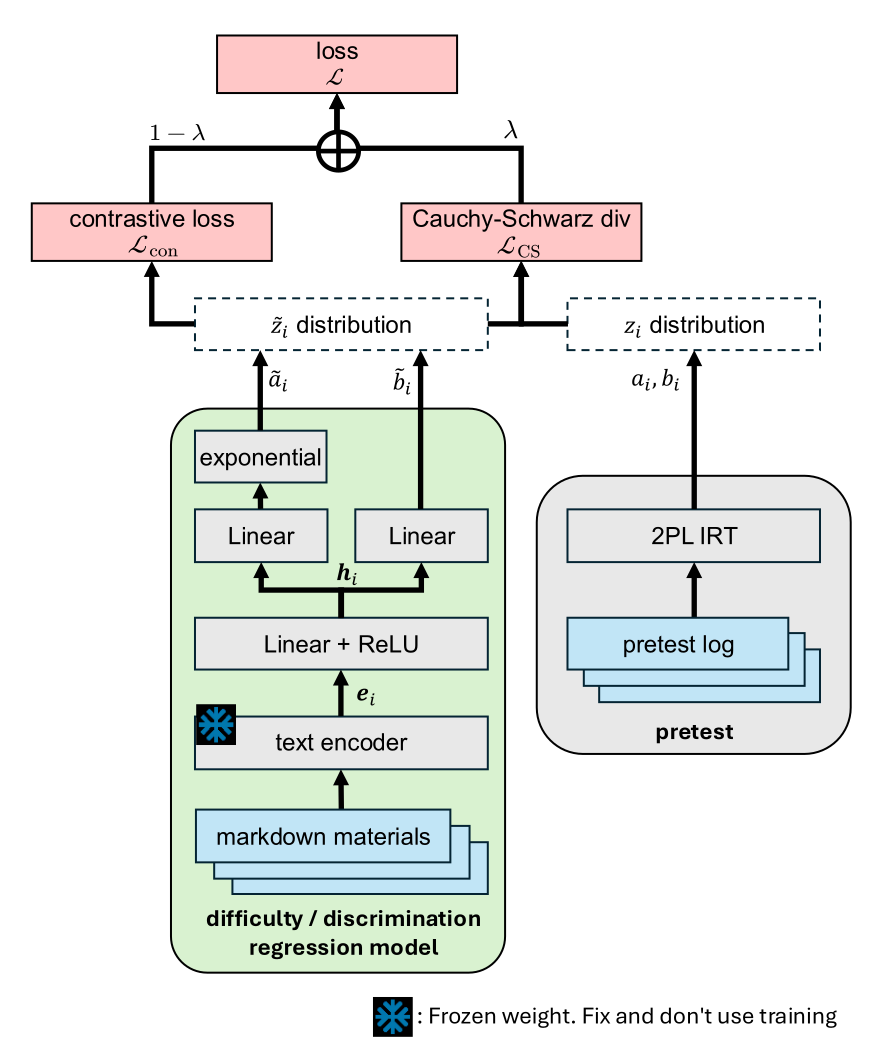
As in conventional QDET, the model is based on neural networks and is designed to jointly predict item difficulty and discrimination from question text. As illustrated in Figure 1, the architecture consists of two primary components: a text encoder and a feed-forward network (FFN). To highlight the impact of the loss terms, we adopt a simple model architecture so that performance differences can be attributed primarily to the training objective.
4.2.1 Text-Encoder
For each item, the Markdown text is input to the encoder to compute a \(d_{\mathrm {enc}}\)-dimensional text embedding. We utilized a pre-trained language model (PLM) as the text encoder and kept its parameters frozen while training the remaining components. Specifically, we employed Gemini Embedding [14] with its default output dimension of \(d_{\mathrm {enc}} = 3{,}072\).
4.2.2 Feed-Forward Network
Given the text embedding \(\bm {e}_i\), we employ an FFN to estimate the item difficulty \(\tilde {b}_i\) and discrimination \(\tilde {a}_i\):
where \(W \in \mathbb {R}^{d_h \times d_{\mathrm {enc}}}\), \(\bm {w}_0 \in \mathbb {R}^{d_h}\), \(\bm {w}_b, \bm {w}_a \in \mathbb {R}^{d_h}\), and \(w_{b0}, w_{a0}\) \(\in \mathbb {R}\) are learnable parameters. We set the hidden dimension to \(d_h = 64\). ReLU denotes the rectified linear unit activation function, defined as \(\mathrm {ReLU}(x)=\max \{x,0\}\) [19]. As the discrimination parameter must be positive, an exponential transformation is applied to the corresponding FFN output.
4.3 Evaluation
To benchmark the effectiveness of our proposed CSD-based supervised loss \(\mathcal {L}_{\mathrm {CS}}\), we compare against a baseline model that employs MSE of the difficulty and discrimination parameters as the loss function. Furthermore, as an ablation study to verify the effectiveness of the contrastive loss \(\mathcal {L}_{\mathrm {con}}\), we also compare it with a model that removes the contrast loss term. We also introduce a baseline that applies the pairwise logistic loss (Eq. 5) only to the difficulty parameter; in this setting, the temperature \(\tau \) is fixed at \(D^{-1}\).
As the primary evaluation metric, we calculate the binary cross-entropy (BCE) over the evaluation response logs, between the observed student correctness and the predicted response probability. The predicted probability for student \(j\) on item \(i\) is computed via Eq. (3) using the predicted item parameters (\(\tilde {a}_i, \tilde {b}_i\)) and the student ability \(\theta _j\) estimated from pretests:
Here, \(y_{ij} \in \{0, 1\}\) denotes the observed correctness of student \(j\) on item \(i\). To provide further insight into parameter estimation accuracy, we also evaluate the performance using the Root Mean Squared Error (RMSE) for difficulty and discrimination, as well as the CSD for each item.
4.4 Implementation Details
The learning rate was set to \(1 \times 10^{-4}\), and we used the AdamW optimizer [18]. The batch size was set equal to the total size of the supervised training dataset. Training used early stopping, and patience set to 200 epochs. The hyperparameter \(\lambda \) was tuned via grid search over the range \(\{0.1, 0.2, \ldots , 0.9\}\).
5. RESULT
| supervised loss | CSD | MSE |
pretest |
|||||
|---|---|---|---|---|---|---|---|---|
| contrastive loss | \(a, b\) | \(b\) | nothing | \(a, b\) | \(b\) | nothing | ||
| \(\lambda \) | 0.9 | 0.9 | 1.0 | 0.8 | 0.9 | 1.0 | - | |
|
BCE | English | 0.5567 | 0.5592 | 0.5600 | 0.5725 | 0.5745 | 0.5757 | 0.5213 |
| Mathematics | 0.5569 | 0.5576 | 0.5599 | 0.5696 | 0.5705 | 0.5727 | 0.5145 | |
| Japanese | 0.6167 | 0.6187 | 0.6162 | 0.6280 | 0.6288 | 0.6278 | 0.5608 | |
| Social Studies | 0.6160 | 0.6148 | 0.6164 | 0.6187 | 0.6174 | 0.6187 | 0.5612 | |
| Average | 0.5866 | 0.5876 | 0.5882 | 0.5972 | 0.5978 | 0.5987 | 0.5394 | |
|
CSD | English | 0.0811 | 0.0799 | 0.0883 | 0.0827 | 0.0837 | 0.0883 | - |
| Mathematics | 0.0863 | 0.0869 | 0.0898 | 0.0982 | 0.0987 | 0.1018 | - | |
| Japanese | 0.1205 | 0.1212 | 0.1200 | 0.1244 | 0.1244 | 0.1245 | - | |
| Social Studies | 0.0942 | 0.0953 | 0.0925 | 0.1014 | 0.1012 | 0.1024 | - | |
| Average | 0.0955 | 0.0958 | 0.0976 | 0.1017 | 0.1020 | 0.1043 | - | |
|
RMSE-\(b\) | English | 0.6190 | 0.6066 | 0.6553 | 0.6272 | 0.6326 | 0.6473 | - |
| Mathematics | 0.5919 | 0.5883 | 0.6028 | 0.6315 | 0.6298 | 0.6416 | - | |
| Japanese | 0.8491 | 0.8384 | 0.8736 | 0.8327 | 0.8333 | 0.8423 | - | |
| Social Studies | 0.6788 | 0.6733 | 0.6926 | 0.6879 | 0.6871 | 0.7000 | - | |
| Average | 0.6847 | 0.6766 | 0.7061 | 0.6948 | 0.6957 | 0.7078 | - | |
|
RMSE-\(a\) | English | 0.5628 | 0.5645 | 0.5515 | 0.4981 | 0.4963 | 0.4956 | - |
| Mathematics | 0.4606 | 0.4627 | 0.4594 | 0.4281 | 0.4265 | 0.4285 | - | |
| Japanese | 0.5551 | 0.5555 | 0.5411 | 0.5152 | 0.5092 | 0.5076 | - | |
| Social Studies | 0.3740 | 0.3842 | 0.3904 | 0.3663 | 0.3748 | 0.3767 | - | |
| Average | 0.4881 | 0.4917 | 0.4856 | 0.4519 | 0.4517 | 0.4521 | - | |
To validate the effectiveness of \(\mathcal {L}_{\mathrm {CS}}\) and \(\mathcal {L}_{\mathrm {con}}\), we compute the BCE for student response correctness on the evaluation dataset, and measure the CSD and RMSE for each item. These results are summarized in Table 2. The hyperparameters \(\lambda \) reported are those that achieved the lowest Average BCE during our grid search. The "pretest" column shows the BCE computed using item parameters directly estimated from student response logs, which serves as a theoretical performance ceiling for the models.
First, we examine the performance of our proposed CSD loss compared to the conventional MSE loss. The CSD loss achieved better performance than the MSE loss in almost all metrics, and this trend was observed regardless of whether contrastive learning was used. Compared to the baseline MSE value (0.5987\(\pm \)0.0008), switching the supervised loss to CSD yielded (0.5882\(\pm \)0.0003), corresponding to a \(1.75\%\) relative improvement in BCE; here, values are reported as the mean \(\pm \) standard deviation over five independent runs. A paired t-test was conducted to compare the average BCE, yielding a \(p\)-value of \( 8 \times 10^{-7} \) and the null hypothesis was rejected. Improvements were observed across all four subjects—English, Mathematics, Japanese, and Social Studies. In terms of BCE, the CSD-based model outperformed the MSE-based model in every subject.
Next, we evaluate the impact of contrastive learning. Regardless of the supervised loss employed (CSD or MSE), incorporating our proposed contrastive loss (Eq. (9)) improved performance on all metrics except RMSE-\(a\). Furthermore, the proposed contrastive loss outperformed the pairwise-logistic loss (Eq. (5)), in many metrics including BCE. In particular, under the baseline MSE supervised loss, introducing our contrastive objective improved BCE from 0.5987\(\pm \)0.0008 to 0.5972\(\pm \)0.0008, corresponding to a 0.25% relative improvement. A paired t-test was conducted to compare the average BCE, yielding a \(p\)-value of \(2\times 10^{-3}\) and the null hypothesis was rejected.
However, we did not observe a clear improvement in RMSE-\(a\). With the CSD supervised loss, we speculate that this is because our objectives emphasize aspects directly related to student correctness, rather than regions where the discrimination parameter \(a\) becomes excessively large or small. For contrastive learning, we expected our proposed loss (Eq. (9)), which explicitly incorporates both \(a\) and \(b\), to yield a smaller RMSE\(-a\) than the pairwise-logistic loss (Eq. (5)) that learns only \(b\); however, this was not observed in our experiments. This point requires more in-depth investigation in future work. This point requires more in-depth investigation in future work, particularly regarding which types of contrastive item pairs contribute to better generalization.
Overall, our proposed two loss terms resulted in the highest predictive accuracy across the evaluated metrics, underscoring the effectiveness of the proposed framework for the QDET task. Compared to the conventional MSE baseline without contrastive learning (BCE: 0.5987\(\pm \)0.0008), our proposed loss combination (CSD with the proposed contrastive loss) achieved a BCE of 0.5866\(\pm \)0.0007, corresponding to a 2.02% relative improvement.
6. LIMITATIONS AND FUTURE WORK
Our study focuses on a 2PLM-based neural regression model for estimating item difficulty and discrimination directly from question texts. Consequently, it remains to be explored whether our proposed method is applicable to other IRT formulations, such as the 1PL or 3PL models, and whether such extensions would yield similar benefits. In addition to neural regression models, QDET encompasses diverse approaches, including those leveraging artificial crowds [13]. Integrating our method with such approaches remains a challenge for future work.
Furthermore, it remains to be verified whether this approach can contribute to the realization of personalized learning and the enhancement of the student learning experience. Consequently, the practical utility of the proposed method for educational applications should be substantiated through further experimental studies on real-world e-learning platforms.
7. CONCLUSION
This study proposes two loss terms for estimating question difficulty and discrimination from text, with a focus on the ICC and contrastive learning. First, we introduced a supervised loss term designed to align the model’s latent variable distribution with that of the training data. Second, leveraging relative difficulty orders derived from auxiliary information, we proposed a contrastive loss term based on the order of latent variables.
Using real-world data from an e-learning platform, the experiments confirmed that the proposed loss terms outperform baseline methods in predicting student response correctness, achieving a \(2.02\%\) improvement in BCE. These results demonstrate the potential of the method to reduce the costs associated with large-scale pretesting and to contribute to the reliable estimation of item parameters.
8. ACKNOWLEDGMENTS
The authors would like to acknowledge the support of DWANGO Co, Ltd. and KADOKAWA DWANGO Educational Institute for this work.
APPENDIX
A. DERIVATION EQUATIONS
A.1 Derivation cumulative distribution function from the 2PL ICC
Equation \eqref{eq7} can be rewritten as
A.2 Derivation of the supervised loss
We define the per-item supervised loss by the Cauchy–Schwarz divergence:
The following identity holds for the integral of the product of two Gaussian densities.
Therefore, the integrals in Eq.(14) can be evaluated as follows:
Substituting these expressions into Eq. \eqref{eq:appUNDERSCOREcsdUNDERSCOREdef}, we obtain the closed-form expression
.
A.3 Derivation of the contrastive loss
B. ALTERNATIVE SUPERVISED LOSSES
Before fixing CSD as our supervised objective, we conducted a preliminary experiment to determine which metric is most suitable for measuring the similarity between the latent-variable distributions. As candidate metrics, we selected divergences that admit closed-form expressions between two Gaussian distributions, so that they can be incorporated into training without numerical approximation. Specifically, we compared CSD with the Kullback–Leibler (KL) divergence and the Hellinger distance, while keeping the rest of the training framework unchanged. Table 3 summarizes the resulting BCE on the evaluation set for each supervised loss, combined with the three contrastive settings considered in the main paper. The results show that CSD consistently achieved the lowest BCE across all three contrastive settings.
| supervised loss
| ||||
|---|---|---|---|---|
| contrastive loss | CSD | KL | Hellinger | MSE |
| \(a, b\) | 0.5866 | 0.5934 | 0.5892 | 0.5972 |
| \(b\) | 0.5876 | 0.5950 | 0.5914 | 0.5978 |
| nothing | 0.5882 | 0.5957 | 0.5894 | 0.5987 |
The KL divergence and Hellinger distance used in this comparison are given below:
References
- A. Alkhatlan and J. Kalita. Intelligent tutoring systems: A comprehensive historical survey with recent developments. International Journal of Computer Applications, 181(43):1–20, Mar 2019.
- G. Aradelli. Transformers for question difficulty estimation from text, 2020.
- L. Benedetto, G. Aradelli, P. Cremonesi, A. Cappelli, A. Giussani, and R. Turrin. On the application of transformers for estimating the difficulty of multiple-choice questions from text. In Proceedings of the 16th workshop on innovative use of NLP for building educational applications, pages 147–157, 2021.
- L. Benedetto, A. Cappelli, R. Turrin, and P. Cremonesi. Introducing a framework to assess newly created questions with natural language processing. In International conference on artificial intelligence in education, pages 43–54. Springer, 2020.
- L. Benedetto, A. Cappelli, R. Turrin, and P. Cremonesi. R2DE: a nlp approach to estimating irt parameters of newly generated questions. In Proceedings of the tenth international conference on learning analytics & knowledge, pages 412–421, 2020.
- L. Benedetto, P. Cremonesi, A. Caines, P. Buttery, A. Cappelli, A. Giussani, and R. Turrin. A survey on recent approaches to question difficulty estimation from text. ACM Computing Surveys, 55(9):1–37, 2023.
- C. Burges, T. Shaked, E. Renshaw, A. Lazier, M. Deeds, N. Hamilton, and G. Hullender. Learning to rank using gradient descent. In Proceedings of the 22nd international conference on Machine learning, pages 89–96, 2005.
- G. Camilli. Teacher’s corner: origin of the scaling constant d= 1.7 in item response theory. Journal of educational and behavioral statistics, 19(3):293–295, 1994.
- T. Chen, S. Kornblith, M. Norouzi, and G. Hinton. A simple framework for contrastive learning of visual representations. In International conference on machine learning, pages 1597–1607. PMLR, 2020.
- J. Devlin, M.-W. Chang, K. Lee, and K. Toutanova. Bert: Pre-training of deep bidirectional transformers for language understanding. In Proceedings of the 2019 conference of the North American chapter of the association for computational linguistics: human language technologies, volume 1 (long and short papers), pages 4171–4186, 2019.
- T. Gao, X. Yao, and D. Chen. SimCSE: Simple contrastive learning of sentence embeddings. In M.-F. Moens, X. Huang, L. Specia, and S. W.-t. Yih, editors, Proceedings of the 2021 Conference on Empirical Methods in Natural Language Processing, pages 6894–6910, Online and Punta Cana, Dominican Republic, Nov. 2021. Association for Computational Linguistics.
- R. K. Hambleton, H. Swaminathan, and H. J. Rogers. Fundamentals of item response theory, volume 2. Sage, 1991.
- J. P. Lalor, H. Wu, and H. Yu. Learning latent parameters without human response patterns: Item response theory with artificial crowds. In Proceedings of the 2019 Conference on Empirical Methods in Natural Language Processing and the 9th International Joint Conference on Natural Language Processing, pages 4249–4259, 2019.
- J. Lee, F. Chen, S. Dua, D. Cer, M. Shanbhogue, I. Naim, G. H. Ábrego, Z. Li, K. Chen, H. S. Vera, et al. Gemini embedding: Generalizable embeddings from gemini. arXiv preprint arXiv:2503.07891, 2025.
- W. Lee, J. Chun, Y. Lee, K. Park, and S. Park. Contrastive learning for knowledge tracing. In Proceedings of the ACM web conference 2022, pages 2330–2338, 2022.
- F. M. Lord. Applications of Item Response Theory to Practical Testing Problems. Lawrence Erlbaum Associates, 1980.
- F. M. Lord and M. R. Novick. Statistical Theories of Mental Test Scores. Addison-Wesley, Reading, MA, 1968.
- I. Loshchilov and F. Hutter. Decoupled weight decay regularization. In International Conference on Learning Representations (ICLR), pages 1–18, 2019. Published as a conference paper at ICLR 2019.
- V. Nair and G. E. Hinton. Rectified linear units improve restricted boltzmann machines. In Proceedings of the 27th international conference on machine learning (ICML-10), pages 807–814, 2010.
- A. v. d. Oord, Y. Li, and O. Vinyals. Representation learning with contrastive predictive coding. arXiv preprint arXiv:1807.03748, 2018.
- Z. Papamitsiou and A. A. Economides. Learning analytics and educational data mining in practice: A systematic literature review of empirical evidence. Journal of Educational Technology & Society, 17(4):49–64, 2014.
- B. Poole, S. Ozair, A. Van Den Oord, A. Alemi, and G. Tucker. On variational bounds of mutual information. In International conference on machine learning, pages 5171–5180. PMLR, 2019.
- J. C. Principe, D. Xu, and J. W. Fisher, III. Information-theoretic learning. In S. Haykin, editor, Unsupervised Adaptive Filtering, Volume I: Blind Source Separation, pages 265–319. John Wiley & Sons, New York, NY, 2000.
- A. Radford, J. W. Kim, C. Hallacy, A. Ramesh, G. Goh, S. Agarwal, G. Sastry, A. Askell, P. Mishkin, J. Clark, et al. Learning transferable visual models from natural language supervision. In International conference on machine learning, pages 8748–8763. PMLR, 2021.
- A. Radford, K. Narasimhan, T. Salimans, and I. Sutskever. Improving language understanding by generative pre-training. 2018. OpenAI Technical Report.
- G. Rasch. Probabilistic Models for Some Intelligence and Attainment Tests. Studies in mathematical psychology. University of Chicago Press, 1980.
- S. Rendle, C. Freudenthaler, Z. Gantner, and L. Schmidt-Thieme. BPR: Bayesian personalized ranking from implicit feedback. In Proceedings of the Twenty-Fifth Conference on Uncertainty in Artificial Intelligence, UAI ’09, page 452–461, Arlington, Virginia, USA, 2009. AUAI Press.
- G. Salton, A. Wong, and C.-S. Yang. A vector space model for automatic indexing. Communications of the ACM, 18(11):613–620, 1975.
- H. Zhang, Z. Liu, C. Shang, D. Li, and Y. Jiang. A question-centric multi-experts contrastive learning framework for improving the accuracy and interpretability of deep sequential knowledge tracing models. ACM Transactions on Knowledge Discovery from Data, 19(2):1–25, 2025.
© 2026 Copyright is held by the author(s). This work is distributed under the Creative Commons Attribution-NonCommercial-NoDerivatives 4.0 International (CC BY-NC-ND 4.0) license.