ABSTRACT
This study examined how self-regulated learning (SRL) processes differed between high- (n = 54) and low-performing (n = 57) writers during a 30-minute learning task. Adapting Fan et al.’s (2022) trace-based SRL protocol, we mapped 124,398 web log events onto eight SRL processes and further distinguished progress monitoring (timer/checklist checking) from comprehension monitoring (self-generated questioning). Group differences were tested using Mann–Whitney U tests with Benjamini–Hochberg correction across 5-minute windows, and monitoring–control coupling was examined through first-order Markov transitions. The groups did not differ in overall metacognitive frequency, but the low-performing group showed higher metacognitive activity at 20–25 min, mainly driven by comprehension-monitoring events that fed into quiz-response loops rather than strategic adaptation. In contrast, the high-performing group transitioned from Elaboration to Organisation earlier in the task. Although effect sizes were small to small-to-medium and several findings were marginal after correction, the results suggest that the effectiveness of monitoring–control coupling, rather than monitoring frequency alone, may distinguish writing performers.
Keywords
INTRODUCTION
Self-regulated learning (SRL) is a dynamic process in which learners actively set goals, select strategies, and monitor their progress toward desired outcomes [14, 15]. In technology-enhanced learning environments, SRL processes can be traced through timestamped log data that record learner interactions [2, 13]. Recent advances have enabled researchers to detect theoretically meaningful SRL processes from trace data using process mining techniques [4, 11].
A central yet under-investigated question is how the temporal deployment of metacognitive processes relates to learning outcomes. Prior studies have shown that self-regulated learners outperform less-regulated peers [1] , but most analyses treat metacognition as a unitary construct, without distinguishing between functionally different types of monitoring. This is problematic because monitoring frequency alone may not indicate effective self-regulation; what matters is whether monitoring triggers appropriate control actions [9, 14]. We restrict our scope to this monitoring–control coupling question in a single writing task, and do not make broader claims about motivational orientations such as mastery- versus performance-approach goals.
We address this gap by (a) adapting Fan et al.’s (2022) trace-based SRL measurement protocol, grounded in Bannert’s (2007) framework, to a writing task context; (b) extending their process library by distinguishing progress monitoring from comprehension monitoring; and (c) examining monitoring–control coupling between groups using Markov transition analysis. Three research questions guide this study:
RQ1. How do cognitive and metacognitive SRL processes differ in temporal deployment between high and low writing performers?
RQ2. Does the temporal concentration of Organisation and Elaboration processes differ between groups across 5-minute time windows?
RQ3. Do progress monitoring and comprehension monitoring differ between groups in temporal distribution and downstream transitions?
METHOD
Participants and Task
111 sixth-grade elementary-school students (age 11) participated in a 30-minute web-based learning task that involved planning, video watching with embedded questions, and essay writing. Participants were recruited through promotional postings in nationwide online parent communities, and parental consent was obtained before any data were collected. Based on writing quality ratings, participants were classified into a high-performing group (n = 54) and a low-performing group (n = 57). A total of 124,398 timestamped events across 11 activity types were recorded. The study was reviewed and approved by the institutional review board of the Seoul National University (IRB No. 2507/001-014); both parental written informed consent and child assent were obtained prior to data collection, and log data were de-identified before analysis.
SRL Process Coding
We adapted the trace-based measurement protocol of Fan et al. (2022), which operationalises Bannert's (2007) theoretical framework of metacognition and cognition in hypermedia learning. The protocol maps raw trace data to learning actions (action library) and then to SRL processes (process library) through theoretically grounded sequence rules. Because the platform actions logged in our writing environment differ from the multi-channel hypermedia actions in Fan et al.'s original study, we re-constructed the action library to fit our 11 platform-logged actions and then mapped each action to the closest SRL process in Bannert's (2007) taxonomy; where the process requires temporal ordering, the mapping was applied to a two-step action sequence rather than to a single action. The resulting process library (Table 1) maps the 11 actions to eight SRL processes: five metacognitive (Orientation, Planning, Progress Monitoring, Comprehension Monitoring, Evaluation) and three cognitive (First-reading, Elaboration, Organisation). All mapping decisions were independently reviewed by the authors against Bannert's (2007) definitions before the process counts were computed.
Building on Fan et al.’s trace-based SRL framework, we retained Monitoring (MC.M) as a higher-order category but differentiated it into two theoretically meaningful subtypes. This refinement was based on the referent of monitoring rather than on surface action types alone. Progress Monitoring (MC.M_prog), comprising CHECK_TIMER, USE_CHECKLIST, and VIDEO → CHECKLIST, reflects learners’ monitoring of task progress, time, and procedural requirements, which is consistent with Zimmerman’s (2000) account of self-monitoring during performance. In contrast, Comprehension Monitoring (MC.M_comp), comprising QUESTION_VIDEO, captures learners’ voluntary generation of questions about video content and can be interpreted as monitoring one’s internal understanding. This interpretation aligns with reading and metacomprehension research, where self-questioning is viewed as an indicator of recognizing uncertainty or a comprehension gap [6, 10].
While Fan et al. (2022) treated monitoring-related traces as a single category, distinguishing MC.M_prog from MC.M_comp allows us to examine whether monitoring has different regulatory value depending on what learners monitor: task progress or internal understanding. This distinction is further grounded in Nelson and Narens’s (1990) monitoring-control framework and the COPES model [5], which suggest that monitoring contributes to regulation when the information being monitored informs subsequent adaptive control.
Statistical Approach
Following Fan et al. (2022), who noted that SRL process distributions are typically non-normal and zero-inflated, all group comparisons used Mann–Whitney U tests. We retain this rank-based test as our primary inferential procedure for two reasons. First, the U statistic compares the full rank ordering of observations and tests stochastic dominance, not equality of medians; it therefore remains a valid group comparison even in cells where both group medians coincide at zero, since the rank-level difference between zero and non-zero observations is preserved in U. Second, the rank-biserial r derived from U (r = 1 – 2U / n₁n₂) [8] is a standardised effect size that does not depend on the centre or scale of the distribution and is therefore directly interpretable for zero-inflated counts; |r| ≥ .20 is treated as a small-to-medium effect, and Cohen's d is reported alongside r for interpretive reference. Across all 5- and 10-minute-window comparisons within each research question we applied a Benjamini–Hochberg false-discovery-rate correction (q = .05)[3], and both raw and corrected p values are reported; marginal effects (.05 < p < .10) are treated as exploratory and emphasised through effect sizes rather than p values. For temporal analysis, SRL process ratios were computed per 5-minute window, and first-order Markov transition probabilities were computed to examine monitoring–control coupling, providing an event-conditional view that is by construction free of the zero-inflation issue.
RESULTS
RQ1: Temporal Deployment of SRL Processes
Table 2 presents median SRL process durations across 10-minute windows. In the first 10 minutes, both groups primarily engaged in Planning and Elaboration, with the high group showing marginally greater Elaboration (Mdn: 247 vs. 183 s, U = 1868, p = .052, r = –.21). The critical divergence emerged at 10–20 min: the high group showed significantly greater Organisation (Mdn: 246 vs. 173 s, U = 1953, p = .015, r = –.27). In the 20–30 min window, the low group showed significantly greater Elaboration (U = 1227, p = .006, r = +.20) and marginally greater Progress Monitoring (Mdn: 13 vs. 5 s, U = 1260, p = .099, r = +.18), the latter likely reflecting anxiety-driven time checking when behind schedule.
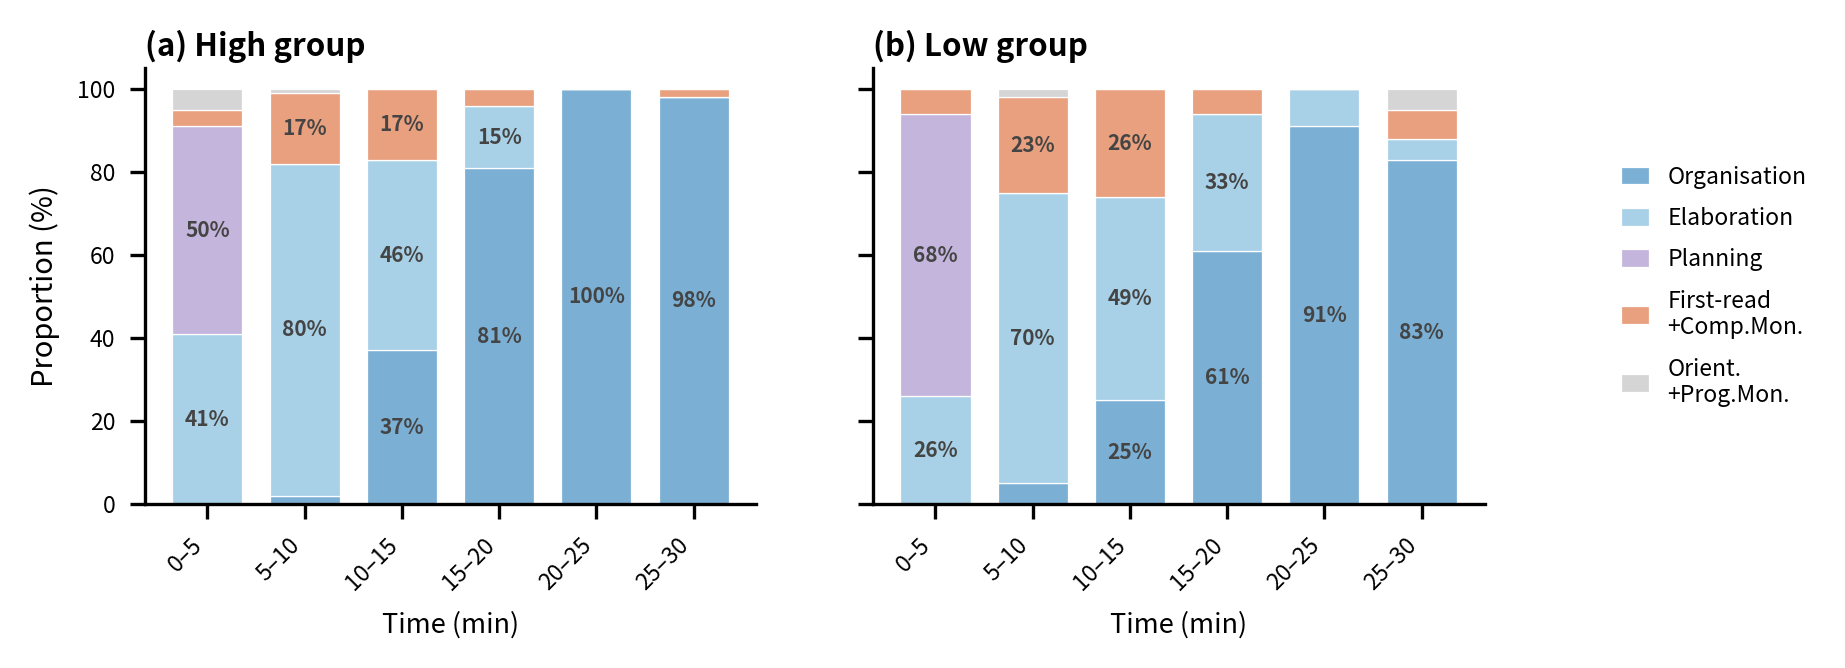
Figure 1 shows dominant SRL process proportions across 5-minute windows. By 15–20 min, 81% of high performers had Organisation as their dominant process versus 61% of low performers, who maintained Elaboration longer (33% vs. 15% at 15–20 min).
SRL Process | Learning Actions | Definition |
|---|---|---|
MC.O Orientation | READ_INSTRUCTION NAV to INSTRUCTION | Orientation on task requirements and learning goals [2, 4]. |
MC.P Planning | PLAN_* ; NAV to PLAN | Planning by arranging activities and determining strategies[4]. |
MC.M_prog | CHECK_TIMER; USE_CHECKLIST; | Monitoring progress against time and task requirements. Progress monitoring of task completion and time management [15]. |
MC.M_comp* | QUESTION_VIDEO | Self-generated questioning indicating comprehension gap recognition. Monitoring without effective control when followed by repeated loops [6, 10, 14]. |
MC.E Evaluation | ANSWER_QUIZ | External evaluation of content understanding via platform-provided comprehension checks. |
LC.F First-reading | WATCH_VIDEO | Initial information acquisition from instructional video. |
HC.E Elaboration | USE_MEMO; VIDEO → MEMO | Connecting and recording content; note-taking during video as elaboration [7]. |
HC.O Organisation | WRITE_ESSAY; MEMO → ESSAY | Text production integrating learned information into coherent essay structure [4]. |
SRL Process | 0–10 min | 10–20 min | 20–30 min | |||||||||
|---|---|---|---|---|---|---|---|---|---|---|---|---|
H | L | U | r | H | L | U | r | H | L | U | r | |
MC.O | 11.3 | 17.9 | 1220 | +0.21 | 0.0 | 0.0 | 1598 | -0.04 | 0.0 | 0.0 | 1570 | -0.02 |
MC.P | 87.5 | 102.8 | 1336 | +0.13 | 0.0 | 0.0 | 1543 | 0.00 | 0.0 | 0.0 | 1568 | -0.02 |
MC.M_prog | 34.2 | 33.2 | 1431 | +0.07 | 11.3 | 20.0 | 1340 | +0.13 | 5.1 | 13.1 | 1260 | +0.18 |
MC.M_comp | 0.0 | 0.0 | 1530 | +0.01 | 0.0 | 0.0 | 1423 | +0.08 | 0.0 | 0.0 | 1456 | +0.05 |
MC.E | 10.6 | 0.0 | 1710 | -0.11 | 12.4 | 22.7 | 1321 | +0.14 | 0.0 | 0.0 | 1299 | +0.16 |
LC.F | 80.1 | 94.3 | 1384 | +0.10 | 39.9 | 45.6 | 1450 | +0.06 | 0.0 | 0.0 | 1711 | -0.11 |
HC.E | 247.1 | 183.4 | 1868 | -0.21 | 114.4 | 158.6 | 1459 | +0.05 | 0.0 | 0.0 | 1227 | +0.20 |
HC.O | 0.0 | 0.0 | 1542 | 0.00 | 245.7 | 172.5 | 1953 | -0.27 | 441.2 | 329.6 | 1860 | -0.21 |
Note. Cells in which both groups display Mdn = 0.0 arise from zero-inflation, driven by the phase-structured task design (e.g., Planning concentrates in the opening minutes and Organisation in the closing minutes), by the voluntary low-base-rate nature of comprehension monitoring (QUESTION_VIDEO; see §4.2), and by two-step sequence rules in the process library that further restrict the non-zero rate. Mann–Whitney U is rank-based and remains valid in such cells: U and r summarise the rank-level difference between groups (driven by the proportion of non-zero observations) rather than the tied central tendency.
RQ2: Temporal Concentration
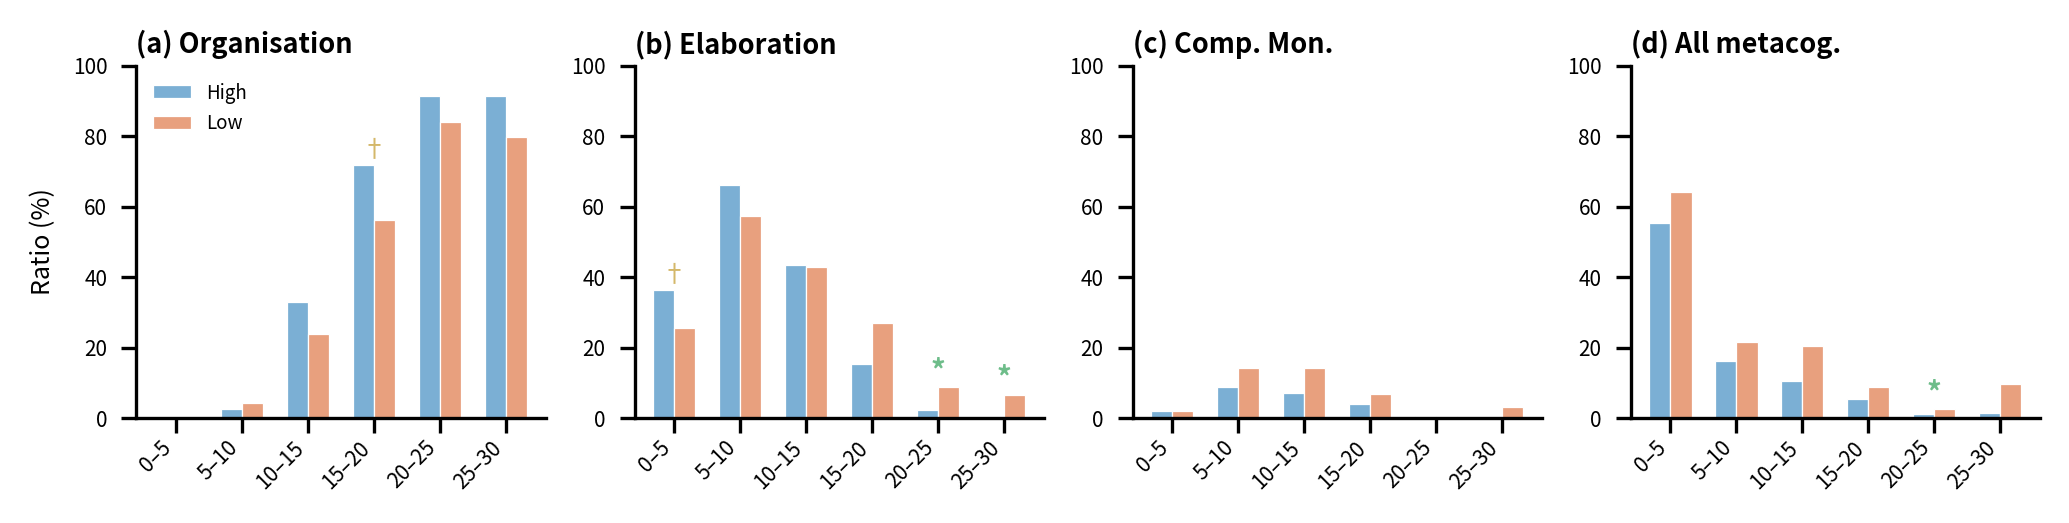
Organisation concentration (Figure 2a) showed a marginally significant difference at 15–20 min (U = 1868, p = .052, r = –.21). Elaboration (Figure 2b) showed a crossover: the high group had marginally higher Elaboration at 0–5 min (U = 1825, p = .085, r = –.19) but significantly lower Elaboration at 20–25 min (U = 1127, p = .015, r = +.18) and 25–30 min (U = 720, p = .014, r = +.14), indicating earlier completion of the Elaboration-to-Organisation phase transition.
RQ3: Monitoring and Control Coupling
Total metacognition ratio (Figure 2d) was significantly higher for the low group at 20–25 min (U = 1015, p = .020, r = +.26). Comprehension Monitoring (Figure 2c) showed elevated trends for the low group, particularly at 10–15 min (Mdn: 0% for both groups, but the low group’s distribution had a substantially heavier right tail). Progress Monitoring was marginally higher for the low group at 20–25 min (U = 1086, p = .061, r = +.21).
Post-monitoring transition analysis (Figure 3) revealed differential monitoring–control coupling. After Progress Monitoring, both groups transitioned primarily to Organisation and Navigation, with similar patterns. However, after Comprehension Monitoring, the low group transitioned to Evaluation (quiz loop) at a higher rate (35.5% vs. 27.3%), while the high group showed higher Navigation probability (24.2% vs. 15.1%), suggesting strategic disengagement from unproductive comprehension checking.
The transition WRITE_PLAN → NAVIGATE was significantly more frequent in the low group (Mdn: 1 vs. 0, U = 1155, p = .010, r = +.25), suggesting greater post-planning disorientation. Conversely, WRITE_ESSAY → NAVIGATE was significantly more frequent in the high group (U = 1869, p = .037, r = –.21), reflecting more active navigation during writing.

DISCUSSION
Applying a trace-based SRL measurement protocol adapted from Fan et al. (2022) to web log data from a single writing task, this study finds that, within the bounds of this task, writing performance differences are associated with the functional effectiveness of metacognitive processes rather than with their raw frequency.
Monitoring without effective control. Our most theoretically significant finding is the differential monitoring–control coupling between groups. The low group engaged in more Comprehension Monitoring (self-questioning during video), yet this monitoring disproportionately led to Evaluation (quiz-answering) rather than strategic redirection. This exemplifies what Winne and Hadwin (1998) describe as a breakdown in the monitoring–control loop: learners detect a comprehension gap but respond passively rather than adapting strategy [14]. That the total metacognition ratio was significantly higher for the low group at 20–25 min (p = .020) directly challenges the common assumption that more metacognition implies better self-regulation.
The Elaboration-to-Organisation phase transition. The Elaboration crossover pattern, in which Elaboration is higher early and lower late for the high group, demonstrates a phase transition aligned with Kellogg's (1996) writing model [7]. The high group completes this transition earlier not because they elaborate less overall but because their early elaboration is more intensive, enabling a faster transition to text production.
Progress Monitoring as a lagging indicator. The marginally higher Progress Monitoring in the low group at 20–25 min likely represents reactive time checking when behind schedule, rather than proactive self-regulation. This cautions against equating monitoring frequency with quality, consistent with Schraw’s (1998) distinction between monitoring accuracy and frequency [12].
Methodological Contributions
This study extends the trace-based SRL measurement protocol of Fan et al. (2022) in two ways [4]. First, our decomposition of Monitoring into productive and comprehension subtypes reveals functionally distinct processes with opposing relationships to performance, a distinction invisible when Monitoring is treated as a unitary category. Second, the post-monitoring transition analysis operationalises the monitoring–control coupling concept from Winne and Hadwin's (1998) COPES model in a data-driven manner, providing an empirical method for assessing whether monitoring leads to effective strategy adaptation [14].
Limitations
Several limitations qualify these findings. First, causal direction cannot be established from cross-sectional trace data; the observed Elaboration-to-Organisation timing differences may function either as antecedents or consequences of writing quality. Second, WRITE_ESSAY frequency is partly confounded with text quantity, creating potential circularity with the quality-based grouping. Future work should use independent baseline writing measures and consider sequence balancing to reduce the influence of overall activity volume on SRL process counts. Third, several SRL-process duration variables were zero-inflated, partly due to the phase-structured task design, the low-base-rate nature of QUESTION_VIDEO, and the restrictive two-step sequence rules. Although the Mann–Whitney U test can capture rank-level group differences under these conditions, medians are less informative when many observations are zero. Future studies could use hurdle or zero-inflated models to distinguish the presence of a process from its duration conditional on occurrence. Fourth, some effects were marginal and small to small-to-medium in size; even with Benjamini–Hochberg correction, the findings should be interpreted as preliminary and require replication with larger samples. Fifth, the process library relied only on single-action and two-step sequence detection. As Fan et al. (2022) showed, richer multi-channel data such as eye-tracking or think-aloud protocols can improve SRL-process detection granularity, and our mapping may under-capture higher-order regulatory episodes. Finally, because the data came from a single writing task and learner population, cross-task and cross-domain validation is needed before the proposed monitoring decomposition can be treated as a general SRL measurement contribution.
ACKNOWLEDGMENTS
This study was supported by the research grant (0767-20250004) from Learning Sciences Research Institute at Seoul National University.
REFERENCES
- Bannert, M. and Reimann, P. 2012. Supporting self-regulated hypermedia learning through prompts. Instructional Science. 40, 1 (Jan. 2012), 193–211. https://doi.org/10.1007/s11251-011-9167-4.
- Bannert, M., Reimann, P. and Sonnenberg, C. 2014. Process mining techniques for analysing patterns and strategies in students’ self-regulated learning. Metacognition and Learning. 9, 2 (Aug. 2014), 161–185. https://doi.org/10.1007/s11409-013-9107-6.
- Benjamini, Y. and Hochberg, Y. 1995. Controlling the False Discovery Rate: A Practical and Powerful Approach to Multiple Testing. Journal of the Royal Statistical Society: Series B (Methodological). 57, 1 (Jan. 1995), 289–300. https://doi.org/10.1111/j.2517-6161.1995.tb02031.x.
- Fan, Y., Lim, L., van der Graaf, J., Kilgour, J., Raković, M., Moore, J., Molenaar, I., Bannert, M. and Gašević, D. 2022. Improving the measurement of self-regulated learning using multi-channel data. Metacognition and Learning. 17, 3 (Dec. 2022), 1025–1055. https://doi.org/10.1007/s11409-022-09304-z.
- Greene, J.A. and Azevedo, R. 2007. A Theoretical Review of Winne and Hadwin’s Model of Self-Regulated Learning: New Perspectives and Directions. Review of Educational Research. 77, 3 (Sept. 2007), 334–372. https://doi.org/10.3102/003465430303953.
- Joseph, L.M., Alber-Morgan, S., Cullen, J. and Rouse, C. 2016. The Effects of Self-Questioning on Reading Comprehension: A Literature Review. Reading & Writing Quarterly. 32, 2 (Mar. 2016), 152–173. https://doi.org/10.1080/10573569.2014.891449.
- Kellogg, R.T. 1996. A model of working memory in writing. The Science of Writing. Routledge.
- Kerby, D.S. 2014. The Simple Difference Formula: An Approach to Teaching Nonparametric Correlation. Comprehensive Psychology. 3, (Jan. 2014), 11.IT.3.1. https://doi.org/10.2466/11.IT.3.1.
- Nelson, T.O. and Narens, L. 1994. Why investigate metacognition? Metacognition: Knowing about knowing. 1–25.
- Ozuru, Y., Kurby, C.A. and McNamara, D.S. 2012. The effect of metacomprehension judgment task on comprehension monitoring and metacognitive accuracy. Metacognition and Learning. 7, 2 (Aug. 2012), 113–131. https://doi.org/10.1007/s11409-012-9087-y.
- Saint, J., Whitelock-Wainwright, A., Gašević, D. and Pardo, A. 2020. Trace-SRL: A Framework for Analysis of Microlevel Processes of Self-Regulated Learning From Trace Data. IEEE Transactions on Learning Technologies. 13, 4 (Oct. 2020), 861–877. https://doi.org/10.1109/TLT.2020.3027496.
- Schraw, G. 1998. Promoting general metacognitive awareness. Instructional Science. 26, 1 (Mar. 1998), 113–125. https://doi.org/10.1023/A:1003044231033.
- Siadaty, M., Gašević, D. and Hatala, M. 2016. Associations between technological scaffolding and micro-level processes of self-regulated learning: A workplace study. Computers in Human Behavior. 55, (Feb. 2016), 1007–1019. https://doi.org/10.1016/j.chb.2015.10.035.
- Winne, P.H. and Hadwin, A.F. 1998. Studying as self-regulated engagement in learning. (1998), 277–304.
- Zimmerman, B.J. 2002. Becoming a Self-Regulated Learner: An Overview. Theory Into Practice. 41, 2 (May 2002), 64–70. https://doi.org/10.1207/s15430421tip4102_2.
© 2026 Copyright is held by the author(s). This work is distributed under the Creative Commons Attribution-NonCommercial-NoDerivatives 4.0 International (CC BY-NC-ND 4.0) license.