ABSTRACT
Creating high-quality educational visualizations remains
time-consuming and difficult to personalize at scale. We
introduce Vizart, a multi-agent framework for end-to-end
text-to-visual generation in Scalable Vector Graphics (SVG)
that supports visual learning. By treating visualization as a
code-generation task in SVG, Vizart utilizes the reasoning
and coding capabilities of Multimodal Large Language
Models (MLLMs) while addressing their known limitations in
spatial reasoning and pedagogical alignment. The framework
combines retrieval-augmented in-context guidance, staged
scenario and code planning, incremental SVG generation,
rubric-based iterative refinement across specialized agents, and
user-driven refinement of generated visuals. In an initial study
of 100 prompts spanning five subject domains — biology,
physics, chemistry, mathematics, and computer science —
Vizart demonstrates promising early results in generating
clear, structured, and pedagogically aligned explanatory
visualizations. All code and products are open-source and
accessible at https://github.com/susanna-at/vizart.
Keywords
1. INTRODUCTION AND RELATED WORK
Visual learning is an effective pedagogical modality across subject areas and is widely used to support explanations of complex systems and deepen understanding of verbal and written material. Prior work in education and learning sciences has shown that visualizations can be a powerful support for learning, understanding, and long-term recall [1, 11]. Research on intelligent tutoring systems has demonstrated the value of graphic visualizations and representational competency supports for enhancing learning outcomes [7, 10]. However, while students often require visuals to address specific learning needs, designing high-quality educational visualizations can be a significant burden on educators, requiring substantial time and often specialized design skills. These findings motivate the development of systems that target visual learning and can make high-quality educational visualizations more accessible, adaptable, and personalized. The emerging capabilities of Multimodal Large Language Models (MLLMs) create opportunities to generate visualizations at a scale and level of accessibility that were previously difficult to achieve. Vizart is inspired by this opportunity. Recent efforts in computing education have explored generative AI for tutoring-style assistance, instructional support, immediate feedback, and coding/debugging support [6]. Systems such as 61A Bot, an LLM-based homework assistant for a large introductory programming course, illustrate this potential at scale [12]. However, these efforts primarily focus on dialogue-based tutoring and code-centered support, leaving generative AI for visual learning comparatively underexplored.
MLLMs have demonstrated strong capabilities in code generation, contextual understanding, dynamic debugging, and iterative optimization [3]. Many visualization formats allow visual generation to be formulated as a code generation task. One particularly useful representation is Scalable Vector Graphics (SVG), an XML-based markup language for creating high-resolution vector graphics. Treating visual generation as code generation enables us to leverage the inherent strengths of MLLMs and is especially promising for scientific and educational applications, which often require high specificity, precision, and clarity. Representing visuals as code, therefore, offers important advantages: it enables finer-grained control over the generation process and allows direct editing and refinement after the image is produced.
Prior work has explored SVG and text-to-SVG generation frameworks. StarVector [9] demonstrates that MLLMs can translate semantic understanding of visuals into SVG primitives. SVGenius, a recent benchmark for SVG understanding, editing, and generation, shows that although current models have promising SVG capabilities, they still face substantial challenges in robust SVG processing, particularly as task complexity increases [2]. Some prior work has studied SVGs as a medium for visualizing hints in mathematics problems [5]; however, frameworks for more involved pedagogical visualization tasks that generalize across subject domains remain underexplored.
Most notably, general-purpose MLLMs are primarily optimized for visual aesthetics rather than instructional clarity. Consequently, existing approaches struggle to handle complex instructional diagrams and often fail to maintain the precise spatial reasoning, semantic relationships, and geometric constraints required for accurate pedagogical representation [2]. EduVisBench and EduVisAgent further show that, although foundation models can produce step-by-step textual reasoning, they still struggle to generate pedagogically effective visual explanations that are clear, logically structured, and aligned with human cognitive processes [4]. Thus, general-purpose, single-pass generation pipelines fundamentally lack the scaffolding required for education.
To address these limitations, we introduce Vizart, a multi-level human-in-the-loop framework for end-to-end text-to-SVG generation tailored for visual learning. Vizart is centered on structured element-level generation and iterative refinement. It aims to leverage the coding abilities of foundation MLLMs while addressing their limitations in spatial reasoning, clarity, and pedagogical alignment.
2. METHODOLOGY AND PIPELINE
Vizart is a multi-agent framework for end-to-end text-to-SVG generation designed to support visual learning. We adopt SVG as the intermediate representation between the language model and the visualization. This choice is motivated by both the broad availability of SVG/XML data on the web and the demonstrated ability of MLLMs to generate and manipulate structured code. As part of Vizart, we curate a dataset of more than 5,000 SVG visualizations, equally balanced across five subject areas: biology, physics, chemistry, mathematics, and computer science. The dataset is constructed by scraping English-language SVG visualizations from Wikimedia Commons and recording their associated articles as topical context. We applied automatic quality filters such as rendering validation, followed by manual review for subject relevance. We preserve original source URLs and Wikimedia Commons license metadata for attribution. The resulting files contain a median of 86 SVG elements per visualization and are 72 KiB on average. The dataset serves as both an example source and a retrieval base for in-context generation guidance. Given a user request and optional background context, Vizart performs a text-based retrieval step over the topic-matched SVG dataset using BM25 [8] and keeps the top-\(k\) most relevant examples as references for in-context learning in the downstream generation task of the Code Planner stage.
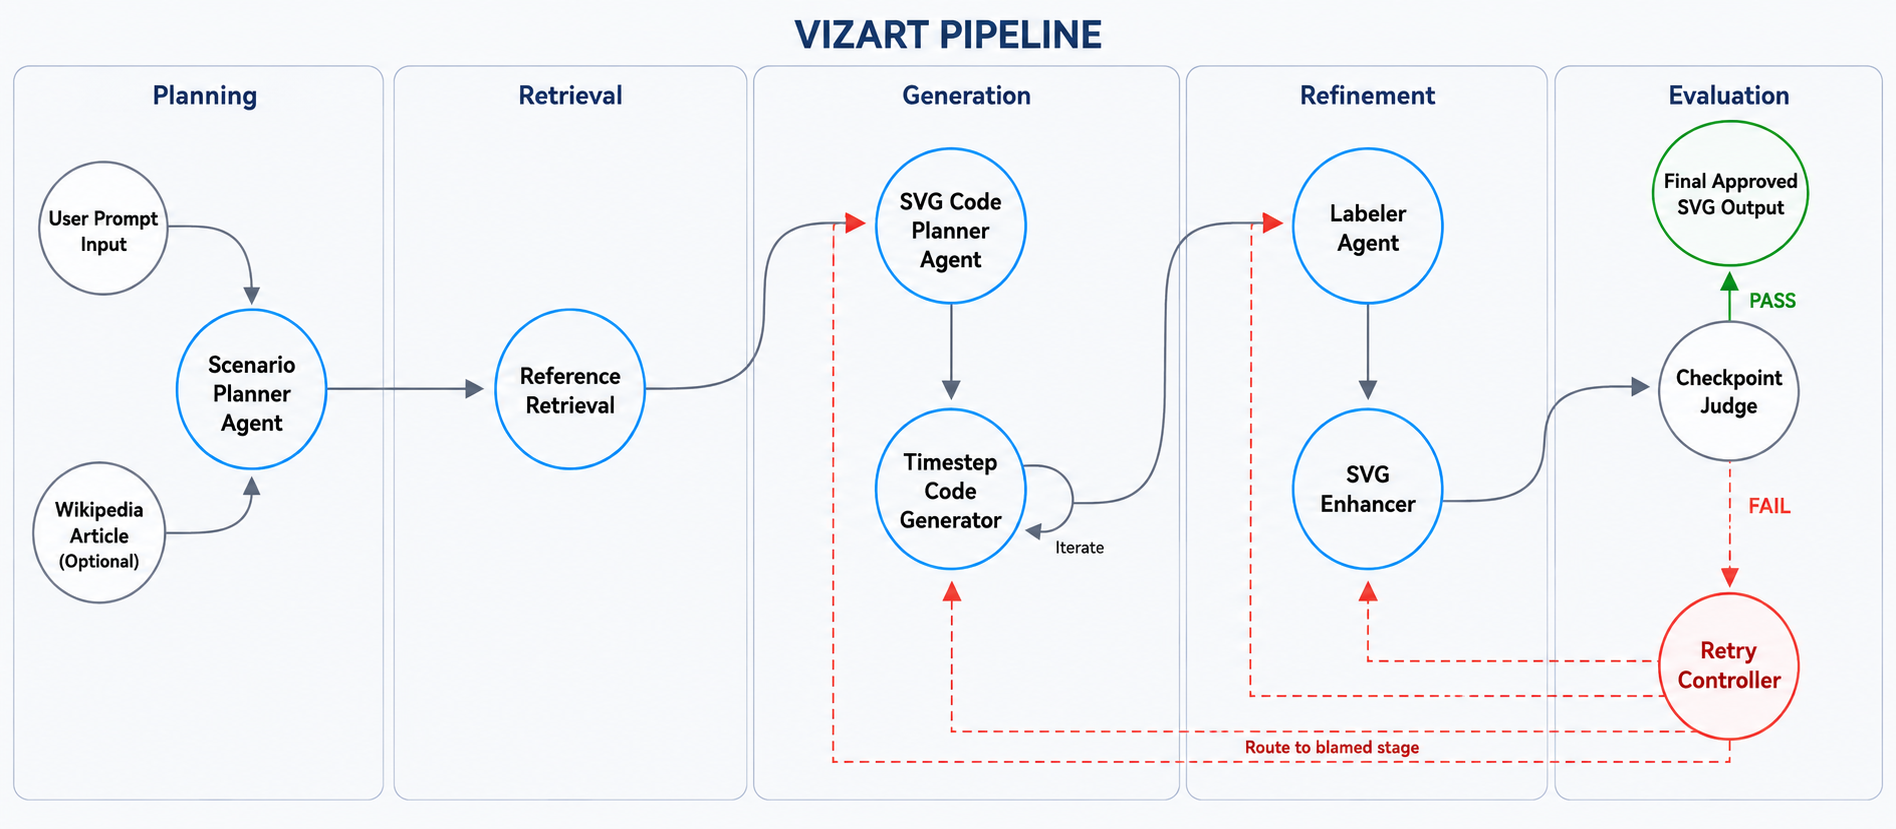
As illustrated in Figure 1, the pipeline begins with a user’s natural-language query and optional supporting context, such as a linked article, book section, or other educational resource. In our experiments, we use Wikipedia articles from the dataset metadata as an example of external context. All agents reason over a shared unit of construction called an element. An element is defined as a logical structural unit of the figure; it may consist of one or more SVG tags, but it is treated as a single visual unit during planning and generation.
The Scenario Planner interprets the request and produces a step-by-step pedagogical visualization plan. It determines how the concept should be visualized, what should be shown, in what order, and at what level of detail for the intended learner.
The Code Planner translates this high-level visual plan into an SVG implementation blueprint. It creates a guided plan with actionable coding steps for translating the scenario specification into SVG code. It specifies the approximate layout, visual structure, and the SVG/XML elements needed to realize each part of the figure.
The Timestep SVG Code Generator executes the code plan incrementally, stage-by-stage, rather than in a single pass. At each stage, it receives the current SVG state, the instructions for the next step, and the original user intent, and progressively updates the figure. This incremental approach mirrors how a human developer would construct a complex diagram — building up the visual element by element, verifying intermediate results, and adjusting as the figure takes shape.
The Labeler controls annotations. The Labeler determines which labels are necessary for the pedagogical goal, audits existing labels, and issues add, remove, or adjust operations on text tags to improve readability and instructional value.
The Enhancer performs final visual refinement. It improves spacing, alignment, and element placement, focusing on presentation quality without altering the intended concept.
The Judge evaluates the final visualization using a rubric across four dimensions: visual clarity, layout and visual organization, pedagogical utility, and fidelity to the target concept, averaging to obtain an overall score. Each dimension is scored 1–100. The Judge outputs a binary pass/no-pass decision, concise feedback, and the stage most responsible for the most prominent issue in the case of a no-pass. If figure generation fails, the pipeline can restart from the identified stage with judge feedback injected into downstream agents.
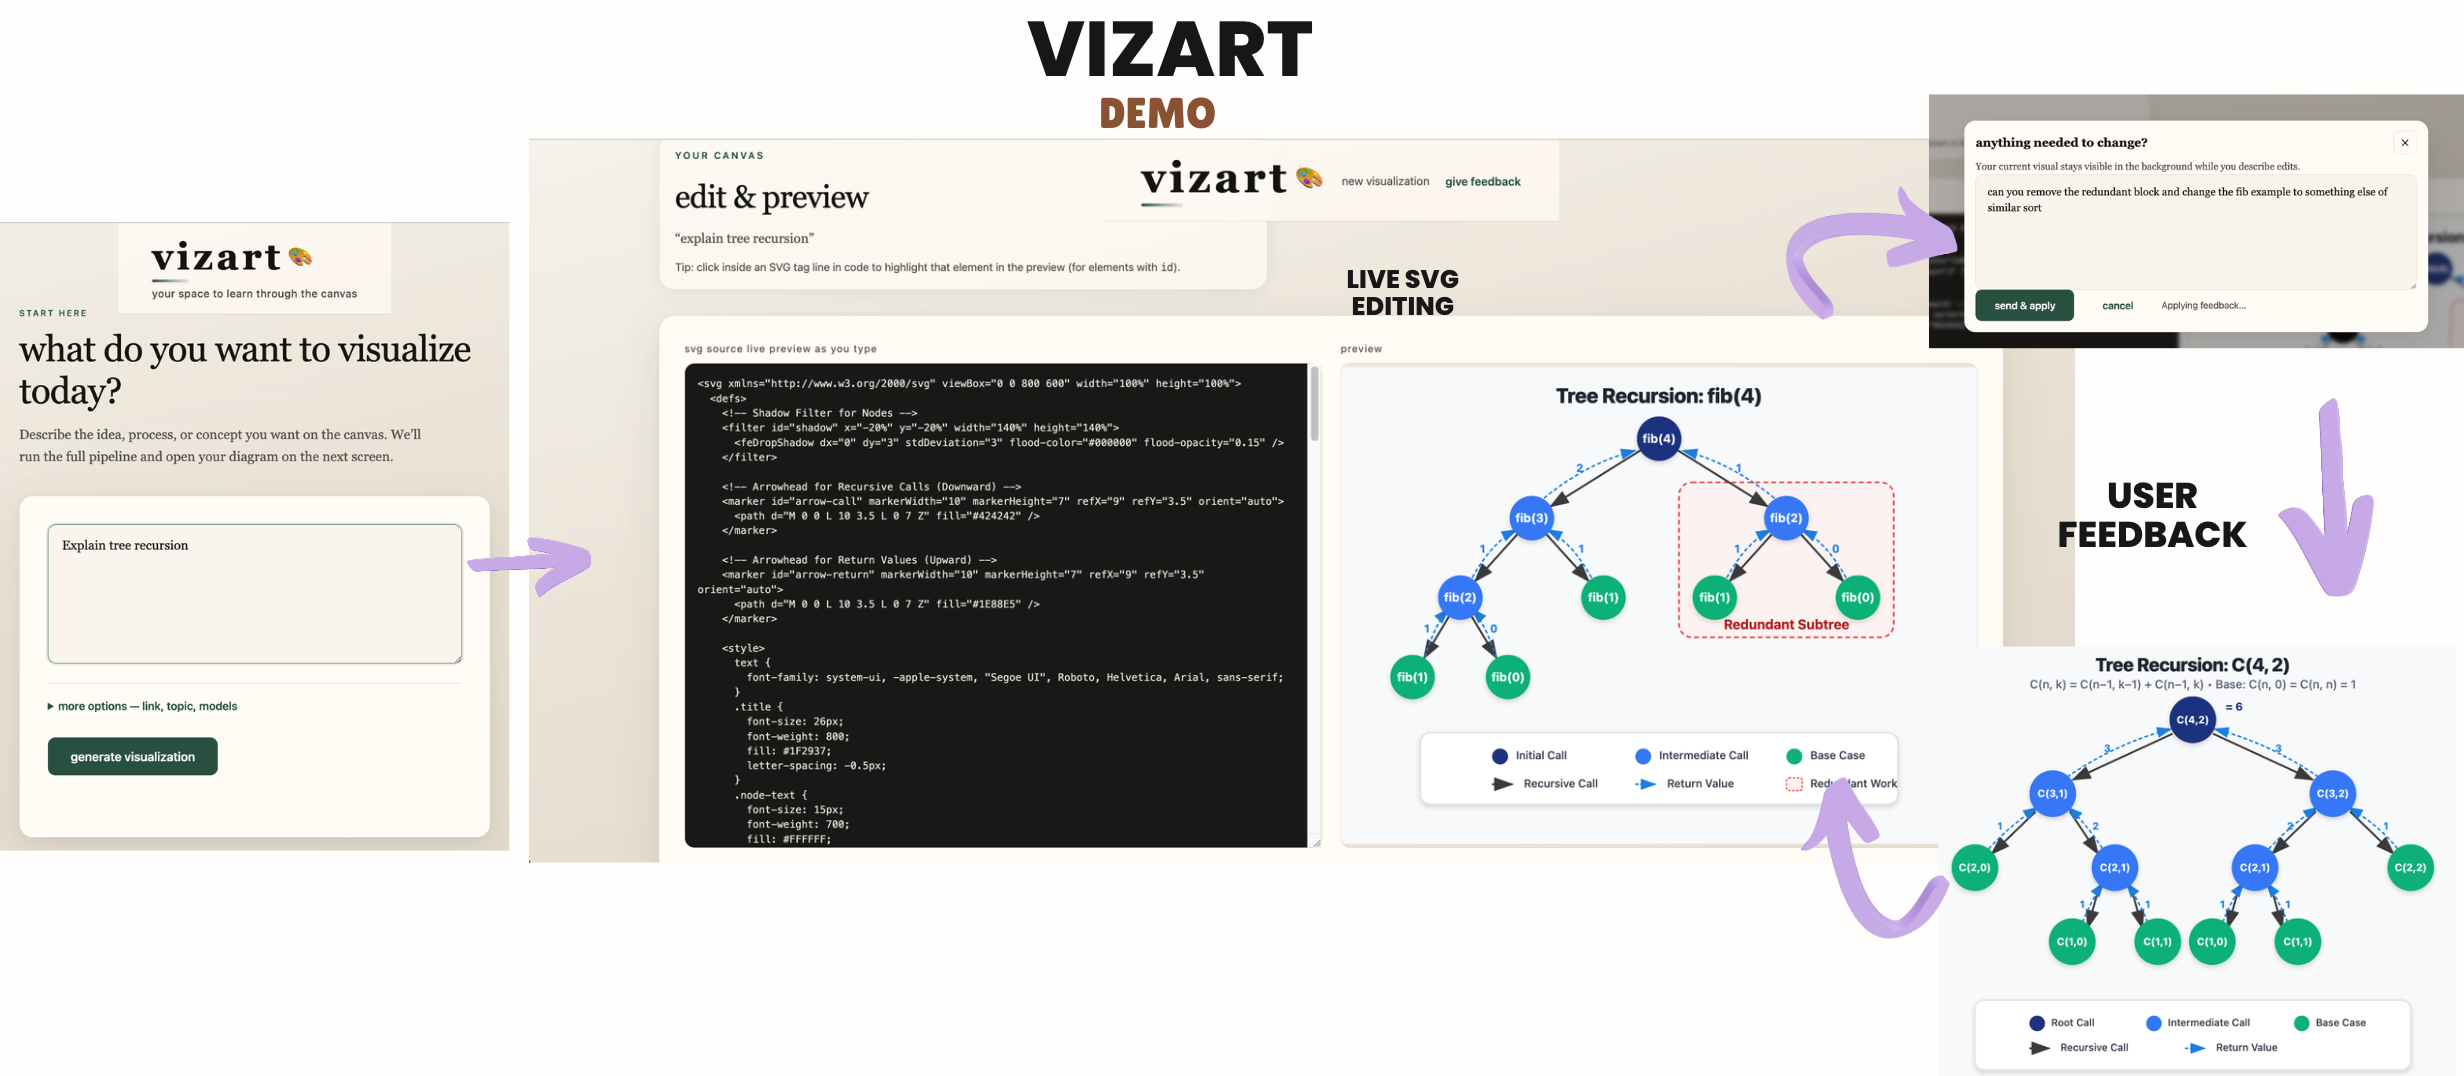
Vizart is designed as a human-in-the-loop system. Because the visualization remains in SVG form throughout generation, intermediate and final outputs are editable. This allows the system not only to regenerate from intermediate stages using judge feedback, but also to support direct refinement and control by instructors or learners. Figure 2 shows the Vizart interface. The Vizart interactive demo supports all stages of the pipeline with customizable parameters. Users can refine generated visualizations by directly editing the SVG code, manipulating visual elements through the interface, or providing natural-language feedback for regeneration. When feedback is provided, the system can route the revision back through the relevant pipeline stage while preserving the editable SVG representation.
3. RESULTS
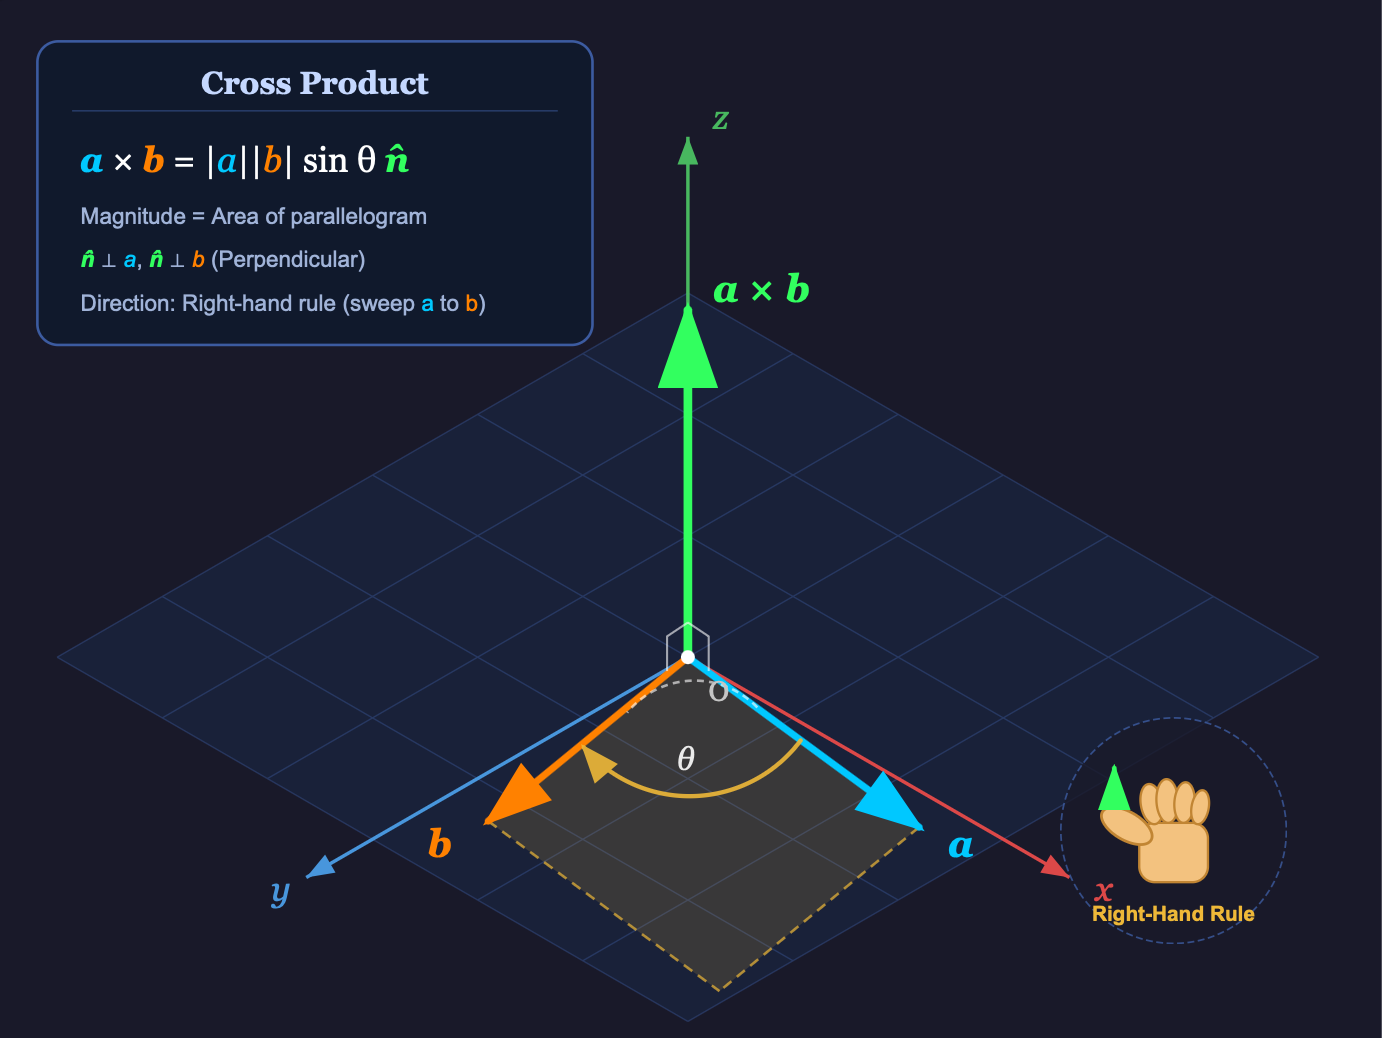
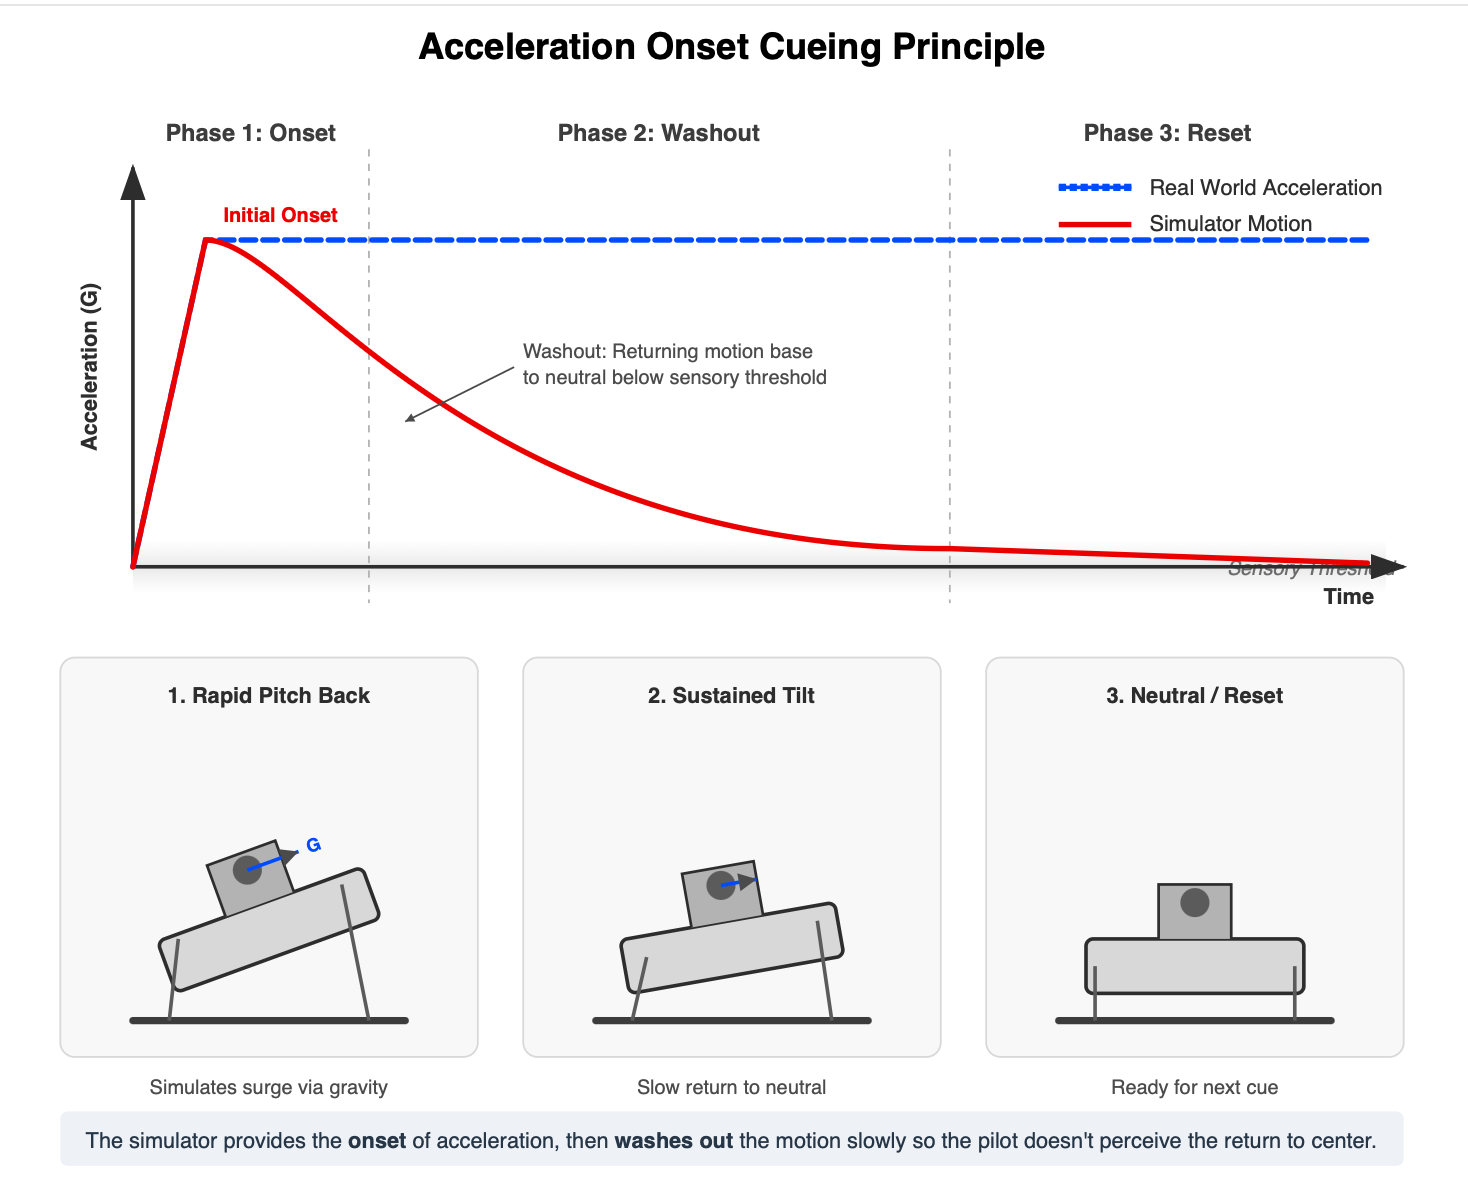
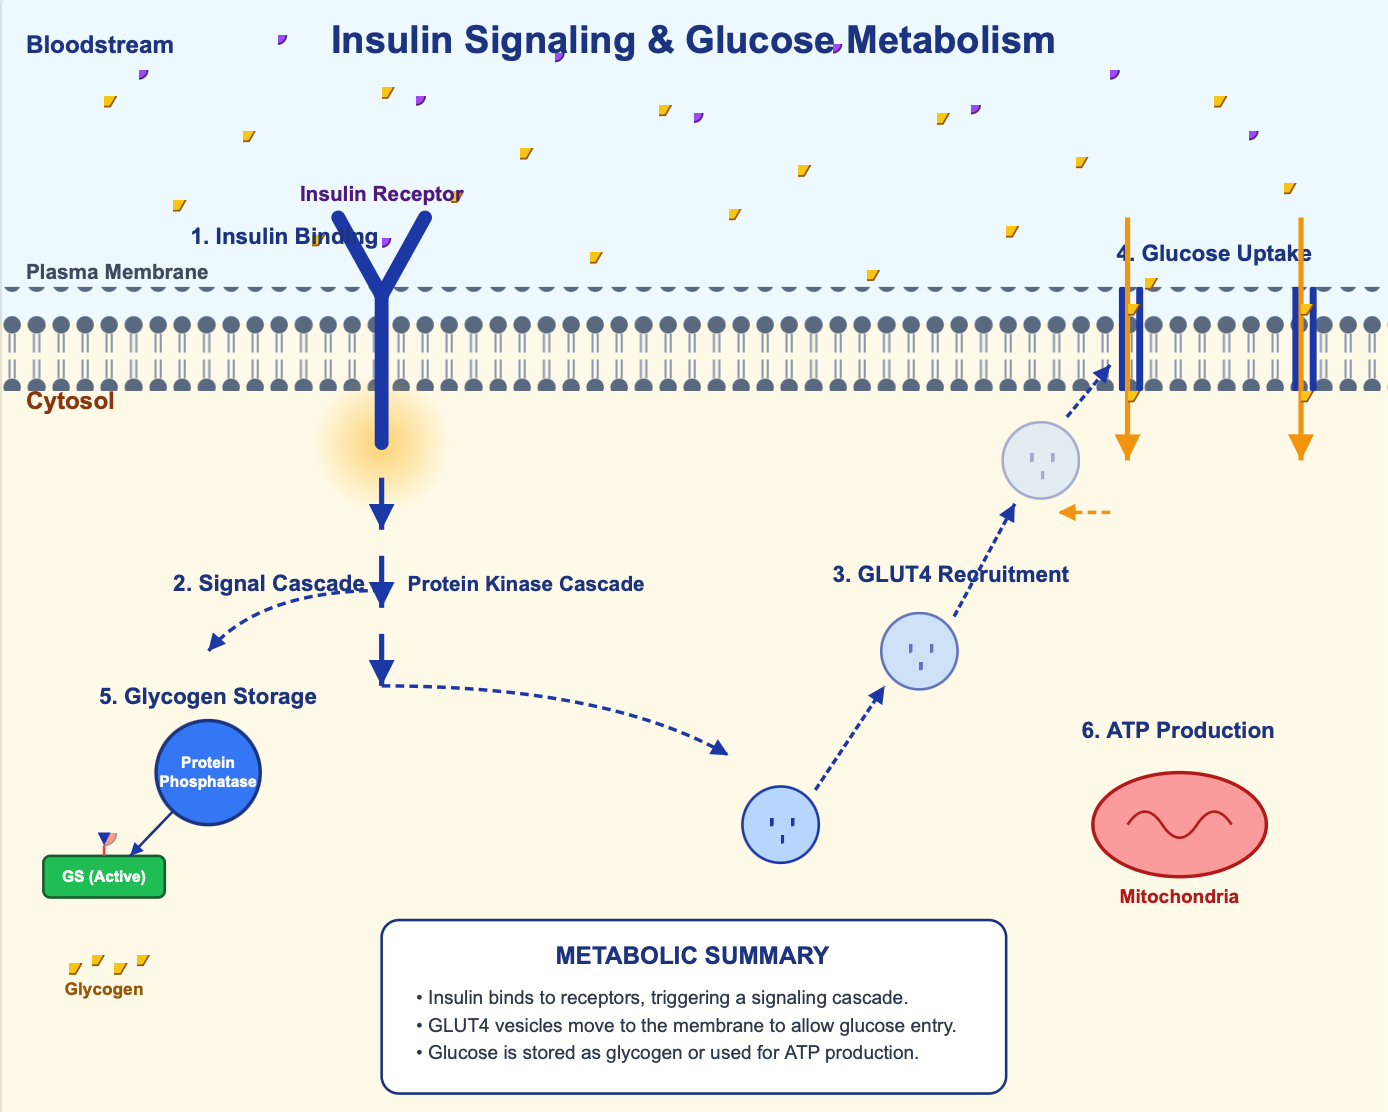
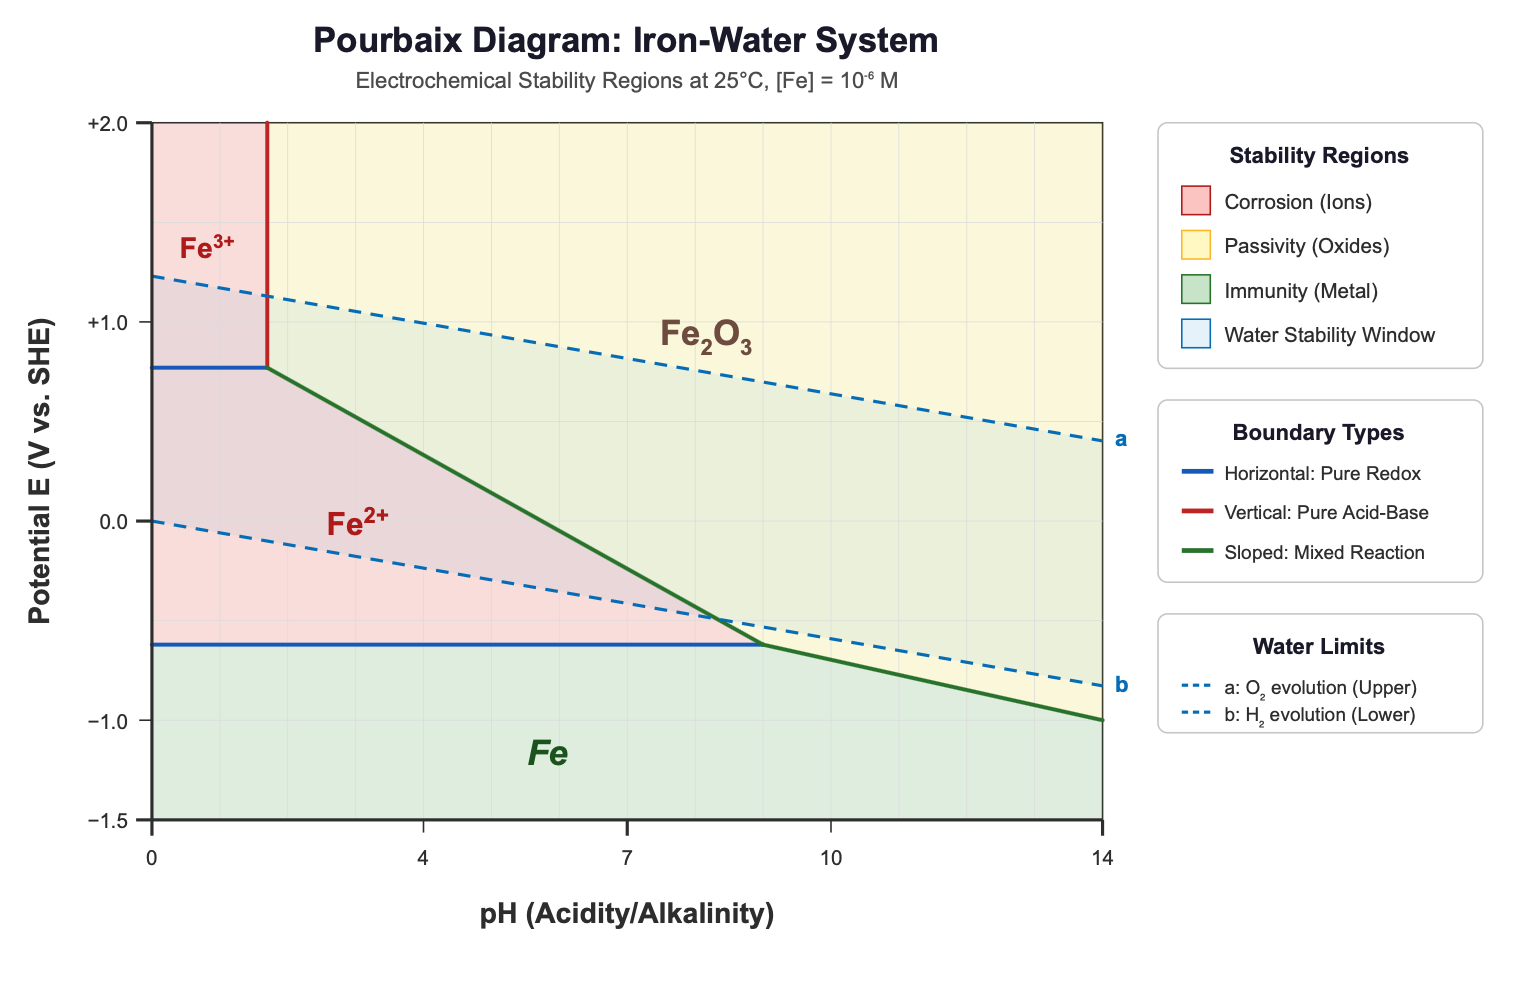
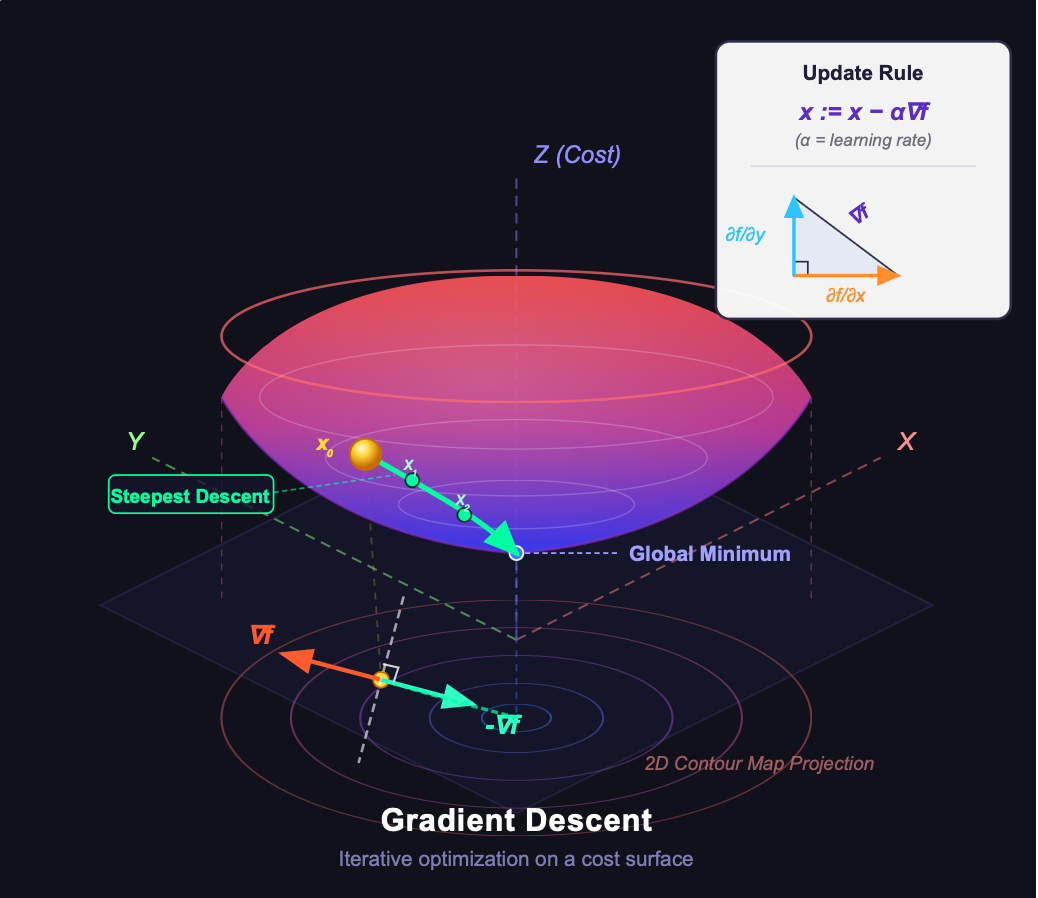
In a preliminary study, we evaluated Vizart on 100 prompts. Half of the prompts were randomly selected high-school to college-level questions distributed across the five subject categories, while the other half were prompts for which a corresponding ground-truth visualization was available in our Wikipedia-derived SVG dataset. All 100 evaluations were run in fully automated mode (no human intervention) to establish a baseline. Judge-based regeneration loops were capped at two iterations. The agent stack used a combination of Gemini-3 Flash Preview and Claude Sonnet 4-6. Gemini was used for planning and judging, while Claude was used for code-generation stages, assigned based on preliminary qualitative comparisons; the architecture is model-agnostic by design. Figures 3–7 show representative Vizart outputs across five subject domains.
The average documented judge scores across the four rubric items, alongside human annotator scores on the same rubric, are reported in Table 1. Based on the Judge’s binary pass/no-pass decision, the passing rate was 40%. The results in Table 1 show overall alignment between human critique and the LLM as a judge. Across individual criteria, it is notable that the human annotator rated the fidelity to the subject matter and pedagogical value lower than the LLM judge, motivating human-in-the-loop refinement.
| Source | Organization | Clarity | Pedagogy | Fidelity | Overall |
|---|---|---|---|---|---|
| LLM Judge | 73.3 | 71.8 | 81.2 | 88.1 | 78.6 |
| Human | 68.2 | 74.9 | 70.5 | 75.6 | 72.3 |
4. FUTURE WORK
Vizart creates an exciting foundation for future work in educational visualization. As users interact with the system, provide rubric-based feedback, iterate with the tool, or manually edit generated SVGs, these actions can serve as signals of user preferences and desirable visualization criteria. Such interaction data could support more personalized generation pipelines, including fine-tuning the Judge agent and related components to better match preferences in style, level of detail, and pedagogical presentation. Because different foundation models exhibit different stylistic tendencies, future versions of Vizart could also adapt model selection to user preferences and task type. More broadly, as larger amounts of user feedback, interaction traces, and edited outputs are collected, Vizart could support stronger human-in-the-loop optimization, including fine-tuning and reinforcement learning from human feedback.
A second direction is a larger benchmarking and evaluation framework for educational text-to-SVG generation. Such a framework could include broader baseline comparisons, additional metrics for pedagogical quality and visual correctness, and agent-level analysis of where different foundation models succeed or fail. It could also support comparison across domains, levels of contextual input, and degrees of user interaction, helping identify which components of the framework contribute most to final visualization quality.
5. CONCLUSIONS
Generating educational visualizations has long required either design expertise or significant time — often both. Vizart offers a different path: by representing visualizations as structured SVG code and orchestrating specialized agents across planning, generation, labeling, refinement, and evaluation, the system enables the production, inspection, and iteration on explanatory figures through natural language alone. Our initial study across five subject domains suggests that this structured, multi-stage approach can meaningfully address the spatial reasoning, label clutter, and pedagogical alignment failures that limit single-pass MLLM generation. The more significant contribution, however, may be architectural. By keeping the visualization in an editable, inspectable format throughout the pipeline, Vizart positions instructors and learners as active participants rather than passive recipients of generated content. The human-in-the-loop design is not a fallback for when the model fails — it is central to the system’s pedagogical philosophy.
6. REFERENCES
- E. Bobek and B. Tversky. Creating visual explanations improves learning. Cognitive Research: Principles and Implications, 1(1):27, 2016. Article 27.
- S. Chen, X. Dong, H. Xu, X. Wu, F. Tang, H. Zhang, Y. Yan, L. Wu, W. Zhang, G. Hou, Y. Shen, W. Lu, and Y. Zhuang. Svgenius: Benchmarking llms in svg understanding, editing and generation, 2025.
- Y. Dong, X. Jiang, J. Qian, T. Wang, K. Zhang, Z. Jin, and G. Li. A survey on code generation with llm-based agents, 2025.
- H. Ji, S. Qiu, S. Xin, S. Han, Z. Chen, D. Zhang, H. Wang, and H. Yao. From eduvisbench to eduvisagent: A benchmark and multi-agent framework for reasoning-driven pedagogical visualization, 2025.
- J. Lee, J. Lee, W. Feng, and A. Lan. From text to visuals: Using llms to generate math diagrams with vector graphics, 2025.
- J. Prather, J. Leinonen, N. Kiesler, J. Gorson Benario, S. Lau, S. MacNeil, N. Norouzi, S. Opel, V. Pettit, L. Porter, B. N. Reeves, J. Savelka, D. H. Smith, S. Strickroth, and D. Zingaro. Beyond the hype: A comprehensive review of current trends in generative ai research, teaching practices, and tools. In 2024 Working Group Reports on Innovation and Technology in Computer Science Education, ITiCSE 2024, pages 300–338. Association for Computing Machinery, 2025.
- J. Rho, M. A. Rau, and B. D. Van Veen. Preparing future learning with novel visuals by supporting representational competencies. In Artificial Intelligence in Education: 23rd International Conference, AIED 2022, Proceedings, Part I, pages 66–77. Springer, 2022.
- S. Robertson and H. Zaragoza. The probabilistic relevance framework: Bm25 and beyond. Foundations and Trends in Information Retrieval, 3(4):333–389, 2009.
- J. A. Rodriguez, A. Puri, S. Agarwal, I. H. Laradji, P. Rodriguez, S. Rajeswar, D. Vazquez, C. Pal, and M. Pedersoli. Starvector: Generating scalable vector graphics code from images and text, 2025.
- S. Schez-Sobrino, C. Gómez-Portes, D. Vallejo, C. Glez-Morcillo, and M. A. Redondo. An intelligent tutoring system to facilitate the learning of programming through the usage of dynamic graphic visualizations. Applied Sciences, 10(4):1518, 2020. Article 1518.
- J. Schoenherr, A. R. Strohmaier, and S. Schukajlow. Learning with visualizations helps: A meta-analysis of visualization interventions in mathematics education. Educational Research Review, 45:100639, 2024. Article 100639.
- J. D. Zamfirescu-Pereira, L. Qi, B. Hartmann, J. DeNero, and N. Norouzi. 61a bot report: Ai assistants in cs1 save students homework time and reduce demands on staff. (now what?). In Proceedings of the 56th ACM Technical Symposium on Computer Science Education V. 1, SIGCSE TS 2025, pages 1309–1315. Association for Computing Machinery, 2025.
© 2026 Copyright is held by the author(s). This work is distributed under the Creative Commons Attribution-NonCommercial-NoDerivatives 4.0 International (CC BY-NC-ND 4.0) license.