ABSTRACT
Psychomotor skill learning remains underexplored in educational data mining, which has historically focused on cognitive tasks. Understanding how learners progress toward mastery over time, rather than simply measuring final outcomes, is essential for designing adaptive instructional systems. In this work, we analyze trial-by-trial learning progressions from a simulated drone landing task. Participants completed 20 trials with performance categorized as crash, unsafe landing, or safe landing. We compute transition probabilities between performance categories and apply a k-medians clustering algorithm using Levenshtein distance to identify representative learning sequences. Transition results show that learners rarely make large performance jumps between consecutive trials and tend to maintain safe landings once achieved, consistent with our knowledge of motor skill acquisition. Clustering reveals meaningful learner profiles ranging from quick mastery to persistent struggle, with finer-grained distinctions emerging as the number of clusters increases. These findings provide an initial foundation for developing feedback and task selection policies in intelligent tutoring systems that are sensitive to a learner’s trajectory through skill acquisition, not only their current performance state.
Keywords
1. INTRODUCTION
Educational data mining research has largely focused on cognitive tasks such as problem-solving and knowledge acquisition. However, many real-world learning domains require the development of psychomotor skill combining cognitive reasoning and motor control. The unique dynamics of these tasks make them both harder to measure and harder to model than discrete knowledge states.
Aggregate measures of learning such as final accuracy or learning gain neglect to consider the path a learner took to get there. Two learners with identical final performance may have followed very different trajectories. Additionally, progress in skill acquisition is rarely monotonic; we often see plateaus, regressions, and bursts of improvement. Identifying common trajectory types moves emphasis from “did they learn?” toward “how did they learn?”. This approach is necessary for designing feedback that responds to a learner’s progression rather than their current performance snapshot alone.
Adaptive feedback systems are most effective when they can anticipate a learner’s near-future state or respond to long-term misconceptions rather than simply react to their last action. If distinct learner subgroups follow recognizably different paths through skill acquisition, feedback policies can be tailored to each pathway. This work takes a step toward data-driven feedback policy design by starting to understand the landscape of learning trajectories, laying the groundwork for eventually optimizing feedback to nudge learners toward more favorable pathways. In this work, we apply sequential analysis methods to explore typical learning progressions in a drone landing simulation, which offers a controlled learning environment with rich trial-by-trial performance data.
2. RELATED WORK
Research in intelligent tutoring systems has a rich history of using performance data to inform interventions and develop personalized analytics. In particular, Bayesian Knowledge Tracing models and variants use transition probabilities to represent how learners acquire knowledge over time [1, 14, 15, 18]. These models infer mastery based on previous estimates and the learner’s most recent performance. This approach to learner modeling acknowledges that learning is not a linear process and performance can fluctuate for a variety of reasons.
Additionally, learning and education data are well-suited for sequential analysis [21]. Sequential pattern mining tools have often been used to connect behavior patterns with learning outcomes [7, 11, 16], provide better interventions [4], or understand higher-level reasoning skills [2, 10]. Some work has started to use sequential analysis to understand learning trajectories [13], though this is not well studied for psychomotor tasks.
Recent work has also considered how identifying learner profiles can help inform recommendations and personalized learning paths [9, 17]. These are often applied to large-scale learning environments such as MOOCs and use features such as demographics and engagement metrics. More work is needed to understand how common sequences of learning performance can be used to shape feedback, especially for complex tasks.
3. APPROACH
3.1 Dataset
The data was collected in a previous study [5], but all analyses presented here are new. The study was approved by the local ethics board and all data are anonymized.
In an online study conducted through Prolific, participants completed 20 trials of a computer-based drone landing simulation [3] (see Figure 1). Participants were placed into one of three feedback conditions to improve their performance. The final set of participants is evenly split between feedback conditions, though the conditions are not explicitly considered in this work. We only consider data from those who completed all 20 trials, resulting in a final set of 166 participants.

The main measure of interest is participant performance on each of the 20 trials. In alignment with previous work [19, 20], landing performance was assigned to one of the ordinal labels crash, unsafe, or safe. A trial was labeled as safe if the participant landed the drone in the target area with a landing speed \(\leq 15\) m/s and a landing angle \(\leq 5^\circ \). Unsafe landings violated at least one of the landing speed or landing angle constraints. Finally, attempts that did not reach the landing pad were labeled as a crash. This approach yielded 3,320 total performance labels across all participants. Participants demonstrated mastery of the task by consistently achieving safe landings. Figure 2 shows the distribution of landing performance across trials.

We encoded the learning progression of each participant as a sequence of 20 “words” from a fixed vocabulary (i.e., landing performance category for each trial). These sequences were represented by a string of characters, with the characters C, U, S corresponding to crash, unsafe, or safe. An example sequence from a participant achieving only safe and unsafe landings is SUSUUUSSSSSUUUSSUSUS.
3.2 Analysis Methods
We first calculated the transition probabilities for the landing performance categories. These probabilities show how participants improve or regress in their performance between trials. Each value represents the likelihood of moving between two categories in consecutive trials. The transition matrix is normalized across rows, meaning the destination probabilities for each starting category sum to 1.
To identify representative learning progressions, we implemented a variant on the k-means clustering algorithm [12]. To calculate the distance between learning progression sequences, we used the Levenshtein edit distance [8]. Instead of calculating a numeric mean as the center of each cluster, we calculated the approximate generalized median string of all data points in a given cluster using the Levenshtein Python library ( https://pypi.org/project/python-Levenshtein/). To assess the quality of each cluster, we calculated the average within-cluster Levenshtein edit distance, where more similar sequences have a smaller edit distance.
Given no established value for the expected number of learning progression profiles, we used the elbow method across multiple values of \(k\). For each number of clusters \(k\), we calculated the average quality across all clusters and reported the best across 10 restarts.
4. RESULTS
The transition probabilities show how learners improve their performance between trials. Figure 3 shows the highest probability in the safe\(\to \)safe case, showing that learners are generally able to maintain consistent performance once they understand a task (nearly 70% of the time). There are also strong probabilities on the diagonal, where participants maintained their performance level between tasks. The superdiagonal of the matrix includes the next highest set of probabilities; these are the cases where participants jumped to the next performance level between trials. Similarly, the subdiagonal represents the cases where participants regress a level between trials, though these probabilities are notably smaller.
The transition matrix also shows it is unlikely to achieve large changes in performance between trials, either in the crash\(\to \)safe condition or the safe\(\to \)crash condition. In the context of a Bayesian Knowledge Tracing model of student performance, these conditions may relate to low “slip” and “guess” probabilities where learner performance is misaligned with their inherent mastery of the task.
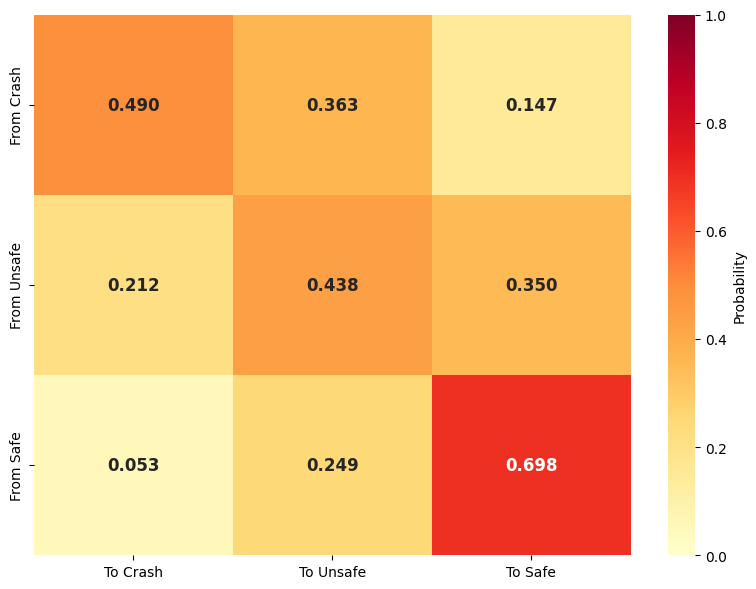
Figure 4 shows how cluster quality changes over a range of \(k\) values. We did not find a clear elbow; rather, the average edit distance across clusters steadily across the entire range. This suggests that adding more clusters will continue to identify more specific profiles, or a more nuanced evaluation metric is needed. Using a smaller number of clusters for designing feedback policies makes practical sense, since clusters will be more distinct and easier to interpret.
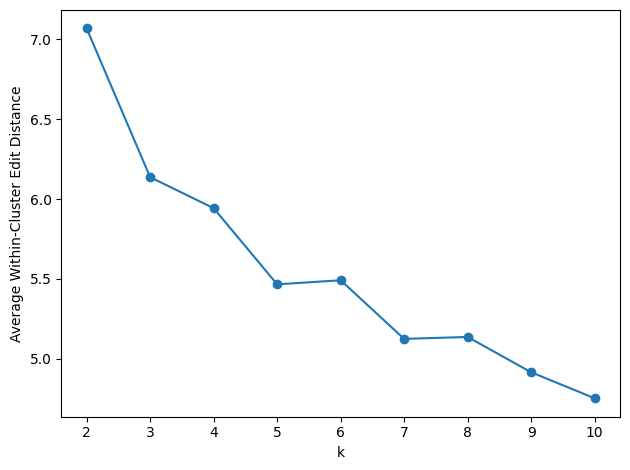
Table 1 shows detailed clustering results for \(k\in \{2, \ldots , 5\}\). Given the results of the elbow analysis above and in the interest of interpretability, we do not report results for higher values of \(k\).
| \(k\) | Mean Cluster Edit Distance | Cluster Centers |
|---|---|---|
| 2 | 7.07 | CCUCUCUUCUUCUUUSUSU CUSUSSSSSSSSSSSSSSS |
| 3 | 6.14 | CUSUSSSSSSSSSSSSSSS CCUCUUUUUUCUUSUUSU CCCCCCCCCCCCUCUCCCC |
| 4 | 5.80 | CUCUUSUSSSSSUSSSSS CSSSSSSSSSSSSSSSSSS CUCUCUUUUUCUUUUUUSU CCCCCCCCCCCCUCUCUCCC |
| 5 | 5.48 | CUUUSUUSSSUSSUSSSSUS CSUSSSSSSSSSSSSSSSS CCCUCUUUUUUUSUUSSUSS CUCUCCUUCUCCUUUUUCUU CCCCCCCCCCCCCCCCCCCC |
In the \(k=2\) condition, the centers represent the profile of a struggling learner and one who quickly masters the task. The profile of the struggling learner sees a majority of crash and unsafe landing outcomes, with a few safe landings towards the end of the trials. The quick learner shows a few crashes and unsafe landings at the beginning, quickly converging to consistent safe landings.
The other models show similar patterns. In the \(k=3\) condition, the profiles represent participants quick to master the task, those who consistently achieve unsafe landings, and those who may struggle to understand the control dynamics and crash most trials. The \(k=4\) condition adds another proficient learner that takes a bit longer to get comfortable with safe landings. Finally, the \(k=5\) condition adds a profile that achieves a few safe landings at the end, though they may need more practice to become consistent. These results show that clustering can identify meaningful learning progressions, with more clusters leading to more nuanced profiles that may be useful for detailed feedback development.
5. DISCUSSION
This study examined learning progression in a psychomotor drone landing task, finding that sequence clustering can uncover meaningful learner profiles from trial-by-trial performance data. The transition matrix results confirm that learners rarely make large jumps in performance between consecutive trials, and that once safe landings are achieved they tend to be maintained. This pattern is consistent with the consolidation dynamics characteristic of motor skill acquisition. Together, these results suggest that the ordinal performance encoding used here captures structure in the learning process.
The clustering results show that even a small number of profiles can meaningfully identify different types of learners. Even with two clusters, the model separates quick learners from those who struggle to achieve safe landings. Additional clusters reveal finer distinctions, such as learners who plateau at unsafe landings versus those who crash consistently. The absence of a clear elbow is itself informative; it suggests learner profiles may exist on a continuum rather than falling into a small number of clear types.
6. FUTURE WORK
The current work developed profiles of learning progression only using the final landing performance outcome for each trial. Future work can investigate how learner control inputs (e.g., joystick movements, button presses) can be used to understand the learning process and develop feedback. This can take inspiration from previous work focused on cognitive tasks [6].
Future work should also consider how these profiles of learning progression relate to the feedback conditions in the original experiment. Rather than evaluating personalized interventions based on static measures such as number of safe landings, applying sequence analysis to each condition separately may give a more detailed understanding of how feedback can shape a learner’s mastery of a task over time.
7. REFERENCES
- R. S. J. Baker, A. T. Corbett, and V. Aleven. More Accurate Student Modeling through Contextual Estimation of Slip and Guess Probabilities in Bayesian Knowledge Tracing. In B. P. Woolf, E. Aïmeur, R. Nkambou, and S. Lajoie, editors, Intelligent Tutoring Systems, pages 406–415, Berlin, Heidelberg, 2008. Springer Berlin Heidelberg.
- M. Bannert, P. Reimann, and C. Sonnenberg. Process mining techniques for analysing patterns and strategies in students’ self-regulated learning. Metacognition and learning, 9(2):161–185, 2014.
- S. Byeon,
E. Jensen,
M. S.
Yuh,
S. Sankaranarayanan,
N. Jain,
and
I. Hwang.
Quadrotor
landing
simulation,
2024.
Available
at
https://github.com/cairo-robotics/llm-multimodal-drone-feedback, version 0.0.1. - P. Fournier-Viger, U. Faghihi, R. Nkambou, and E. M. Nguifo. Exploiting sequential patterns found in users’ solutions and virtual tutor behavior to improve assistance in its. Journal of Educational Technology & Society, 13(1):13–24, 2010.
- E. Jensen, S. Sankaranarayanan, and B. Hayes. Automated assessment and adaptive multimodal formative feedback improves psychomotor skills training outcomes in quadrotor teleoperation. In 2024 International Conference on Human-Agent Interaction, pages 185 – 194, 2024.
- E. Jensen, T. Umada, N. C. Hunkins, S. K. D’Mello, S. Hutt, and A. C. Huggins-Manley. What You Do Predicts How You Do: Prospectively Modeling Student Quiz Performance Using Activity Features in an Online Learning Environment. In Proceedings of the 11th International Learning Analytics and Knowledge Conference (LAK21), pages 121 – 131, 2021.
- J. S. Kinnebrew, S. S. Killingsworth, D. B. Clark, G. Biswas, P. Sengupta, J. Minstrell, M. Martinez-Garza, and K. Krinks. Contextual markup and mining in digital games for science learning: Connecting player behaviors to learning goals. IEEE Transactions on Learning Technologies, 10(1):93–103, 2016.
- V. I. Levenshtein. Binary codes capable of correcting deletions, insertions, and reversals. In Soviet physics doklady, volume 10, pages 707–710. Soviet Union, 1966.
- L. Li and J. Xiao. Persona profiling: a multi-dimensional model to study learner subgroups in massive open online courses. Education and Information Technologies, 27(4):5521–5549, 2022.
- T. Liu and M. Israel. Uncovering students’ problem-solving processes in game-based learning environments. Computers & Education, 182:104462, 2022.
- D. Malekian, J. Bailey, and G. Kennedy. Prediction of students’ assessment readiness in online learning environments: the sequence matters. In Proceedings of the tenth international conference on learning analytics & knowledge, pages 382–391, 2020.
- J. B. McQueen. Some methods of classification and analysis of multivariate observations. In Proc. of 5th Berkeley Symposium on Math. Stat. and Prob., pages 281–297, 1967.
- J. Moon and Z. Liu. Rich representations for analyzing learning trajectories: Systematic review on sequential data analytics in game-based learning research. Data analytics approaches in educational games and gamification systems, pages 27–53, 2019.
- R. Pelánek. Bayesian knowledge tracing, logistic models, and beyond: an overview of learner modeling techniques. User Modeling and User-Adapted Interaction, 27:313–350, 2017.
- M. O. C. Z. San Pedro, R. S. Baker, and M. M. T. Rodrigo. Detecting Carelessness through Contextual Estimation of Slip Probabilities among Students Using an Intelligent Tutor for Mathematics. In G. Biswas, S. Bull, J. Kay, and A. Mitrovic, editors, Artificial Intelligence in Education, pages 304–311. Springer Berlin Heidelberg, 2011.
- D. Sun, G. Cheng, and H. Luo. Analysing the evolution of student interaction patterns in a massive private online course. Interactive Learning Environments, 32(2):693–706, 2024.
- X. Xie and X. Feng. Personalized learning path recommendation based on learner profile and knowledge graph. Computing and Informatics, 44(4):983–1008, 2025.
- M. V. Yudelson, K. R. Koedinger, and G. J. Gordon. Individualized Bayesian Knowledge Tracing Models. In H. C. Lane, K. Yacef, J. Mostow, and P. Pavlik, editors, Artificial Intelligence in Education, pages 171–180, Berlin, Heidelberg, 2013. Springer Berlin Heidelberg.
- M. S. Yuh, K. R. Ortiz, K. S. Sommer-Kohrt, M. Oishi, and N. Jain. Classification of Human Learning Stages via Kernel Distribution Embeddings. IEEE Open Journal of Control Systems, 3:102–117, 2024.
- M. S. Yuh, E. Rabb, A. Thorpe, and N. Jain. Using Reward Shaping to Train Cognitive-Based Control Policies for Intelligent Tutoring Systems. In 2024 American Control Conference (ACC), pages 3223–3230, Toronto, ON, Canada, July 2024.
- Y. Zhang and L. Paquette. Sequential Pattern Mining in Educational Data: The Application Context, Potential, Strengths, and Limitations, pages 219–254. Springer Nature Singapore, Singapore, 2023.
© 2026 Copyright is held by the author(s). This work is distributed under the Creative Commons Attribution-NonCommercial-NoDerivatives 4.0 International (CC BY-NC-ND 4.0) license.