ABSTRACT
Educational research often seeks causal evidence about instructional and content design choices, yet randomized experiments can be difficult to run at scale. Although separate content-level experimental studies are technically possible, they are often impractical without substantial infrastructure and coordination. Quasi-experimental studies, whether through design or through post-hoc analysis of non-experimental data, offer opportunities to infer causality from student interactions with learning content. In the context of digital learning platforms, however, the rich process data collected through student interactions has remained underutilized and represents a strong opportunity to better account for confounding that may otherwise go unaccounted for by covariates available in student course, enrollment, and survey data. To address this gap, in this study, we conduct a causal analysis to estimate the effectiveness of an on-demand explanation using a propensity score weighting analysis with data from the ASSISTments digital learning platform. We draw from prior work in educational data mining and AI in education to leverage Deep Knowledge Tracing as a method to estimate propensity scores. We find that requesting an explanation is associated with lower next-problem performance, but we further identify heterogeneous causal effects, suggesting improved short-term learning for higher-effort students who request explanations compared with those who request only the answer. Overall, this study demonstrates how learner-model representations and process measures can strengthen quasi-experimental analyses of platform logs, while emphasizing that the effectiveness of on-demand explanations depends on students’ engagement and help-seeking strategies.
Keywords
1. INTRODUCTION
Educational research increasingly seeks causal evidence to inform instructional and content design decisions. Randomized experiments provide a strong foundation for such evidence and have been successfully deployed in digital learning platforms (DLPs), including studies that systematically vary instructional supports such as hints, feedback, and explanations [14, 15, 17]. However, running experiments comprehensively across the wide range of problems, supports, and learning contexts in large-scale platforms requires substantial infrastructure and coordination, and is often impractical for systems that are already widely deployed. As a result, researchers frequently rely on observational interaction data, raising the challenge of how to draw credible causal inferences from non-experimental platform logs [3, 7].
Causal inference in observational DLP data is particularly challenging because students’ interactions with instructional supports are highly non-random. Students who request help often differ systematically from those who do not, not only in prior knowledge but also in engagement, persistence, and other learner characteristics that jointly influence both help-seeking behavior and learning outcomes [11]. These selection effects can substantially bias naïve estimates of instructional effectiveness if not adequately addressed. Recent work in educational data mining (EDM) has therefore emphasized the need for clearly defining causal estimands, evaluating common support, diagnosing covariate balance, and assessing robustness to unobserved confounding [4, 8, 10, 23].
Despite this progress, a persistent limitation of many observational studies is that adjustment for confounding often relies on relatively coarse or static proxies for prior knowledge, such as aggregate accuracy. This is problematic because prior outcomes are often among the most important confounders of treatment [20]. This mismatch is particularly striking given that digital learning platforms record rich, high-dimensional, and temporally structured process data that summarize students’ learning histories in far greater detail than is typically used in causal analyses [19].
To address this gap, in this study, we conduct a quasi-experimental causal analysis that leverages learner-model representations to strengthen control for confounding in observational platform data. Using data from ASSISTments, we estimate the short-term causal effect of requesting an on-demand explanation for a single target problem using propensity score weighting [9]. We first train a Deep Knowledge Tracing (DKT) model on students’ historical interactions to produce fine-grained, skill-level mastery estimates that summarize each learner’s prior learning history [16]. These mastery estimates are then incorporated as covariates in propensity score estimation [13], following contemporary guidance for machine learning–based causal inference in educational data mining [8, 10]. We compare explanation use against two counterfactual baselines—no on-demand help-seeking and answer-only requests—and examine heterogeneity by engagement, motivated by the hypothesis that explanations may support sense-making use but not rapid task completion. Specifically, we address the following research questions:
- What is the effect of requesting on-demand explanations in comparison to students who do not seek help on learning, as measured by correctness on the next problem?
- What is the effect of requesting on-demand explanations in comparison to students who ask for the answer on learning, as measured by correctness on the next problem?
- Are the effects of explanation use heterogeneous across students with different levels of engagement?
2. METHODS
2.1 Dataset
The data1 were drawn from ASSISTments, a digital learning platform widely used in U.S. middle school mathematics instruction. We focus on students who attempted a target problem and a subsequent problem assessing the same skill (7.RP.A; proportional reasoning). The target problem was completed by 12,697 students, of whom 7,179 answered incorrectly and were included in the analytic sample.
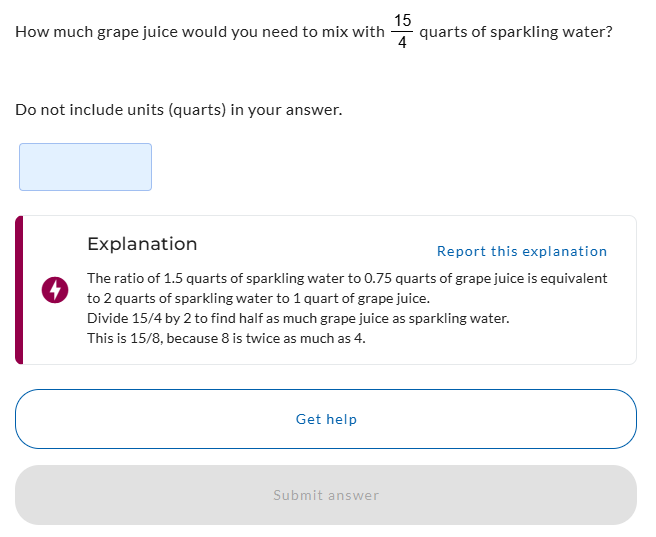
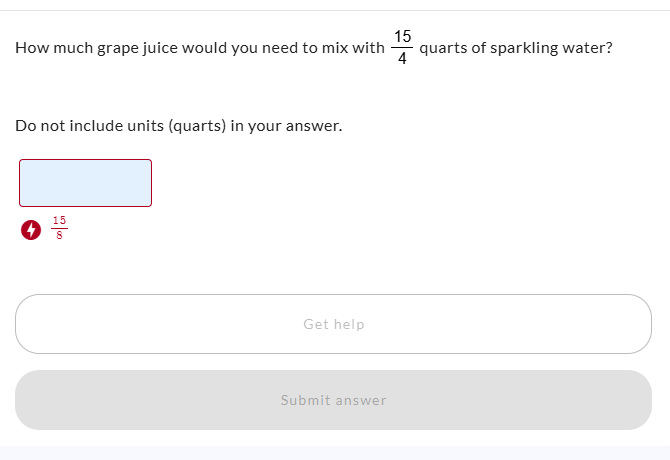
Students could optionally request on-demand supports while solving the target problem. As shown in Figure 1, the explanation provides step-by-step guidance, whereas Figure 2 shows the answer-only view, which reveals the final solution without intermediate steps. The outcome is a binary indicator of correctness on the subsequent problem (968 correct; 6,211 incorrect). Student interaction logs included problem attempts, correctness, skill identifiers, and help-seeking actions. These data were used to construct prior knowledge measures and behavioral indicators such as time-on-task.
2.2 Data Processing
Problem-level logs were transformed into student–skill sequences. Each problem attempt was mapped to a skill identifier, and each unique skill, including multi-skill combinations, was treated as a distinct category (as suggested in [22]), resulting in \(K = 189\) skills. (All 189 skill labels are available on the Open Science Framework (OSF))2. The final processed dataset consisted of 1,700,234 problem-attempt rows from 7,179 unique students, with each row aligned to a single student, a single encoded skill, and a unique row identifier to support downstream model training and post hoc analyses.
2.3 Analytic Approach
To estimate the causal effect of explanation use, we combined learner modeling with propensity score weighting (PSW). First, we trained a DKT model on students’ interaction sequences to obtain skill-level mastery estimates. Students with fewer than two interactions (\(n = 30\)) were excluded, yielding 7,149 students. The model was trained using an LSTM architecture with 10-fold cross-validation to generate out-of-fold predictions (AUC = 0.742), which were used as high-dimensional covariates representing prior knowledge.
Next, we constructed mutually exclusive help-seeking groups based on students’ behavior on the target problem. Students were categorized into three groups: (1) Explanation, students who requested an explanation only; (2) Answer-only, students who requested an answer only; and (3) No-help, students who did not request any help. The final analytic sample included 821 students in the Explanation group, 3,659 in the Answer-only group, and 1,535 in the No-help group.
To examine heterogeneity, we defined an effort-based subset within the Explanation group using adjusted time-on-task derived from log data (Figure 3). Time was computed as problem duration minus time to first response and log-transformed due to skew. The Moderate-Effort subset included students whose adjusted time fell between the mean and mean plus 0.5 standard deviations (\(n=153\)), while the High-Effort subset included students whose adjusted time fell between the mean and mean plus 1 standard deviation (\(n=228\)).

For causal estimation, we applied PSW to adjust for observed differences between groups [13, 18]. Propensity scores were estimated using multiple models, including logistic regression (LR), gradient boosting machines (GBM), random forests (RF), Bayesian additive regression trees (BART), and neural networks (NN), following recent recommendations for machine learning–based causal inference [10]. Separate propensity score models were estimated for each treatment–control contrast (explanation vs. no-help, explanation vs. answer-only, and effort-based subsets).
For each estimator, the common-support assumption was evaluated by examining the overlap in propensity score distributions between treated and control groups. Models exhibiting limited overlap or extreme propensity scores were excluded. Covariate balance was assessed using absolute standardized mean differences (SMDs), with acceptable balance defined as \(|\)SMD\(| \le 0.25\) [21]. Weights targeting the average treatment effect on the treated (ATT) were constructed such that treated units received weight 1 and control units received \(PS/(1-PS)\). Residual imbalance (\(0.05 \le |\)SMD\(| \le 0.25\)) was addressed by including covariates in outcome models.
Treatment effects were estimated using a parametric standardization approach with weighted logistic regression models predicting next-problem correctness [5]. Cluster-robust standard errors were computed to account for classroom-level dependence [12], and statistical uncertainty was quantified using cluster bootstrap resampling (100 replications) to obtain 95% confidence intervals. Sensitivity analyses were conducted using Frank’s robustness framework to assess the impact of potential unobserved confounding [6].
3. RESULTS
3.1 RQ1: Effects of On-Demand Explanations Compared to No Help-Seeking
We examined whether requesting explanations affected subsequent performance compared to not seeking help (\(n_{control}=1535\), \(n_{treat}=821\)) using PSW based on 189 DKT-derived covariates. Common-support diagnostics indicated adequate overlap for LR, GBM, and BART, while RF and NN exhibited limited or unstable support and were excluded from further analysis. All common-support diagnostics are available on OSF. After weighting, covariate balance improved substantially for LR, GBM, and BART (max \(|\)SMD\(|\) reduced from 0.973 to 0.167 under LR, 0.177 under BART, and 0.224 under GBM, respectively), indicating that observed differences between groups were effectively reduced.
Among retained estimators, results were consistent in both direction and magnitude. The LR-based ATT was \(-0.185\) (SE = 0.028, 95% CI [\(-0.250\), \(-0.147\)]), and BART yielded a similar estimate of \(-0.191\) (SE = 0.029, 95% CI [\(-0.256\), \(-0.149\)]). Although GBM produced a negative estimate, it was excluded due to instability under bootstrap resampling. Sensitivity analyses indicated that these negative effects were robust to potential unobserved confounding. These results suggest that, after adjusting for prior knowledge and observed covariates, students who requested explanations were less likely to correctly answer the subsequent problem than comparable students who did not seek help.
3.2 RQ2: Effects of On-Demand Explanations Compared to Answer-Only
We next compared explanation use to answer-only help
(\(n_{\text {control}}=3659\), \(n_{\text {treat}}=821\)). Common-support diagnostics indicated adequate overlap
for LR, GBM, and BART, while RF and NN showed weaker or
unstable support. Propensity score weighting improved covariate
balance, with all retained estimators achieving acceptable
post-weighting balance (\(|SMD| \leq 0.25\)) and most covariates showing low
imbalance (\(|SMD| < 0.10\)).
Across all retained estimators, treatment effects were consistently near zero and not statistically significant. The LR-based ATT was \(0.000\) (SE = 0.012, 95% CI [\(-0.021\), \(0.026\)]), with similar near-zero estimates observed for GBM and BART. These findings indicate that, on average, requesting an explanation does not lead to improved short-term performance compared to simply viewing the answer.
3.3 RQ3: Heterogeneity of Explanation Effects by Student Engagement
We examined heterogeneity by focusing on an effort-based subset of students within the Explanation group (\(n = 228\)), representing moderate-to-high engagement.
Explanation (effort-based subset) vs. no help-seeking. Adequate common support was observed for LR and BART, and weighting improved covariate balance (max \(|\)SMD\(|\) reduced to 0.162 for LR and 0.146 for BART). Both estimators yielded statistically significant negative effects. The LR-based ATT was \(-0.139\) (SE = 0.024, 95% CI [\(-0.179\), \(-0.093\)]), and BART produced \(-0.184\) (SE = 0.040, 95% CI [\(-0.249\), \(-0.131\)]). Although these effects remain negative, they are smaller in magnitude compared to the full-sample results, suggesting that greater engagement may partially mitigate the negative association observed in RQ1.
Explanation (effort-based subset) vs. answer-only. Common support was broader across estimators, and weighting achieved acceptable covariate balance. In contrast to the previous comparison, estimated effects were small but positive. The LR-based ATT was \(0.048\) (SE = 0.024, 95% CI [\(0.002\), \(0.095\)]), and BART yielded \(0.057\) (SE = 0.025, 95% CI [\(0.016\), \(0.100\)]). These findings indicate that, among more engaged students, explanations may provide modest benefits relative to answer-only support.
4. DISCUSSION AND FUTURE WORK
This study uses observational log data from ASSISTments to estimate the short-term causal effects of on-demand explanation use on subsequent problem performance. Methodologically, we integrate learner modeling with causal inference by incorporating DKT-derived skill mastery estimates as high-dimensional covariates in PSW models. This approach provides a richer adjustment for prior knowledge than commonly used proxies and illustrates how learner-model representations can strengthen causal analyses of platform log data [8, 10]. We also follow contemporary guidance for machine learning–based propensity score estimation, including overlap checks, balance diagnostics, estimator comparison, sensitivity analyses, and documentation of retained models [4, 8, 10]. Overall, these design choices illustrate how learner-model outputs and process data can strengthen post-hoc causal analyses of platform logs [23].
Across comparisons, explanation use was not associated with improved short-term performance on average and was instead linked to lower subsequent correctness when compared to students who did not seek help (RQ1). One plausible explanation for this pattern is the presence of unproductive help-seeking behaviors, such as gaming the system, that are not fully captured by the DKT-derived prior knowledge estimates. While DKT controls for students’ historical performance at the skill level, it does not explicitly model behavioral tendencies related to strategic help use, such as rapidly requesting explanations to complete assignments rather than to support understanding. As a result, explanation use in this comparison may partially proxy for underlying gaming behavior, which has been shown to undermine learning outcomes in tutoring systems [1, 2]. In this sense, the estimated effects may reflect the impact of clicking to access help and receiving an explanation as enacted in the platform, rather than the effect of engaging with an explanation under conditions of productive use.
At the same time, alternative mechanisms may contribute to the observed negative average effects. Students in the no-help-seeking control group may engage more often in self-regulated problem solving, including persistence through errors, metacognitive monitoring, and strategy refinement. They may also seek support from external sources, such as peers, teachers, or other materials, which are not captured in platform data. These unobserved differences highlight an important limitation of log-based analyses and suggest that comparisons between help-seeking and non-help-seeking students may conflate the effects of instructional supports with broader differences in learning strategies and resource use.
In contrast, the explanation-versus-answer-only comparison (RQ2) yielded near-zero average effects across retained estimators, with confidence intervals spanning zero. This finding suggests that, for the target problem examined, viewing an explanation rather than only the final answer is associated with little to no immediate difference in performance on the subsequent problem. These near-zero estimates should not be interpreted as evidence that explanations lack educational value more broadly. Instead, they indicate that the effectiveness of explanations likely depends on how students engage with the support, rather than on the mere availability of help [8].
Results from the effort-based subset analysis (RQ3) further clarify this heterogeneity. When the explanation subgroup with moderate-to-higher adjusted time-on-task was compared to no-help-seeking controls, estimated effects remained negative, but with reduced magnitude. When the same effort-based subset was compared to answer-only students, estimated effects were small and positive. These contrasts suggest that explanation use does not operate as a uniformly beneficial treatment. Instead, outcomes vary with students’ engagement patterns and with the counterfactual baseline. From a design perspective, these findings motivate platform features that better distinguish sense-making help use from rapid answer-seeking and that scaffold students toward more constructive engagement with explanations.
Several limitations remain. First, although we control for prior knowledge using DKT and include log-based engagement measures, we do not directly observe other learner characteristics such as motivation, metacognition, or affect. Second, the analysis focuses on a single problem and performance on the next problem, which may limit generalizability to other content areas or longer learning sequences. Third, although we examine heterogeneity using an effort-based proxy, engagement is likely multi-dimensional and may not be fully captured by time-on-task alone. With that, future work should extend this approach by incorporating richer measures of student behavior, including finer-grained indicators of self-regulated learning. In addition, applying this framework across multiple problems would help clarify the longer-term effects of explanation use.
5. CONCLUSION
This study demonstrates how learner-model representations and process data can be integrated into a rigorous quasi-experimental framework to estimate causal effects from observational digital learning platform logs. By incorporating Deep Knowledge Tracing–based skill mastery estimates as high-dimensional confounding controls within propensity score weighting, the approach extends common EDM practice and supports more transparent and principled causal inference. Applied to on-demand explanation use in ASSISTments, the findings show that explanations do not yield uniform short-term performance benefits and that their effects depend on students’ engagement and help-seeking behaviors. Overall, these results demonstrate the importance of evaluating instructional supports as they are enacted in real learning contexts and highlight the methodological value of combining learner modeling with causal inference to study heterogeneous effects in educational data.
6. ACKNOWLEDGMENTS
We would like to thank the National Science Foundation (#2331379), Institute of Education Sciences (#R305B230007), Gates Foundation (#078981), Support from the Learning Engineering Tools Competition, and other anonymous philanthropy.
7. REFERENCES
- R. Baker, J. Walonoski, N. Heffernan, I. Roll, A. Corbett, and K. Koedinger. Why students engage in “gaming the system” behavior in interactive learning environments. Journal of Interactive Learning Research, 19(2):185–224, 2008.
- R. S. Baker, J. E. Richey, J. Zhang, S. Karumbaiah, J. M. Andres-Bray, H. A. Nguyen, J. M. A. L. Andres, and B. M. McLaren. Gaming the system mediates the relationship between gender and learning outcomes in a digital learning game. Instructional Science, 53(2):203–238, 2025.
- J. E. Beck, K.-m. Chang, J. Mostow, and A. Corbett. Does help help? introducing the bayesian evaluation and assessment methodology. In International conference on intelligent tutoring systems, pages 383–394. Springer, 2008.
- A. F. Botelho, A. H. Closser, A. C. Sales, N. T. Heffernan, and K. P. Vanacore. 2024 workshop on causal inference in educational data mining. In Proceedings of the Seventeenth International Conference on Educational Data Mining (EDM 2024), 2024. Workshop proposal.
- B. A. Brumback. Fundamentals of causal inference: with R. Chapman and Hall/CRC, 2021.
- K. A. Frank, S. J. Maroulis, M. Q. Duong, and B. M. Kelcey. What would it take to change an inference? using rubin’s causal model to interpret the robustness of causal inferences. Educational Evaluation and Policy Analysis, 35(4):437–460, 2013.
- J.-E. Gustafsson. Causal inference in educational effectiveness research: A comparison of three methods to investigate effects of homework on student achievement. School Effectiveness and School Improvement, 24(3):275–295, 2013.
- K. Kitto, B. Hicks, and S. Buckingham Shum. Using causal models to bridge the divide between big data and educational theory. British Journal of Educational Technology, 54(5):1095–1124, 2023.
- W. Leite. Practical propensity score methods using R. Sage Publications, 2016.
- W. Leite, H. Zhang, Z. Collier, K. Chawla, L. Kong, Y. Lee, J. Quan, and O. Soyoye. Machine learning for propensity score estimation: A systematic review and reporting guidelines. Psychological Methods, 2025.
- R. Li, N. Che Hassan, and N. Saharuddin. College student’s academic help-seeking behavior: A systematic literature review. Behavioral Sciences, 13(8):637, 2023.
- T. Lumley. Analysis of complex survey samples. Journal of Statistical Software, 9(8):1–19, 2004.
- J. K. Lunceford and M. Davidian. Stratification and weighting via the propensity score in estimation of causal treatment effects: a comparative study. Statistics in medicine, 23(19):2937–2960, 2004.
- K. S. Ostrow and N. T. Heffernan. Studying learning at scale with the assistments testbed. In Proceedings of the third (2016) ACM conference on learning@ scale, pages 333–334, 2016.
- T. Patikorn and N. T. Heffernan. Effectiveness of crowd-sourcing on-demand assistance from teachers in online learning platforms. In Proceedings of the Seventh ACM Conference on Learning @ Scale, L@S ’20, page 115–124, New York, NY, USA, 2020. Association for Computing Machinery.
- C. Piech, J. Bassen, J. Huang, S. Ganguli, M. Sahami, L. J. Guibas, and J. Sohl-Dickstein. Deep knowledge tracing. Advances in neural information processing systems, 28, 2015.
- S. Ritter, A. Murphy, and S. Fancsali. Curriculum-embedded experimentation. In Third Workshop on A/B Testing and Platform-Enabled Research (Learning@ Scale 2022), New York, NY, USA., 2022.
- P. R. Rosenbaum and D. B. Rubin. The central role of the propensity score in observational studies for causal effects. Biometrika, 70(1):41–55, 1983.
- A. Sales, A. Botelho, T. Patikorn, and N. T. Heffernan. Using big data to sharpen design-based inference in a/b tests. In Proceedings of the eleventh international conference on educational data mining, 2018.
- P. M. Steiner, T. D. Cook, W. R. Shadish, and M. H. Clark. The importance of covariate selection in controlling for selection bias in observational studies. Psychological methods, 15(3):250, 2010.
- E. A. Stuart. Matching methods for causal inference: A review and a look forward. Statistical science: a review journal of the Institute of Mathematical Statistics, 25(1):1, 2010.
- X. Xiong, S. Zhao, E. G. Van Inwegen, and J. E. Beck. Going deeper with deep knowledge tracing. In Proceedings of the Ninth International Conference on Educational Data Mining. International Educational Data Mining Society, 2016.
- L. Yao, Z. Chu, S. Li, Y. Li, J. Gao, and A. Zhang. A survey on causal inference. ACM Transactions on Knowledge Discovery from Data (TKDD), 15(5):1–46, 2021.
1This study involves post hoc analysis of platform log data conducted with approval from an Institutional Review Board (IRB). Data access may be granted through a data-sharing agreement with ASSISTments.
2https://osf.io/vgd76/overview?view_only=4c03f1f48f4d47c9a170a78a487c128a
© 2026 Copyright is held by the author(s). This work is distributed under the Creative Commons Attribution-NonCommercial-NoDerivatives 4.0 International (CC BY-NC-ND 4.0) license.