ABSTRACT
With the widespread adoption of digital learning environments, learning support utilizing log data collected from Learning Management Systems (LMS) has garnered significant attention. However, many conventional learning analytics rely on aggregated metrics such as total study time or the number of accesses, thereby failing to capture complex temporal dynamics, such as the sequential context of learning behaviors. In this study, we propose an unsupervised anomaly detection method that extracts atypical behaviors that deviate from standard learning patterns using students’ behavior stream data. Specifically, we use a Transformer Encoder to generate contextualized embedding vectors from the time-series sequences of learning behaviors, and apply an Isolation Forest to detect anomalous behaviors without incurring labeling costs. Experimental results using actual university learning log data confirmed that the majority of the detected anomalous behaviors were immediate exits (i.e., merely opening and closing materials) lacking the context of page transitions. While these anomalous behaviors were predominantly observed among low-performing students (F and D grades), approximately 30% of the logs classified as anomalous belonged to high-performing students (A grades). Atypical behaviors extracted through unsupervised anomaly detection suggest the inclusion of not only indications of learning deficiencies, such as immediate exits, but also advanced learning strategies adopted by high-performing students, such as the concurrent study of multiple materials and the marking of crucial sections.
Keywords
1. INTRODUCTION
The widespread adoption of digital learning environments has led to increased interest in learning analytics utilizing log data collected from Learning Management Systems (LMS). Many conventional analyses have relied on aggregated metrics, such as access frequency and total learning time, which fail to capture complex temporal dynamics, including the sequential context of learning behaviors. For example, even with the same number of actions, the learning process of a student who rapidly skips through pages differs fundamentally from that of a student who occasionally returns to review previous content. To address this issue, we propose an unsupervised anomaly detection method that considers the context of learning behaviors. In educational data, clearly defining what constitutes effective or ineffective learning and manually labeling such data entails substantial labor and computational costs. Furthermore, supervised learning carries the risk of overlooking unknown learning strategies that do not fit into predefined categories. Therefore, we adopted an approach that establishes the standard learning behaviors exhibited by the majority of students as a baseline and detects anomalous behaviors deviating from this norm in an unsupervised manner. Specifically, we use a Transformer Encoder [9] to convert temporal sequences into feature vectors that retain contextual information, and then detect anomalous behavior patterns using an Isolation Forest [6]. The main contributions of this study are as follows:
- Context-aware feature extraction: We proposed an embedding method that captures the structure of temporal behavior sequences by combining Inverse Document Frequency (IDF) weighting based on action frequency with a Masked Language Modeling (MLM) task.
- Construction of an unsupervised anomaly detection pipeline: We built a framework that eliminates the costs and biases associated with labeling, directly extracting distinctive behaviors from behavioral stream data.
- Validation of effectiveness using real-world data: Through experiments using actual university learning logs, we demonstrated that the proposed method can accurately extract not only a lack of learning, such as immediate exits, but also advanced learning strategies employed by high-performing students.
2. RELATED WORK
In Educational Data Mining, analyses utilizing learning behavior logs are actively being conducted. Kohama et al. proposed a method for predicting academic performance by representing the occurrence counts of actions within digital materials as histogram features [5]. While this method is effective in capturing overall grade trends, it relies on the mere aggregation of actions, leading to the loss of sequential and contextual specificities of learning. Recently, sequence modeling using Transformer architectures has gained significant traction in EDM. For instance, models such as Self-Attentive Knowledge Tracing (SAKT) [8] and SAINT [1] have successfully applied attention mechanisms to model complex dependencies in student interaction sequences. While these models excel in processing sequential data, they are primarily designed for supervised tasks, such as predicting correctness or final grades. Consequently, they require substantial labeled data and risk overlooking novel or atypical learning strategies that fall outside predefined categories. On the other hand, as an attempt at anomaly detection considering sequential context, Jiang et al. proposed an approach that models sequential data using self-supervised learning and detects anomalous learning behaviors based on the prediction error of the next action [4]. However, because this method relies on unidirectional prediction from the past to the future, it is limited by its inability to fully capture bidirectional dependencies of preceding and succeeding actions. To resolve these issues, this study proposes an anomaly detection approach that extracts unknown, atypical learning patterns in an unsupervised manner using an Isolation Forest, while simultaneously preserving the contextual information of the action sequences through the use of a Transformer Encoder.
3. PROPOSED METHOD
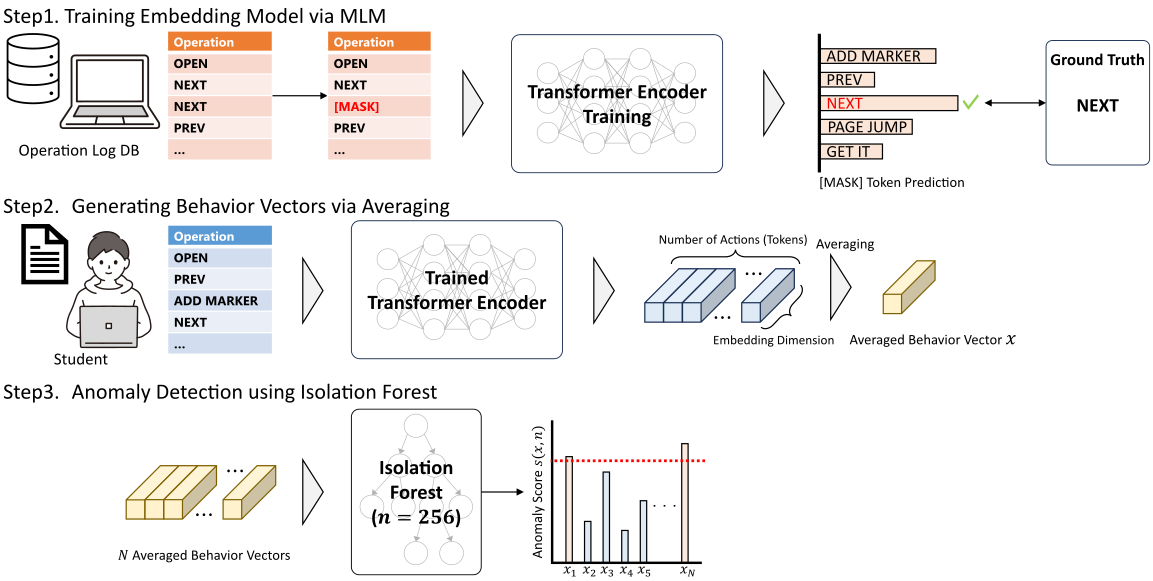
The proposed method consists of three components: training an embedding model via an MLM task, generating vector representations of behavior patterns by averaging the vector representations of individual actions, and detecting action sequences containing anomalous behaviors using an Isolation Forest. An overview of the proposed method is shown in Figure 1.
3.1 Training the Embedding Model via MLM Task
A Transformer Encoder is utilized to acquire vector representations that capture contextual information from the time-series data of learning behaviors. During training, a Masked Language Modeling (MLM) task was employed to account for the relationships with preceding and succeeding actions. Within the learning behavior logs serving as training data, a significant imbalance exists between actions that are frequently performed by many students and those that occur rarely. Because it is crucial to consider not only the simple frequency of occurrence but also how common an action generally is, this method adopts Inverse Document Frequency (IDF)—a metric focusing on the proportion of students who performed the action as a weight for the loss function. Building upon the architecture of BERT-Base [2], the model maps each discrete action into a dense continuous space. The embedding dimension was set to 768, following the standard configuration of BERT-Base, to preserve sufficient representational capacity for modeling complex behavioral patterns. This allows the model to learn structural dependencies, such as in what sequence or context a certain action is likely to occur, factoring in the specificity of the learning behavior rather than relying solely on raw action frequencies.
3.2 Generation of Behavior Pattern Vector Representations via Averaging
The Transformer Encoder, optimized through the MLM task, is used to extract features from the learning behavior sequences targeted for anomaly detection. Each learner’s sequence of actions is fed into the model to obtain contextualized vector representations for the individual actions constituting the sequence. Subsequently, the obtained vector representations of each action are averaged over the length of the action sequence. Through this process, a fixed-length vector representing the entire sequence of learning behavior patterns is generated while preserving the context of individual actions. This enables the comparison and evaluation of diverse action sequences of varying lengths within a unified feature space.
3.3 Construction of the Isolation Forest
An Isolation Forest, an unsupervised anomaly detection algorithm based on decision trees, is applied to the generated averaged behavior vectors. During the construction phase, the data is recursively partitioned into two by randomly selecting a feature and a split point randomly determined between its maximum and minimum values. By repeating this process, numerous decision trees are constructed to form the forest.
3.4 Anomaly Detection Based on Path Length
Using the constructed Isolation Forest, the anomaly score for each behavior sequence is calculated based on the average path length required for the data point to become isolated in a leaf node. The anomaly score is defined by Equation (1).
Here, \(x\) is the data point, \(h(x)\) is the path length required for data \(x\) to reach a leaf node, \(E(h(x))\) is the average path length across all decision trees, and \(c(n)\) is the average path length for a dataset of size \(n\). Normal data require many splits to be isolated, whereas anomalous data are isolated with fewer splits, generally resulting in shorter path lengths. This property is leveraged to detect anomalous behaviors.
4. EVALUATION EXPERIMENTS
In this experiment, an Isolation Forest was applied to the feature vectors generated by the proposed method to calculate the anomaly score of each action sequence. Subsequently, the top 5% of the calculated anomaly scores were extracted as anomalous action sequences.
4.1 Datasets
In this study, we used learning behavior log data from 1,446 students, collected via the learning management system BookRoll [7, 3] during lectures conducted at Kyushu University between the 2019 and 2022 academic years. The data consists of seven courses, labeled A through G, which vary in lecture content and instructors. For the experiment, the log data was restricted to activities occurring within lecture hours, and was divided into training data (data up to the 2021 academic year) and evaluation data (data from the 2022 academic year). The logs contain detailed records of learning operations, such as user IDs, operation types, and operation timestamps. Among all operations, NEXT accounts for approximately 61% and PREV for about 27%, meaning these two page transition operations alone constitute nearly 90% of the total.
4.2 Experimental Results
Table 1 presents the results of the anomaly detection. In the evaluation data, while the average number of actions for normal data was approximately 152.2, the anomalous data averaged only 30.6 actions, confirming a significant tendency for fewer actions in the latter group. Examining the grade distribution, the anomalous data group exhibited a higher proportion of F and D grades. Conversely, students with an A grade also accounted for nearly 30% (28.4%) of the anomalous data. This is likely because the detection captured weeks where students exhibited atypical behavior patterns differing from standard learning behaviors, or weeks where the number of actions significantly decreased due to extremely short study times caused by arriving late or leaving early.
| Result | Count | Ratio [%] | Avg. Actions | Grade Distribution [%]
| ||||
|---|---|---|---|---|---|---|---|---|
| A | B | C | D | F
| ||||
| Normal | 1,389 | 94.9 | 152.2 | 38.7 | 27.1 | 19.8 | 9.8 | 4.6 |
| Anomalous | 74 | 5.1 | 30.6 | 28.4 | 16.2 | 23.0 | 21.6 | 10.8 |
4.3 Ablation Study on IDF Weighting
To verify the effectiveness of IDF weighting, we compared the anomaly detection results with a model that does not use IDF (the baseline). Table 2 shows the anomaly detection results without IDF. Compared to Table 1, while no major differences were observed between the presence and absence of IDF in terms of the total number of detections or the average number of actions, the proposed method incorporating IDF showed a slight tendency to improve the detection rate of students in the lower academic tiers (F and D grades). Furthermore, approximately 75% (55 instances) of the extracted anomalous data were common to both models, and these were primarily data with an extremely low number of actions, such as immediate exits.
| Result | Count | Ratio [%] | Avg. Actions | Grade Distribution [%]
| ||||
|---|---|---|---|---|---|---|---|---|
| A | B | C | D | F
| ||||
| Normal | 1393 | 95.2 | 151.9 | 38.6 | 27.1 | 19.7 | 9.9 | 4.7 |
| Anomalous | 70 | 4.8 | 30.7 | 28.6 | 17.1 | 25.7 | 20.0 | 8.6 |
5. ANALYSIS AND DISCUSSION
Based on the experimental results from the previous section, we present a detailed analysis of the behavior histories classified as anomalous.
5.1 Qualitative Evaluation by Clustering
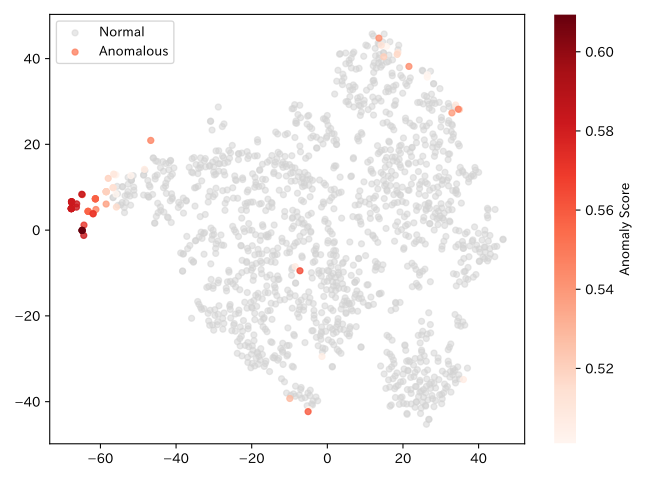
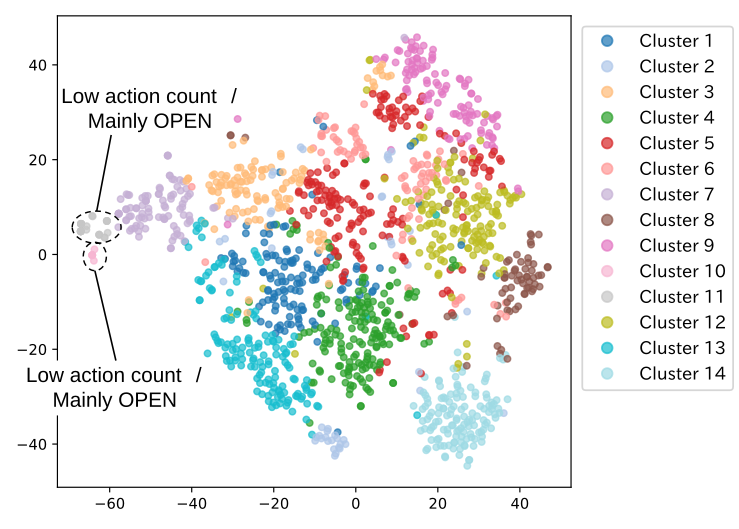
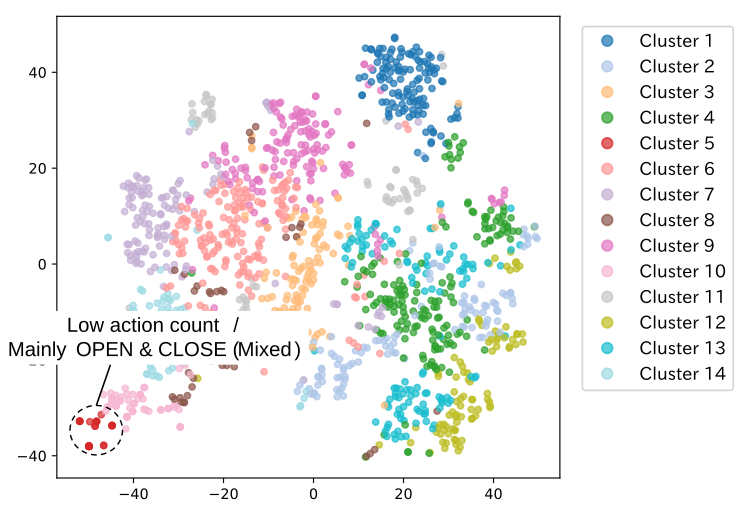
To qualitatively evaluate the characteristics of the features generated by the proposed method, we visualized the distribution of the averaged behavior vectors. We employed t-SNE as a visualization method to compress the high dimensional feature space into a two-dimensional plane. For clustering, we utilized the k-means algorithm and set the number of clusters to 14. Figure 2 shows the anomaly score distribution of the generated averaged behavior vectors, and Figure 3 shows the results of clustering and color-coding each action sequence. From Figure 2, it is evident that data with high anomaly scores are densely concentrated at the edge of the feature space, forming an independent region. Correlating this region with the clustering results in Figure 3 revealed that it corresponds to a specific cluster primarily consisting of actions like OPEN (opening materials) and CLOSE (closing materials), accompanied by a low total number of actions. This indicates behaviors where the student immediately exited without reading the content after accessing the system. Furthermore, because these sequences lack the context of page transitions commonly seen among most students, they are isolated in the feature space and are thus considered to have been classified as anomalous. In contrast, the region corresponding to normal data was confirmed to represent typical learning behavior sequences characterized by a high number of actions and frequent page transitions, predominantly NEXT. Here, to confirm the effectiveness of the IDF weighting described in Section 4.3, we compare our findings with the clustering results of the baseline (Figure 4). As shown in Figure 4, in the baseline, sequences primarily consisting of OPEN and CLOSE are mixed within the same cluster, grouped together simply as the opening and closing of materials. In contrast, in the proposed method (Figure 3), these are placed in distinct clusters, indicating that the differences between each operation are captured more clearly.
5.2 Comparison of Operations between Anomalous and Normal Data
To clarify the specific breakdown of anomalous behaviors, we compared the constituent operations and total action counts of the top 5 anomaly sequences and the sequences with the lowest 5 anomaly scores (Table 3). The top 5 sequences exhibited an extremely low number of operations; while OPEN occurred 3 times and CLOSE 4 times, the primary page transition operations NEXT and PREV occurred only 1 and 0 times, respectively. This indicates instances of closing materials without reading or sessions ending immediately, demonstrating that the sheer lack of learning behavior is successfully detected as anomalous. On the other hand, the sequences with the lowest 5 anomaly scores involved over 800 total operations, with NEXT (601 times) and PREV (206 times) accounting for the vast majority. The ratio of NEXT to PREV is approximately 3:1, suggesting a steady learning pattern of advancing through the material and occasionally returning to review. Stable learning sessions are also evident, with OPEN and CLOSE occurring more than 10 times each. These results demonstrate that the proposed method distinguishes sequences based not merely on quantitative differences, but structurally on the presence or absence of continuous learning behaviors involving NEXT and PREV.
| OPEN | CLOSE | NEXT | PREV | |
|---|---|---|---|---|
| Top 5 anomalies | 3 | 4 | 1 | 0 |
| Lowest 5 anomaly scores | 14 | 10 | 601 | 206 |
5.3 Analysis of High-Performing Students in the Abnormal Group
As shown in the previous sections, the majority of anomalous behaviors consist of immediate exits. However, among the A-grade data classified as anomalous, there are exceptional cases featuring a high number of operations. To elucidate this specificity, we extracted the operational breakdowns of A-grade students who recorded 100 or more operations (Table 4). Table 4 reveals that these are distinct learning behaviors entirely different from simple exits. A specific student (ID: D-2022_U89) stood out with 23 material openings and closings and 303 page transitions, strongly suggesting comparative learning by frequently navigating back and forth between multiple materials. The other three students demonstrated a high frequency of operations related to markers and memos relative to their page transitions, indicating a meticulous study style of remaining on specific pages to organize important sections. While normal data is predominantly characterized by continuous page transitions, these anomalous instances represent behaviors distinct from standard browsing, such as the concurrent study of multiple materials and the extensive marking or note-taking of critical sections. Here, when compared with the baseline detection results, it is evident that the proposed method captures more of these distinctive behaviors of high-performing students. Specifically, while the baseline detected only two of these students (D-2022_U89 and D-2022_U68), the proposed method successfully detected all four, including those utilizing markers and memos (D-2022_U14 and D-2022_U47). This outcome proves that the proposed method can detect not only a simple lack of learning but also the advanced learning behaviors adopted by high-performing students.
| Student ID | Open/Close | Page Transition | Marker | Bookmark | Memo | Handwritten Memo | Total | Baseline | Proposed |
|---|---|---|---|---|---|---|---|---|---|
| D-2022_U89 | 23 | 303 | 0 | 0 | 0 | 0 | 326 | ✓ | ✓ |
| D-2022_U68 | 7 | 46 | 84 | 5 | 23 | 1 | 166 | ✓ | ✓ |
| D-2022_U14 | 2 | 44 | 62 | 0 | 5 | 0 | 113 | – | ✓ |
| D-2022_U47 | 2 | 35 | 70 | 0 | 0 | 0 | 107 | – | ✓ |
6. CONCLUSION
In this study, we proposed and evaluated an unsupervised framework for anomalous behavior detection using context-aware behavioral features and an Isolation Forest. Experimental results demonstrated that anomalous data frequently lacked context due to immediate exits and contained a high percentage of F and D grades, whereas normal data involved continuous page transitions and contained a high percentage of A grades. Detailed analysis suggested that continuous learning actions involving page transitions, the concurrent study of multiple materials, and the marking or note-taking of important sections are advanced behaviors that contribute to academic improvement. Future research will focus on developing more sophisticated anomaly detection methods by incorporating temporal information, such as page stay time, to capture qualitative differences in browsing behavior.
7. ACKNOWLEDGEMENTS
This work was supported by JST CREST Grant Number JPMJCR22D1, Japan.
8. REFERENCES
- Y. Choi, Y. Lee, J. Cho, J. Baek, B. Kim, Y. Cha, D. Shin, C. Bae, and J. Heo. Towards an appropriate query, key, and value computation for knowledge tracing. CoRR, abs/2002.07033, 2020.
- J. Devlin, M. Chang, K. Lee, and K. Toutanova. BERT: pre-training of deep bidirectional transformers for language understanding. CoRR, abs/1810.04805, 2018.
- B. Flanagan and H. Ogata. Learning analytics platform in higher education in japan. Knowledge Management & E-Learning: An International Journal, 10(4):469–484, 2018.
- L. Jiang and N. Bosch. Mining and assessing anomalies in students’ online learning activities with self-supervised machine learning. In Proceedings of the 15th International Conference on Educational Data Mining (EDM), pages 549–554, 2022.
- H. Kohama, Y. Ban, T. Hirakawa, T. Yamashita, H. Fujiyoshi, A. Itai, and H. Usami. Recommending learning actions using neural network. In Proceedings of the 31st International Conference on Computers in Education (ICCE), 2023.
- F. T. Liu, K. M. Ting, and Z.-H. Zhou. Isolation forest. In IEEE International Conference on Data Mining (ICDM), pages 413–422, 2008.
- H. Ogata, C. Yin, M. Oi, F. Okubo, A. Shimada, K. Kojima, and M. Yamada. E-book-based learning analytics in university education. In Proceedings of the 23rd International Conference on Computers in Education, ICCE 2015, pages 401–406. Asia-Pacific Society for Computers in Education, 2015.
- S. Pandey and G. Karypis. A self-attentive model for knowledge tracing. CoRR, abs/1907.06837, 2019.
- A. Vaswani, N. Shazeer, N. Parmar, J. Uszkoreit, L. Jones, A. N. Gomez, Ł. Kaiser, and I. Polosukhin. Attention is all you need. In Advances in Neural Information Processing Systems (NeurIPS), 2017.
© 2026 Copyright is held by the author(s). This work is distributed under the Creative Commons Attribution-NonCommercial-NoDerivatives 4.0 International (CC BY-NC-ND 4.0) license.