ABSTRACT
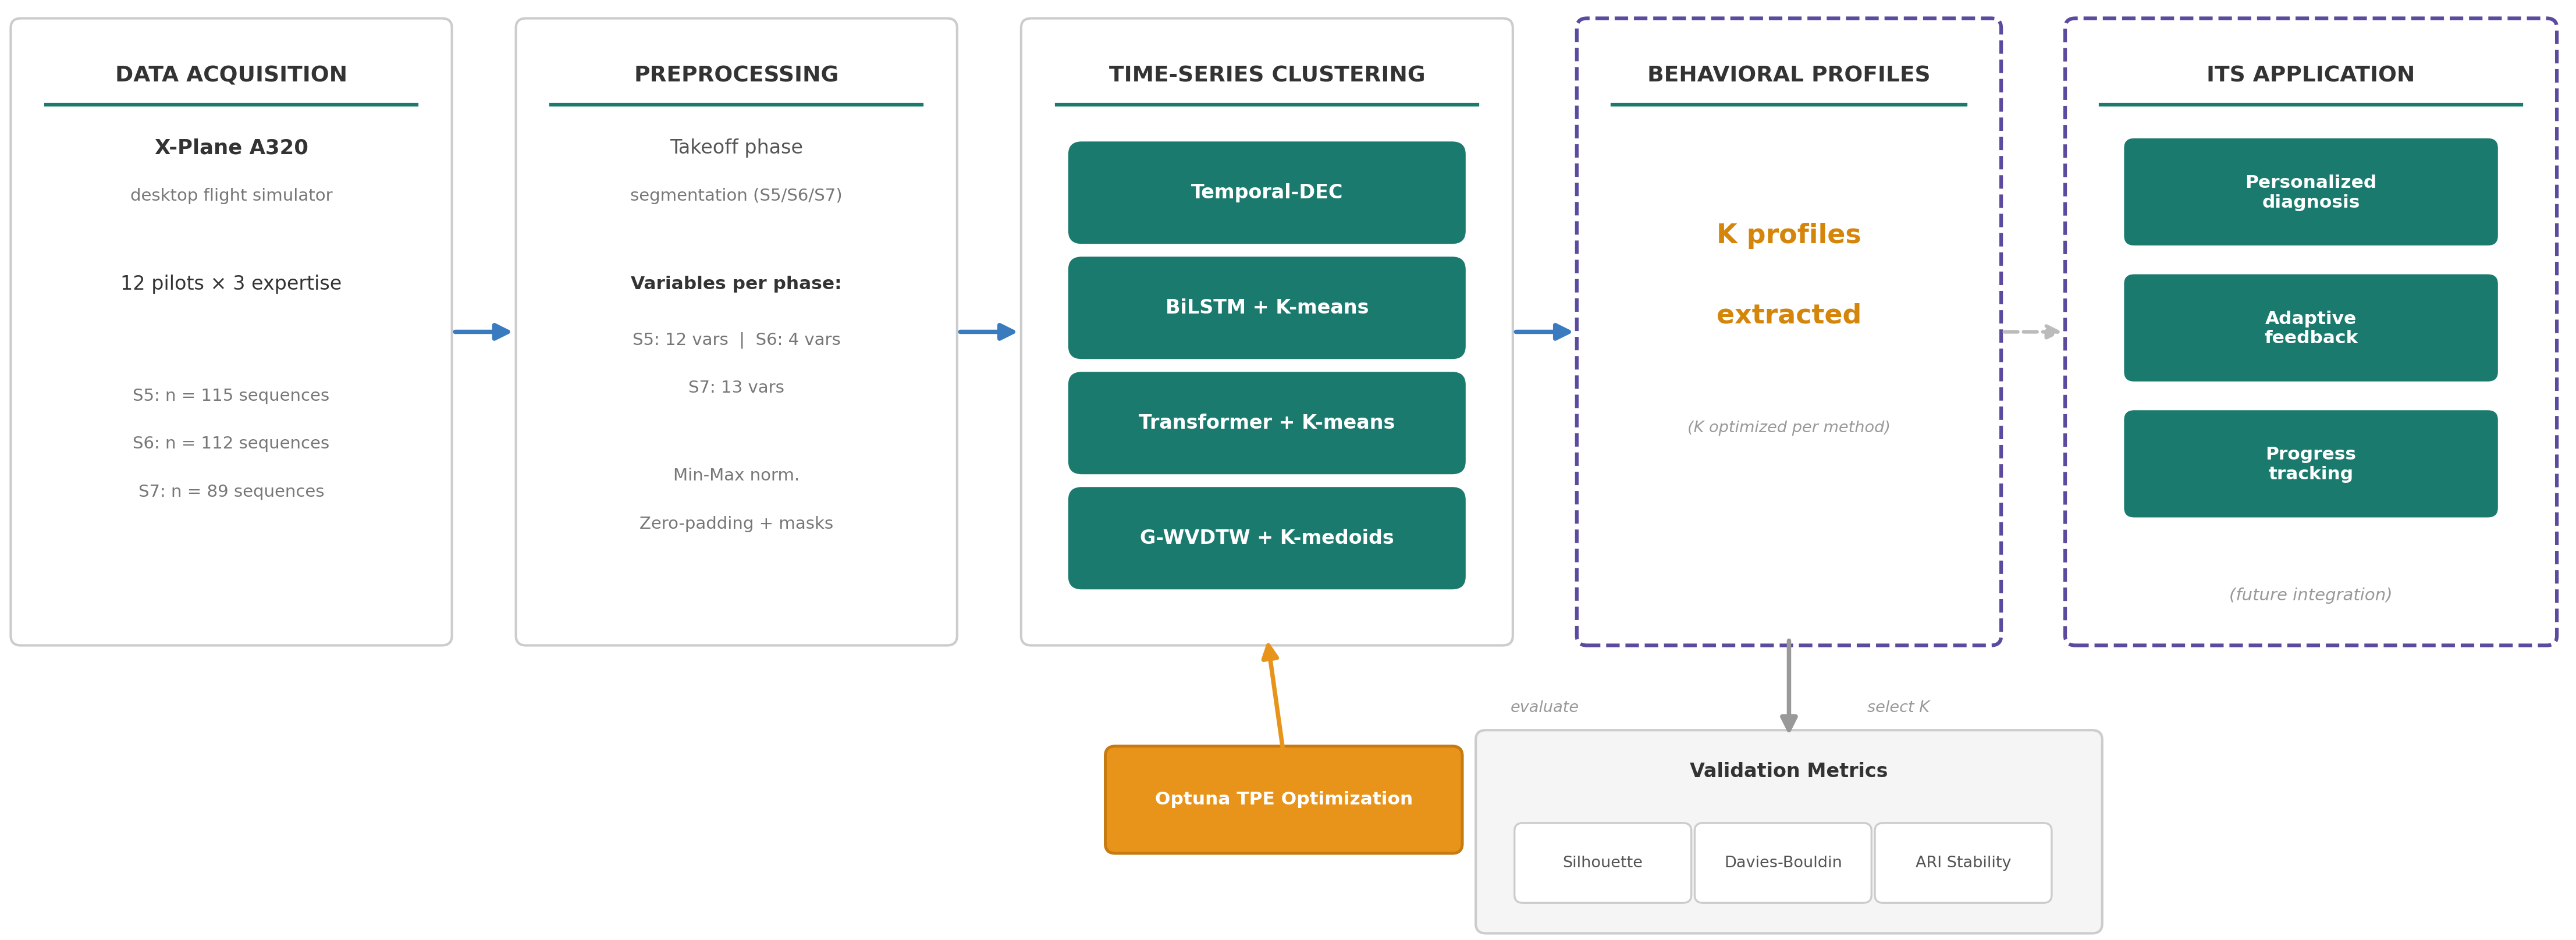
Characterizing pilot behavior during takeoff is a prerequisite for enabling adaptive interventions in aviation Intelligent Tutoring Systems (ITS). Traditional High-Gain/Low-Gain dichotomies are insufficient to capture the behavioral diversity required for fine-grained learner modeling. This paper presents an unsupervised learning pipeline applied to multivariate time-series data collected from 12 pilots performing A320 takeoffs in X-Plane, resulting in a dataset of 112 rotation sequences. Four temporal clustering methods are evaluated during the rotation phase (S6): G-WVDTW, Temporal-DEC, BiLSTM Autoencoder, and Transformer. The two best-performing methods are subsequently validated on the ground roll (S5) and initial climb (S7) phases. On S6, the BiLSTM suggests five algorithmically-derived behavioral groupings extending beyond the binary paradigm, while the Transformer yields a duration-based separation. Cross-phase validation further indicates that rotation phase is the only segment that provides sufficiently rich and exploitable behavioral diversity for learner profiling, supporting a phase-specific rather than phase-agnostic approach to takeoff profiling.
Keywords
1. INTRODUCTION
Intelligent Tutoring Systems (ITS) for aviation training require fine-grained learner models to provide personalized feedback. However, existing characterizations of pilot control behavior are still largely based on the traditional High-Gain/Low-Gain dichotomy [8]. This binary framework, originally derived from linear control theory, is insufficient to represent behavioral diversity observed in real flight data. Although the takeoff phase represents only about 2% of total flight time, it accounts for roughly 13% of fatal accidents worldwide [2], making it a priority phase for adaptive training interventions.
Prior work on data-driven pilot profiling has explored clustering of flight recorder data for anomaly detection [7] and non-parametric classification of pilot styles [5]. More directly relevant to ITS, Tato et al. [11, 12] demonstrated that unsupervised methods can extract behavioral profiles from simulator data to support adaptive coaching. However, these studies were limited to one or two clustering methods and did not systematically compare deep temporal architectures, nor evaluate the sensitivity of profile extraction to takeoff phase selection.
This paper addresses these gaps with three methodological contributions: (1) a systematic comparison of four temporal clustering paradigms on 112 A320 rotation sequences from 12 pilots with varying expertise; (2) a cross-phase validation on the ground roll (S5) and initial climb (S7) confirming that behavioral diversity is phase-dependent; (3) an analysis of the inductive biases of BiLSTM and Transformer autoencoders, with a discussion of their respective relevance for future learner modeling in ITS. By bridging temporal machine learning, human factors in aviation, and adaptive educational systems, this work contributes to the interdisciplinary foundations of data-driven learner modeling.
2. DATA AND PREPROCESSING
2.1 Experimental Context
Data were collected using the X-Plane desktop flight simulator configured for an Airbus A320 under standard conditions. Twelve pilots across three expertise levels (5 experts, 3 licensed, 4 novices) performed multiple takeoffs, yielding 115 sequences for the ground roll (S5), 112 for the rotation (S6), and 89 for the initial climb (S7) after quality filtering. Input variables were selected per phase to reflect the degrees of freedom available to the pilot, ranging from 4 variables for the highly constrained rotation phase (S6) to 12 for the ground roll (S5) and 13 for the initial climb (S7).
2.2 Preprocessing Pipeline
For the rotation phase (S6), sequence lengths range from 18 to 81 timesteps (mean \(= 35.4\), std \(= 10.3\)). Min-Max normalization to \([0,1]\) was applied to the training set. Variable-length sequences were zero-padded to the per-phase maximum length (\(T_{\max } = 81\) for S6) with binary masks to prevent gradient contributions from padded timesteps. The dataset was split 80/20 stratified by pilot identity (seed \(= 42\)) to avoid data leakage across sequences from the same pilot.
2.3 Evaluation Metrics
In the absence of ground-truth behavioral labels, clustering quality is assessed through three internal metrics and one stability measure. The Silhouette score [6] \(S \in [-1, 1]\) measures the ratio of intra-cluster cohesion to inter-cluster separation; values above 0.5 indicate reasonable structure. The Davies-Bouldin index (DB) [4] penalizes clusters that are dispersed or poorly separated; lower is better, with DB \(< 1.0\) considered satisfactory. The Adjusted Rand Index (ARI) measures assignment consistency across 50 independent runs with random initializations; ARI \(\geq 0.8\) indicates high reproducibility. The optimal number of clusters \(K\) is selected by maximizing the Silhouette score over \(K \in \{2, \ldots , 7\}\).
These internal metrics assess the geometric quality of the partitions in latent space. They do not, by themselves, establish that the discovered groupings are educationally meaningful or instructionally actionable; such validation requires future expert review and integration into an ITS prototype.
3. METHODS
Four temporal clustering methods are evaluated, spanning three paradigms: distance-based, end-to-end deep, and modular deep. We use the term cluster for algorithmically-derived groupings and profile for their behavioral interpretation.
3.1 G-WVDTW + K-medoids
A distance-based approach using variance-weighted Dynamic Time Warping [3] to compute pairwise sequence dissimilarities across variables, with weights inversely proportional to per-variable variance. K-medoids clustering is then applied on the resulting \(n \times n\) distance matrix. K-medoids was preferred over hierarchical or spectral alternatives for its native compatibility with arbitrary precomputed distance matrices, its robustness to outliers, and the interpretability of medoids as actual representative sequences — a property useful for downstream domain expert review.
3.2 Temporal-DEC
An end-to-end deep clustering framework adapting the Deep Embedded Clustering objective [16] to time series via a BiLSTM encoder. Representation learning and cluster assignment are jointly optimized by minimizing a combined reconstruction and KL-divergence loss.
3.3 BiLSTM Autoencoder + K-means
A modular pipeline separating representation learning from clustering [10]. A bidirectional LSTM autoencoder with temporal attention compresses each sequence into a fixed-size latent vector; K-means is then applied in the latent space. The bidirectional architecture captures both anticipatory and reactive control patterns.
3.4 Transformer + K-means
A modular pipeline replacing the recurrent encoder with a Transformer architecture [15] using sinusoidal positional encoding. The encoder projects input sequences through multi-head self-attention blocks into a latent vector; K-means is applied in latent space. Hyperparameters for the three deep methods were optimized with Optuna [1] (30 trials) using a composite objective balancing ARI stability, Silhouette, and Davies-Bouldin.
4. RESULTS
4.1 Rotation Phase (S6)
Table 1 reports clustering performance across the four methods on the 112 rotation sequences. Modular deep approaches outperform both G-WVDTW and Temporal-DEC on all metrics. G-WVDTW yields a weak Silhouette (0.383) and insufficient stability (ARI \(= 0.866\)). Temporal-DEC achieves intermediate results but remains below modular approaches in cluster separation. Following the interpretation scale of [6], BiLSTM (\(S = 0.608\)) and Transformer (\(S = 0.647\)) both fall in the “reasonable structure” range (\(0.51\)–\(0.70\)).
| Method | K | Sil. \(\uparrow \) | DB \(\downarrow \) | ARI |
|---|---|---|---|---|
| G-WVDTW + K-medoids | 2 | 0.383 | 0.990 | 0.866 |
| Temporal-DEC | 3 | 0.530 | 0.562 | 1.000 |
| BiLSTM + K-means | 5 | 0.608 | 0.452 | 0.998 |
| Transformer + K-means | 2 | 0.647 | 0.469 | 1.000 |
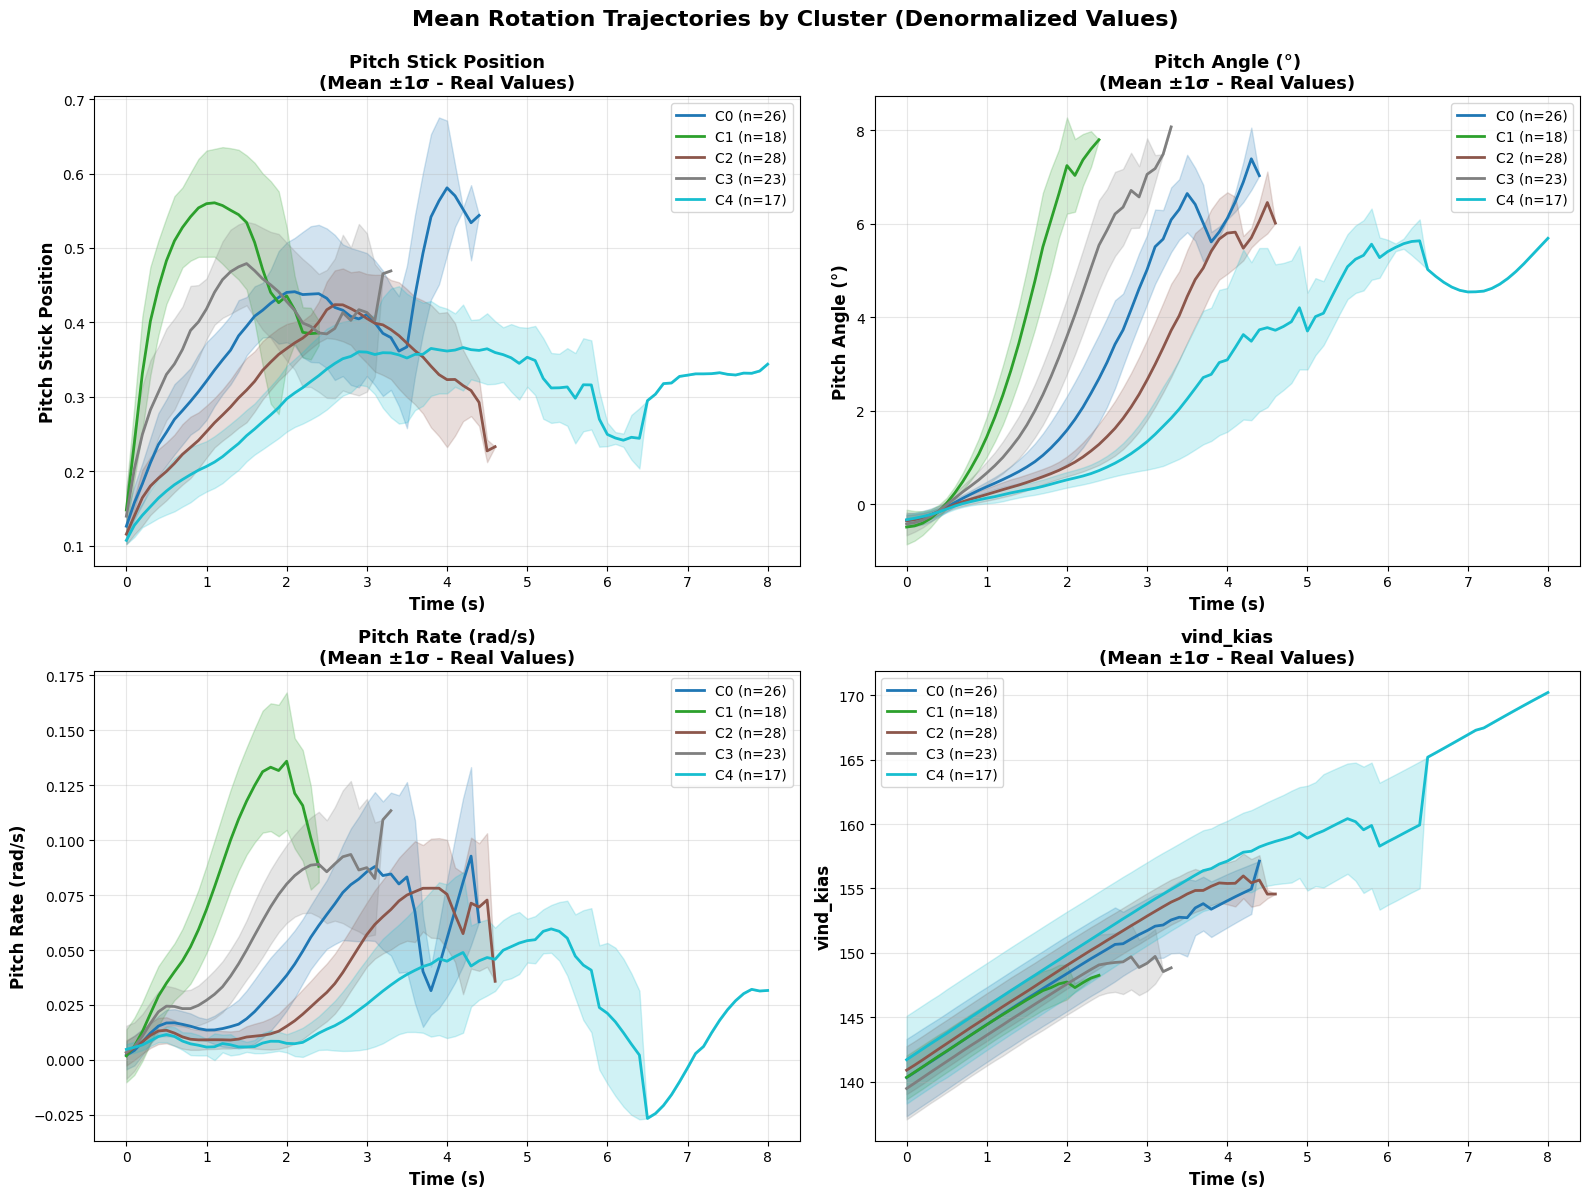
The BiLSTM Silhouette is maximized at \(K=2\); however, \(K=5\) is retained as the optimal compromise: it maintains a reasonable Silhouette (\(S=0.608\)) while achieving the lowest Davies-Bouldin index across all tested values of \(K\) (DB \(= 0.452\)), indicating compact and well-separated clusters. This \(K=5\) solution suggests five algorithmically-derived behavioral groupings distinguished by dynamic profile shape: a progressive profile (C0, \(n=26\)), high-gain inputs (C1, \(n=18\)), delayed pitch-up onset (C2, \(n=28\)), oscillatory corrections (C3, \(n=23\)), and low-gain inputs (C4, \(n=17\)). C1 and C4 appear consistent with the High-Gain and Low-Gain categories described in the literature [8]; C0, C2, and C3 suggest intermediate profiles extending beyond the binary paradigm. These labels are assigned post-hoc by visual inspection. A preliminary review by a domain expert confirmed the operational coherence of the five groupings given the available data, though this does not constitute a systematic validation of their educational or instructional significance.
To better characterize the structure of the discovered profiles, we further examined their distribution across pilots and expertise levels. The resulting patterns indicate that the five clusters are shared across the cohort rather than being confined to isolated individuals. The pilot-by-cluster matrix nonetheless reveals mild pilot-specific tendencies in a few clusters, such as a relative concentration of P13 and P7 in C2 and of P11 in C4. These patterns should be interpreted as partial skews within a broader multi-pilot distribution rather than as exclusive cluster ownership, while the expertise distribution confirms that experts and novices contribute to each cluster to varying degrees.
Figure 2 illustrates the dynamic shape differences underlying these post-hoc labels. C1 exhibits the earliest and steepest pitch stick input, producing the fastest pitch rate and the shortest rotation, consistent with high-gain control. C4 displays the opposite pattern: low and delayed stick deflection, slow pitch rate, and the longest rotation, consistent with low-gain control. C2 shows a delayed onset of pitch-up despite eventually reaching comparable angles, while C3 combines an early stick input with intermediate dynamics. C0 occupies an intermediate position with a smooth, progressive trajectory. Across all clusters, vind_kias evolves nearly linearly, confirming that cluster separation is driven by control input dynamics rather than by airspeed differences.
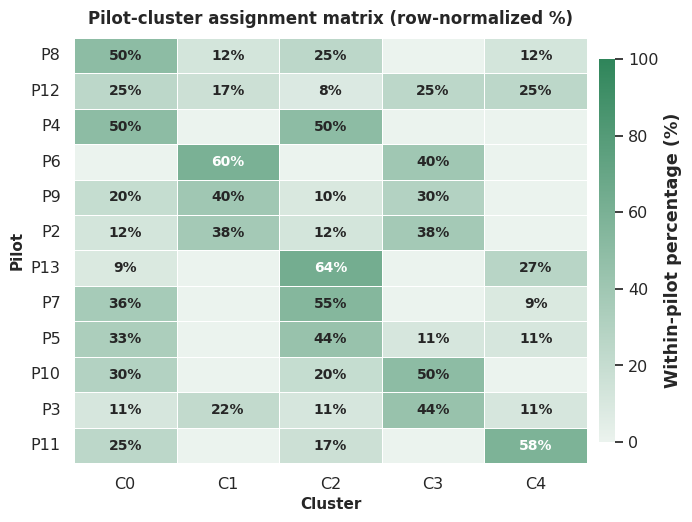
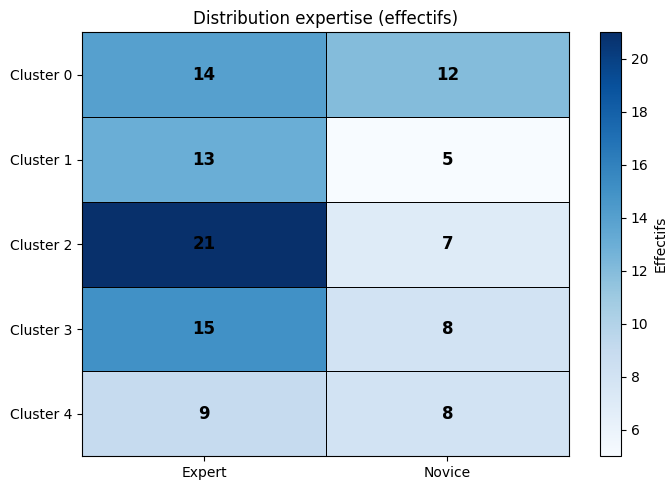
Figures 3 and 4 provide a finer-grained view of how the discovered clusters are distributed across pilots and expertise levels.
The Transformer (\(K=2\), \(S=0.647\), ARI \(=1.000\)) yields a different separation: the two clusters differ primarily in rotation duration rather than dynamic shape, consistent with the expected sensitivity of sinusoidal positional encoding to absolute sequence position. At \(K=5\), the Transformer produces a Silhouette of 0.603 but the five groups remain organized along a continuous duration gradient rather than exhibiting distinct behavioral modes.
Latent space analysis reveals that both architectures produce quasi-2D representations (PCA explains \(99.7\%\) and \(99.8\%\) of variance for BiLSTM and Transformer respectively), but with fundamentally different geometries: a V-shaped structure with discrete cluster positions for the BiLSTM (separation by dynamic shape), versus a continuous linear gradient for the Transformer (separation by duration). Expertise level does not drive cluster assignment in either model; experts, licensed pilots, and novices are distributed across clusters, though this observation should be interpreted cautiously given the small sample size (\(n=12\) pilots).
4.2 Cross-Phase Validation (S5, S7)
The two best-performing methods (BiLSTM and Transformer) were applied to S5 (115 sequences, 12 variables) and S7 (89 sequences, 13 variables) to assess whether behavioral diversity is phase-dependent. Results are reported in Table 2.
| Segment | Method | K | Sil. \(\uparrow \) | DB \(\downarrow \) | ARI |
|---|---|---|---|---|---|
| S5 (Ground Roll) | BiLSTM | 2 | 0.568 | 0.629 | 0.992 |
| Transformer | 2 | 0.381 | 1.017 | 1.000 | |
| S7 (Initial Climb) | BiLSTM | 2 | 0.587 | 0.473 | 0.989 |
| Transformer | 2 | 0.760 | 0.394 | 1.000 |
Both methods converge to \(K=2\) on S5 and S7. On S5, the BiLSTM suggests a 76.5%/23.5% split between standard and non-standard pitch input patterns, consistent with the constrained Airbus nose-down procedure between 80 and 100 KIAS. The Transformer yields a weaker separation (\(S=0.381\), DB \(>1.0\)), suggesting the duration-based bias is less discriminative on longer, higher-dimensional sequences. Neither method extracts exploitable stylistic diversity on S5.
On S7, the BiLSTM isolates a single atypical sequence (\(n=1/89\), 98.9% in the nominal cluster), indicating near-uniform behavior consistent with the highly standardized initial climb procedure (flight director, V2 + 10 KIAS, gear and flap retraction). The Transformer achieves the highest Silhouette across all segments (\(S=0.760\)), though driven by duration rather than behavioral content: the divergence between the two clusters appears only at the end of longer sequences, with no difference in pilot inputs in the early seconds. This confirms that on standardized phases, the Transformer transitions from behavioral profiling toward sequence-length anomaly detection.
These results confirm that behavioral diversity is phase-dependent: S5 and S7, being procedurally constrained, yield binary structures without stylistic diversity. Only S6 produces a rich multi-cluster structure (\(K=5\)) suitable for further investigation as candidate learner profiles.
5. DISCUSSION
5.1 Inductive Biases and Method Selection
The performance gap between modular deep methods and distance-based or end-to-end approaches suggests that separating representation learning from clustering appears advantageous on this small, high-dimensional flight dataset. G-WVDTW, despite its interpretable distance metric, suffers from the quadratic complexity of pairwise DTW computation and produces coarse separations. Temporal-DEC’s joint optimization may cause the clustering objective to interfere with representation quality on limited data.
The contrasting behaviors of BiLSTM and Transformer reveal complementary inductive biases. The BiLSTM accumulates sequential state across timesteps, naturally capturing local dynamic transitions such as pitch rate oscillations and anticipatory stick movements. The Transformer’s sinusoidal positional encoding embeds absolute temporal position into every representation, making sequence duration a primary discriminating factor. These biases are not defects but reflect different aspects of pilot behavior: the BiLSTM captures how the rotation is performed, while the Transformer captures how long it takes.
5.2 Relevance for Learner Modeling in ITS
The five BiLSTM groupings constitute candidate profiles whose operational coherence has been confirmed by a preliminary domain expert review [11, 12], suggesting they capture recognizable piloting patterns rather than statistical artifacts. Operational coherence does not, however, establish educational validity or instructional actionability. If validated against learning outcomes, such profiles could inform differentiated feedback strategies — for instance, exercises targeting smooth control for high-gain pilots or timing drills for delayed-onset patterns. The high clustering stability (ARI \(= 0.998\)) is a necessary but not sufficient prerequisite for consistent profile assignment.
The Transformer’s duration-based separation, while less suited to style profiling, could complement the BiLSTM perspective by monitoring rotation efficiency — a metric relevant to procedural compliance assessment.
Overall, this work provides a methodological foundation rather than a validated ITS component. The transition from coherent clusters to educationally actionable profiles requires systematic multi-assessor validation and integration into a tutoring loop with measurable learning outcomes.
5.3 Limitations
Several limitations warrant acknowledgment. First, the dataset comprises 12 pilots and at most 115 sequences, which is sufficient for a proof-of-concept but not for establishing a generalizable taxonomy [9]. Small-sample settings can amplify apparent structure and make estimates optimistic, so the observed patterns should be interpreted as methodological candidates rather than definitive learner categories [13, 14].
Overfitting risk on 112 rotation sequences is mitigated by three design choices: (i) purely reconstructive training without label supervision, (ii) constrained latent dimensionality (8–16 units) tuned via Optuna with dropout and weight decay, and (iii) clustering stability verified across 50 random initializations (ARI \(\geq 0.99\)). Latent representations may nonetheless encode pilot-specific idiosyncrasies, making the per-pilot distribution analysis (Figure 3) essential to interpret groupings as shared patterns rather than pilot signatures.
Other limitations include the use of a desktop simulator (simulator fidelity), post-hoc visual labeling validated by a single expert [11, 12], the inability of internal metrics to establish educational meaningfulness, and the restriction to the takeoff phase.
6. CONCLUSION
We presented an unsupervised pipeline for extracting candidate pilot behavioral profiles from multivariate flight simulator data, comparing four temporal clustering methods across three takeoff phases. On the rotation phase (S6), modular deep approaches outperform distance-based and end-to-end methods: the BiLSTM autoencoder suggests five behaviorally distinct groupings extending beyond the binary High-Gain/Low-Gain paradigm [8], while the Transformer yields a complementary duration-based separation. Cross-phase validation confirms that behavioral diversity is phase-dependent: only S6 produces a multi-cluster structure, while S5 and S7 converge to binary splits reflecting procedural constraints.
These results provide a methodological foundation for data-driven learner diagnosis in aviation ITS. The complementarity between BiLSTM (control style) and Transformer (temporal efficiency) perspectives suggests richer learner models combining both. Future work will focus on broader expert validation, larger pilot populations, and integration into an ITS prototype to assess profile-specific feedback effects on learning outcomes.
7. ACKNOWLEDGMENTS
This work is funded by CRIAQ (Consortium de Recherche et d’Innovation en Aérospatiale au Québec) and NSERC (Natural Sciences and Engineering Research Council of Canada). We gratefully acknowledge the financial and logistical support of our industry partners, Bombardier Inc, Beam me up Augmented Intelligence, and Cognitive Group. We also thank the members of the C-Pilot project for their valuable insights and contributions to this work.
8. REFERENCES
- T. Akiba, S. Sano, T. Yanase, T. Ohta, and M. Koyama. Optuna: A next-generation hyperparameter optimization framework. In Proceedings of the 25th ACM SIGKDD, pages 2623–2631, 2019.
- Boeing. Statistical summary of commercial jet airplane accidents, worldwide operations 1959–2022. Technical report, Boeing Commercial Airplanes, 2023.
- D. Cao, Z. Lin, D. Liu, and X. Chai. G-WVDTW: A generalised weighted variance dynamic time warping algorithm for subsequence matching in multivariate time series. Expert Systems, 42(5):e70036, 2025.
- D. Davies and D. Bouldin. A cluster separation measure. IEEE Transactions on Pattern Analysis and Machine Intelligence, PAMI-1(2):224–227, 1979.
- F. Garcia Lorca, S. Gururajan, and S. Belt. Characterization of pilot profiles through non-parametric classification of flight data. In AIAA Information Systems-AIAA Infotech @ Aerospace, page 0914, Grapevine, TX, 2017. AIAA.
- L. Kaufman and P. Rousseeuw. Finding Groups in Data: An Introduction to Cluster Analysis. John Wiley & Sons, 1990.
- L. Li, S. Das, R. John Hansman, R. Palacios, and A. Srivastava. Analysis of flight data using clustering techniques for detecting abnormal operations. Journal of Aerospace Information Systems, 12(9):587–598, 2015.
- D. McRuer and E. Krendel. Mathematical models of human pilot behavior. Technical Report AGARD-AG-188, AGARD, 1974.
- S. Raudys and A. Jain. Small sample size effects in statistical pattern recognition: Recommendations for practitioners. IEEE Transactions on Pattern Analysis and Machine Intelligence, 13(3):252–264, 1991.
- A. Sagheer and M. Kotb. Unsupervised pre-training of a deep LSTM-based stacked autoencoder for multivariate time series forecasting problems. Scientific Reports, 9(1):1–16, 2019.
- A. Tato, R. Nkambou, and G. Nana Tato. Towards adaptive coaching in piloting tasks: Learning pilots behavioral profiles from flight data. In International Conference on Intelligent Tutoring Systems, pages 105–114, Cham, 2022. Springer.
- A. Tato, R. Nkambou, and G. Nana Tato. Automatic learning of piloting behavior from flight data. In International Conference on Intelligent Tutoring Systems, volume 13891 of LNCS, pages 541–552, Cham, 2023. Springer.
- A. Vabalas, E. Gowen, E. Poliakoff, and A. Casson. Machine learning algorithm validation with a limited sample size. PLoS ONE, 14(11):e0224365, 2019.
- S. Varma and R. Simon. Bias in error estimation when using cross-validation for model selection. BMC Bioinformatics, 7(1):91, 2006.
- A. Vaswani, N. Shazeer, N. Parmar, J. Uszkoreit, L. Jones, A. Gomez, L. Kaiser, and I. Polosukhin. Attention is all you need. In Advances in Neural Information Processing Systems (NeurIPS), volume 30, pages 5998–6008, Long Beach, CA, 2017. Curran Associates.
- J. Xie, R. Girshick, and A. Farhadi. Unsupervised deep embedding for clustering analysis. In International Conference on Machine Learning (ICML), volume 48, pages 478–487. PMLR, 2016.
© 2026 Copyright is held by the author(s). This work is distributed under the Creative Commons Attribution-NonCommercial-NoDerivatives 4.0 International (CC BY-NC-ND 4.0) license.