ABSTRACT
This work-in-progress study asks whether fine-grained online quiz process data can explain exam performance in computer science courses. Using event logs from two courses, we aggregated quiz behavior for \(N=138\) student-exam observations and investigated whether browser focus-switching (“page blur”) and broader quiz-taking profiles added explanatory value beyond pre-semester GPA. We extracted ten behavioral features capturing blur frequency, timing, attempts, variability, and formative quiz performance, then applied random-forest feature ranking, hierarchical regression, and K-means clustering. Page blur frequency emerged as the strongest behavioral predictor and was found to be statistically significant in predicting summative exam performance beyond pre-semester GPA alone (\(p = 0.041\)). In contrast, interpretable behavioral clusters did not significantly improve model fit (\(p = 0.148\)). The results suggest that a specific attention-related process signal can be more informative than broader behavioral profiles, although its gain over an academic baseline is modest. These findings are used to motivate a future intervention in which page blur is embedded within a broader Effort-and-Engagement score is shared with students through personalized feedback.
Keywords
1. INTRODUCTION
Online quizzes are now routine in education but are often observed only through scores. In unproctored settings, that leaves instructors with little visibility into how students interact with an assessment and whether they persevere with a challenging problem, switch away to another resource, or engage in repeated practice. Learning analytics makes these behaviors visible through learning management system (LMS) process data, but it remains unclear which signals are genuinely useful for explaining later summative performance.
That question is especially important when quizzes function as low-stakes, frequent assessments rather than one-shot checkpoints. In that setting, quiz logs capture not only performance but repeated opportunities for practice, retakes, and feedback before a higher-stakes exam. This makes them a useful context for analytics intended to support students early, while there is still time for behavior change.
The work herein focuses on one concrete signal: browser focus loss during a quiz attempt, recorded as a “page blur.” We treat blur events as a low-cost, imperfect proxy for attention switching or external resource use. The study is also part of a broader work-in-progress effort to develop an Effort-and-Engagement (EE) score that combines quiz behaviors with other student-facing course indicators to support non-punitive, personalized feedback. Here, however, we narrow the contribution to two questions.
- RQ1: Does the frequency of browser focus-switching (“page blur” events) during quizzes predict final exam performance, after controlling for students’ baseline academic ability (GPA)?
- RQ2: Can unsupervised clustering of quiz behaviors (including timing, attempts, and blurs) identify distinct student profiles that explain performance differences better than GPA alone?
2. RELATED WORK
Process-data research shows that event logs can reveal strategies that are not visible in correctness-only measures [7, 8]. In LMS settings, log event features can predict achievement, but recent reviews emphasize that these gains depend heavily on feature engineering, context, and strong baseline comparison [1, 13]. Process-mining and formative-assessment studies have also shown that quiz behavior can be summarized into interpretable patterns or clusters [2, 4, 9].
Attention and multitasking research provides the conceptual motivation for using page blur as a signal. Attention can be inferred from interaction traces [18], off-screen exam behaviors can be detected through more intrusive sensing [5], and multitasking is often associated with poorer academic outcomes [10, 12, 17]. At the same time, window-switching behaviors are context dependent and should not be treated as a standalone cheating detector or risk label [14, 16]. This tension motivates our focus on whether a specific blur signal is more useful than broader behavioral profiling.
3. METHODS
We analyzed quiz logs from the Canvas LMS for two upper-division computer science courses offered during Fall 2025. To align quiz behavior with major assessments, we aggregated data over two eight-week windows. Namely, quizzes preceding the midterm and quizzes preceding the final. Because students could contribute to one or both windows, the final dataset contained \(N=138\) student-exam observations from roughly 70 students. The outcome variable was the corresponding exam grade, with pre-semester GPA serving as the academic baseline. Many quizzes included randomized Canvas “Formula” items, which reduced the value of answer memorization across attempts and made repeated attempts more interpretable as continued engagement with the procedure.
For each observation, we extracted ten quiz-level features describing blur frequency and change, time on task, timing variability, number of attempts, days of engagement, and formative quiz performance. We first trained a random forest model to identify the most salient behavioral predictors, then estimated hierarchical linear models to compare a GPA-only baseline with a GPA+blur model and a GPA+cluster model. For clustering, we tested \(K=2\) through \(K=5\) on the full behavioral feature set and retained \(K=3\) because it yielded the most interpretable profiles. We also used 5-fold cross-validation as a secondary comparison between blur-based and cluster-based predictive configurations. The extracted features were:
- avg_page_blurred_mean: average page-blur frequency per attempt
- avg_blurred_change_mean: average change in blur count across attempts
- avg_days_between_attempts_mean: average spacing between attempts
- avg_duration_mean: average attempt duration
- avg_duration_change_mean: average change in duration across attempts
- pct_correct_mean: mean highest formative quiz score
- std_duration_mean: within-quiz duration variability
- distinct_days_mean: average number of active quiz days
- std_page_blurred_mean: variability in blur frequency
- total_attempts_mean: average number of quiz attempts
Note that many of those features consist of a summary statistic, e.g. average, over all the attempts for one quiz. These are then averaged again over all of the quizzes in the time period using an arithmetic mean to yield one feature for each student-exam pair.
| Feature | Importance |
|---|---|
avg_page_blurred_mean | 0.155 |
avg_blurred_change_mean | 0.111 |
avg_days_between_attempts_mean | 0.077 |
avg_duration_mean | 0.069 |
avg_duration_change_mean | 0.067 |
4. RESULTS
The random-forest feature ranking identified GPA as the
strongest overall predictor, but page-blur measures emerged as
the most important behavioral features, with avg_page_blurred_mean and avg_blurred_change_mean
ranking above formative quiz performance. We therefore
centered the confirmatory models on avg_page_blurred_mean.
For RQ1, the GPA-only model explained 18.2% of the variance in exam grades (\(R^2 = 0.182\)). Adding average blur frequency increased \(R^2\) to 0.207, and the blur coefficient was negative and statistically significant (\(\beta = -0.512\), \(t = -2.063\), \(p = 0.041\)). The nested-model comparison was also significant (\(F_{1,135}=4.26\), \(p=0.041\)). In practical terms, students who switched away from the quiz window more frequently tended to perform worse on the associated summative exam, even after accounting for GPA.
For RQ2, K-means with \(K=3\) yielded interpretable profiles that we summarized as steady workers, high-effort retrying students, and low-effort/high-distraction students. However, adding these cluster labels to the GPA model did not significantly improve model fit (\(R^2 = 0.205\); \(F_{2,134}=1.94\), \(p=0.148\)). This same pattern appeared in cross-validation also, as seen in Table 2, where models using the continuous blur feature outperformed those using cluster labels. Together, these findings suggest that a granular, theoretically motivated attention signal carried more explanatory value than broader behavioral categories.
The three clusters were still descriptively useful. The “steady worker” profile paired longer, more focused attempts with strong quiz scores; the “high-effort retrying” profile showed repeated, shorter, focused attempts; and the “low-effort/high-distraction” profile combined fewer attempts with more blur events and weaker formative performance. These profiles suggest meaningful differences in quiz-taking strategy, even though they did not explain summative performance beyond GPA.
- Steady workers: longer attempts, moderate retake behavior, and relatively low blur frequency
- High-effort retrying students: more attempts spread across days, shorter attempts, and strong formative scores
- Low-effort/high-distraction students: fewer attempts, less distributed engagement, and the highest blur frequency
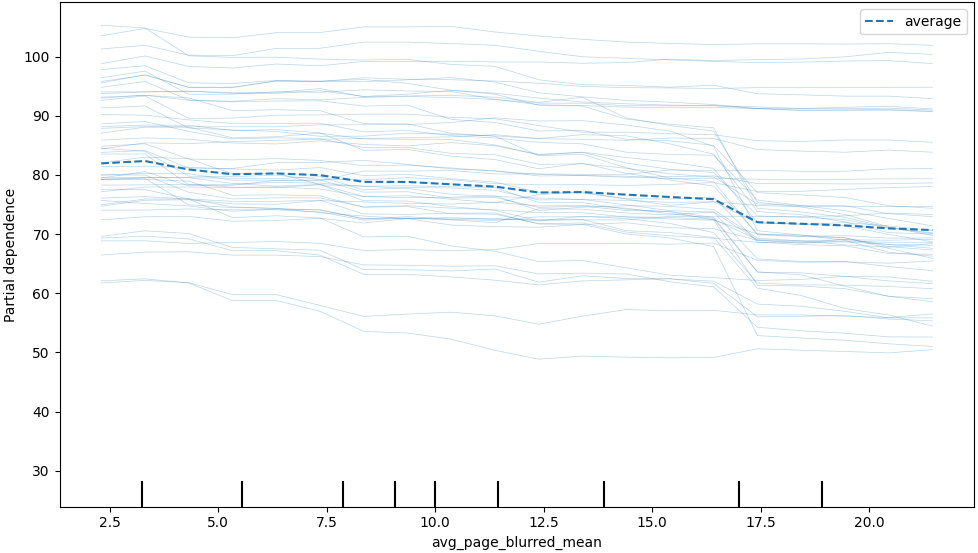
Table 2 shows the comparison of blur-based and cluster-based models using 5-fold cross-validation. The same pattern holds there, in which models using the continuous blur feature achieved lower error than those using cluster labels, with the random forest with GPA and blur performing best overall. Figure 1 presents the partial dependence and individual conditional expectation plot when average page blurs were used to directly predict exam performance.
| Model | RMSE |
|---|---|
| Random Forest (GPA + Blur) | 18.08 |
| Linear Regression (GPA + Blur) | 18.53 |
| Random Forest (GPA + Clusters) | 18.55 |
| Linear Regression (GPA + Clusters) | 18.71 |
5. DISCUSSION AND NEXT STEPS
The central finding is that granularity matters. Namely, that a specific, theoretically grounded signal tied to attention switching explained more than broad behavioral profiles. This does not mean that page blur should be treated as a direct proxy for cheating or disengagement. The gain beyond GPA was modest, and prior work shows that log metrics are highly context dependent [1, 14]. Still, blur frequency appears useful as a low-stakes risk signal when it is interpreted alongside other course behaviors rather than in isolation.
This is also why the clustering result remains useful, even though it was not significant in the regression model. The clusters helped describe different quiz-taking strategies in a way that may still matter for instructor insights and feedback. In other words, the profiles were descriptively interesting, but the blur metric was the sharper explanatory signal for this dataset. However, the implication should not be that blur events replace broader views of student engagement. But, instead, that they can add a specific attention-related signal that is easy to collect and interpret. In practice, this makes blur events more useful as one component of a larger engagement model than as a standalone indicator.
That framing directly informs our next step. We are using this result to design an Effort-and-Engagement (EE) score that combines page blur frequency with broader indicators such as attendance, assignment completion, quiz participation, and retakes. The aim is not high-stakes classification, but student-facing feedback that makes engagement patterns more visible and actionable. This direction is consistent with work on nudge analytics [3], student-facing dashboard feedback [6, 19], and personalized nudges [15]. In future work, we plan to evaluate whether periodic, supportive EE updates can shift quiz behavior, quiz-retake patterns, and student perceptions of support without becoming punitive or noisy. That future study will let us test whether a small but interpretable log-data signal can be translated into an actionable, student-facing intervention rather than remaining only a predictive model.
5.1 Limitations
Several limitations matter for interpreting the current result. First, this is an observational analysis from two upper-division computer science courses at a single institution. The dataset is adequate for this work-in-progress, but it is modest, and the student-exam structure means that some students contributed more than one observation across the two assessment windows. The findings should therefore be interpreted as evidence of a promising signal in a specific course context rather than as a general effect size for LMS quizzes.
Second, blur events are behaviorally ambiguous. A page blur can reflect off-task multitasking or answer-seeking, but it can also reflect note-checking, calculator use, accessibility needs, temporary interruptions, or ordinary course-related resource use. Our claim is deliberately narrower, which is that frequent focus-switching is associated with lower exam performance after controlling for GPA. We do not interpret blur as a direct measure of cheating, intent, or disengagement. That is also why we frame the signal as low stakes and combine it with other student-controllable behaviors in the planned intervention.
Third, the predictive gain is modest. GPA remained the strongest baseline predictor, and the increase in explanatory power from adding blur was meaningful but not large. For practice, that means the value of process data here is not that it unlocks a highly accurate predictive model. Its value is that it surfaces a concrete, interpretable behavior that instructors can discuss with students and potentially target through supportive feedback. That practical value is stronger in courses that already rely on low-stakes, frequent quizzes. Repeated formative assessments create multiple chances to practice, revisit material, and act on feedback, so they also create multiple opportunities for instructors to notice process patterns before a major exam. This is one reason the signal is more useful for early support than for high-stakes classification.
5.2 Intervention Design
The planned EE score aggregates five student-controllable
dimensions of course engagement:
1. Attendance: proportion of class sessions attended
2. Assignments: proportion of assignments turned in
3. Quiz attempts: proportion of available quizzes attempted
4. Quiz retakes: repeated engagement with formative quizzes
5. Page blur frequency: average focus-switching rate during
quiz attempts
The score is intended to surface interpretable components rather
than produce a single opaque risk label. The sample message
below illustrates the style of the planned feedback, which aims
to be supportive, behavior-focused, and framed around concrete
next steps, rather than to shame or punish.
| Attendance | 85% | |
|---|---|---|
| Assignments Submitted | 90% | |
| Quizzes Attempted | 100% | |
| Quiz Retakes | 40% | |
| Quiz Focus (blur rate) | 65% | |
| Overall EE Score | 71/100 | (class mean \(= 75\)) |
4pt You are doing well—you have attempted every quiz and your attendance is strong. Two areas to consider: you have retaken fewer quizzes than most of your peers, and your quiz focus score suggests you may be switching away from the quiz window frequently. Retaking quizzes can help you practice the process, and staying on-task can make that practice more valuable.
2pt Keep it up!
The design of these messages follows three principles from prior work. They should be 1) personalized to the student’s own data, 2) explanatory about which behaviors are driving the score, and 3) actionable in the next steps they recommend [6, 11, 19]. The LLM should itself be viewed as an auxiliary delivery mechanism for that feedback, rather than as the source of the intervention logic itself.
We envision these messages being delivered routinely, but are aware students may ignore them if frequency is too high. Ideally, the message supports reflection without becoming part of the grading environment. Each EE score component is transparent and controllable, allowing students to see if their score is affected by attendance, missing assignments, limited quiz participation, low retake behavior, or frequent focus-switching. This transparency is important as the intervention aims to prompt helpful self-regulation rather than create a vague sense of surveillance.
The next study will therefore focus less on prediction and more on response to feedback. We plan to examine whether supportive EE updates change behaviors that instructors actually want to influence, such as quiz completion, retake use, and sustained on-task engagement, and whether students perceive the messages as useful, fair, and non-punitive. That evaluation is necessary before any broader deployment, because even interpretable analytics can fail if the feedback they generate is mistimed, noisy, or too easy to misread.
6. CONCLUSION
The main contribution of this work has been to investigate several quiz-process indicators and has found that page blur frequency provides the clearest behavioral signal beyond GPA. While broader student profiles can be useful for classifying students broadly, their prediction capabilities are more limited. The combination of modest predictive value and high interpretability makes blur most promising as one component of a student-facing engagement intervention rather than as a standalone risk flag. Because the signal comes from low-stakes, frequent quizzes, it is also available early enough to inform supportive feedback before higher-stakes assessments occur.
7. ACKNOWLEDGEMENTS
This research was approved by, and conducted in compliance with, the Institutional Review Board (IRB) at Metropolitan State University of Denver. The authors would like to express their gratitude to the Human Subjects Protection Program for their guidance and support in ensuring the ethical integrity of this study. Anonymized data is available on request.
8. REFERENCES
- C. J. Arizmendi, M. L. Bernacki, M. Raković, R. D. Plumley, C. J. Urban, A. T. Panter, J. A. Greene, and K. M. Gates. Predicting student outcomes using digital logs of learning behaviors: Review, current standards, and suggestions for future work. Behavior Research Methods, 55(6):3026–3054, Aug. 2022.
- A. Bayazit, D. Yildirim, G. Akcapinar, and H. Ilgaz. Examining students’ formative test-taking behaviors using learning analytics. Eğitimde ve Psikolojide Ölçme ve Değerlendirme Dergisi, 14(Özel Sayı):382–395, Oct. 2023.
- C. Carmean and P. Mizzi. The case for nudge analytics. EDUCAUSE Quarterly, 33(4), 2010.
- R. Csányi and G. Molnár. How do test-takers rate their effort? a comparative analysis of self-report and log file data. Learning and Individual Differences, 106:102340, Aug. 2023.
- N. Dilini, A. Senaratne, T. Yasarathna, N. Warnajith, and L. Seneviratne. Cheating detection in browser-based online exams through eye gaze tracking. In 2021 6th International Conference on Information Technology Research (ICITR), pages 1–8. IEEE, Dec. 2021.
- J. Fritz. Classroom walls that talk: Using online course activity data of successful students to raise self-awareness of underperforming peers. The Internet and Higher Education, 14(2):89–97, Mar. 2011.
- Y. Han, F. Ji, P. Wang, and H. Liu. Assessing multiple abilities through process data in computer-based assessments: The multidimensional sequential response model (msrm). Behavior Research Methods, 57(5), Apr. 2025.
- H. Jiao, Q. He, and B. P. Veldkamp. Editorial: Process data in educational and psychological measurement. Frontiers in Psychology, 12, Dec. 2021.
- L. Juhaňák, J. Zounek, and L. Rohlíková. Using process mining to analyze students’ quiz-taking behavior patterns in a learning management system. Computers in Human Behavior, 92:496–506, Mar. 2019.
- R. Junco and S. R. Cotten. No a 4 u: The relationship between multitasking and academic performance. Computers & Education, 59(2):505–514, Sept. 2012.
- A. N. Kluger and A. DeNisi. The effects of feedback interventions on performance: A historical review, a meta-analysis, and a preliminary feedback intervention theory. Psychological Bulletin, 119(2):254–284, Mar. 1996.
- J. M. Kraushaar and D. C. Novak. Examining the affects of student multitasking with laptops during the lecture. Journal of Information Systems Education, 21(3):241–253, 2010.
- T. Lerche and E. Kiel. Predicting student achievement in learning management systems by log data analysis. Computers in Human Behavior, 89:367–372, Dec. 2018.
- S. Maloney, M. Axelsen, L. Galligan, J. Turner, P. Redmond, A. Brown, M. Basson, and J. Lawrence. Using lms log data to explore student engagement with coursework videos. Online Learning, 26(4), Dec. 2022.
- S. D. O’Connell and G. Lang. Can personalized nudges improve learning in hybrid classes? experimental evidence from an introductory undergraduate course. Journal of Research on Technology in Education, 50(2):105–119, Jan. 2018.
- M. A. Rasyadan Reza Putra and M. ER. Media multitasking – does what they say match the reality? a study of its impact on academic performance. In 2024 2nd International Symposium on Information Technology and Digital Innovation (ISITDI), pages 59–64. IEEE, July 2024.
- F. Sana, T. Weston, and N. J. Cepeda. Laptop multitasking hinders classroom learning for both users and nearby peers. Computers & Education, 62:24–31, Mar. 2013.
- V. Triglianos, C. Pautasso, A. Bozzon, and C. Hauff. Inferring student attention with ASQ. In Adaptive and Adaptable Learning, pages 306–320. Springer International Publishing, 2016.
- D. Wang and H. Han. Applying learning analytics dashboards based on process-oriented feedback to improve students’ learning effectiveness. Journal of Computer Assisted Learning, 37(2):487–499, 2021.
© 2026 Copyright is held by the author(s). This work is distributed under the Creative Commons Attribution-NonCommercial-NoDerivatives 4.0 International (CC BY-NC-ND 4.0) license.