ABSTRACT
Assessing foundational literacy at scale in low-resource settings is challenging due to the cost of assessor-led testing. Digital platforms offer a scalable alternative, but the performance of different item formats under unsupervised conditions, particularly for young learners, remains under-evidenced.
This paper analyses a large-scale deployment of digital assessments delivered through EIDU’s platform-based education programme in pre-primary classrooms in Kenya, comprising multiple-choice questions (MCQs) and very short answer questions (VSAQs). Across 230,000 learners and 1.8 million item responses, MCQs achieved significantly higher completion and scores than VSAQs, with item format explaining 31% of variance in completed-assessment scores. However, clustering incorrect VSAQ responses revealed highly structured patterns of partial knowledge, response-format confusion, and emerging phonics understanding that binary scoring entirely obscures.
Binary correctness scoring of both MCQs and VSAQs showed no significant association with an independent literacy assessment (IDELA; linked sample \(n=384\)), but classifying incorrect VSAQ responses by degree of understanding uncovered a significant directional signal, though whether this generalises beyond the small validation sample remains an open question. The results highlight a trade-off between MCQ engagement and the richer learner signal in VSAQ errors, motivating further validation of their diagnostic value.
Keywords
1. INTRODUCTION & MOTIVATION
It is widely recognised that foundational literacy and numeracy skills are essential predictors of future academic success [6, 22], therefore accurate assessment of these skills is essential. This is of particular importance to learners in low- and middle-income countries (LMICs), who consistently demonstrate substantial gaps in these critical areas. National assessments in a Sub-Saharan African country indicate that 60% of Grade 3 learners fail to achieve minimum proficiency levels in reading [29], compared to less than 10% in high income countries [13].
Many widely used child assessment instruments were developed and normed in high-income settings, raising concerns about contextual fit, feasibility, and interpretability when transferred to low-resource environments [8, 7, 14]. In response, LMIC-focused tools have emerged for early learning measurement, including population- and program-evaluation instruments such as IDELA [18] and MELQO [21], and foundational skill assessments such as the Early Grade Reading Assessment (EGRA) and Early Grade Mathematics Assessment (EGMA) [5, 23]. Both EGRA and EGMA have been widely adopted in low- and middle-income contexts for system diagnosis and program evaluation.
However, because these assessments are typically assessor-led, one-to-one, and time-intensive, they are logistically infeasible at scale, constraining their use for continuous learning measurement [3]. This has motivated the development of technology-mediated assessments, including tablet- and computer-based approaches that automate administration and reduce logistical burden [19, 15, 2].
While self-administered digital assessments such as SA-EGRA and SA-EGMA can align well with enumerator-led tools under supervision [26], evidence suggests that assessment validity depends strongly on task format. Although evidence on whether open-ended formats outperform MCQs is mixed [32], spelling tasks using very short answer questions (VSAQs), which require learners to actively type brief responses (e.g., a letter or short word), have shown stronger alignment with non-digital counterparts than MCQs, despite yielding lower raw scores [25]. This advantage is partly attributable to the ability to capture partial correctness, which carries meaningful signal about emerging literacy skills beyond binary scoring [24, 16]. However, given young children’s sensitivity to interaction design [4], it remains unclear whether these diagnostic benefits persist in fully unsupervised deployments—an important requirement for scalable assessment in low-resource contexts.
This uncertainty mirrors findings from a broader assessment literature showing that short-answer formats elicit deeper cognitive processing than MCQs, which primarily measure recognition and are more susceptible to guessing [1, 20]. VSAQs better reflect retrieval processes and reduce cueing bias; experimental evidence from digital platforms shows that fill-in questions can lead to better learning outcomes than MCQs through productive struggle, albeit at the cost of lower raw performance [10, 31, 9]. However, this evidence comes largely from older learners in higher-education settings with stable literacy and test familiarity. Whether VSAQs retain diagnostic value for young learners in unsupervised, low-income digital environments, where more difficult tasks increase the risk of disengagement, remains an open question.
This paper addresses this gap by examining how VSAQs function in a large-scale, unsupervised early-grade digital assessment deployment in low-resource settings. Analysis of item-level constructed responses beyond binary correctness reveals systematic patterns of partial knowledge and response-format confusion, which are aggregated into response-aware attempt-quality features. These features yield the only significant directional association with independent literacy outcomes in a linked validation sample, where binary-scored MCQs and VSAQs do not, though cross-validation was inconclusive at the available sample size. The results characterise a trade-off between the accessibility of MCQs and the diagnostic richness of VSAQs, and motivate further validation of richer scoring approaches for unsupervised early-grade assessment.
2. STUDY CONTEXT AND DEPLOYMENT
The analyses in this paper are drawn from EIDU, a large-scale platform-based education programme deployed in low-resource pre-primary and primary school settings. The platform delivers structured daily literacy and numeracy lesson plans aligned to local curricula through low-cost touchscreen Android phones and is used by teachers during regular classroom instruction. The system operates entirely offline, with content and learner interactions stored locally on the device.
Typically, each class has access to a single device. Teachers use the phone to guide lessons, after which it is shared among learners, who take turns interacting individually with the software to complete digital personalised learning (DPL) games without one-to-one adult supervision. Learners spend approximately five minutes each on literacy and numeracy activities daily, with all interaction data anonymised and collected for analysis. The platform is deployed at scale, reaching over 700,000 learners across multiple low- and middle-income countries in Sub-Saharan Africa; prior large-scale experimental work has shown that this delivery model substantially improves foundational literacy and numeracy outcomes over a one-year period [11].
Within the platform, short assessment units were embedded into learners’ individual sessions to measure progress against weekly literacy learning objectives. These assessments were delivered alongside DPL games, rather than as a distinct testing activity. As a result, learners were typically unaware that they were being assessed, and all assessment interactions occurred under the same unsupervised conditions as routine learning activities. This design reduces reactivity and testing effects, a persistent challenge in early childhood assessment, while enabling data collection at scale with minimal disruption to classroom routines.
2.1 Assessment Design
A literacy assessment unit was designed for each lesson week during the rollout, aligned to that week’s learning objective. Each unit comprised five items and used a single response format: either very short answer input via an on-screen keyboard (VSAQ) or multiple-choice selection (MCQ).
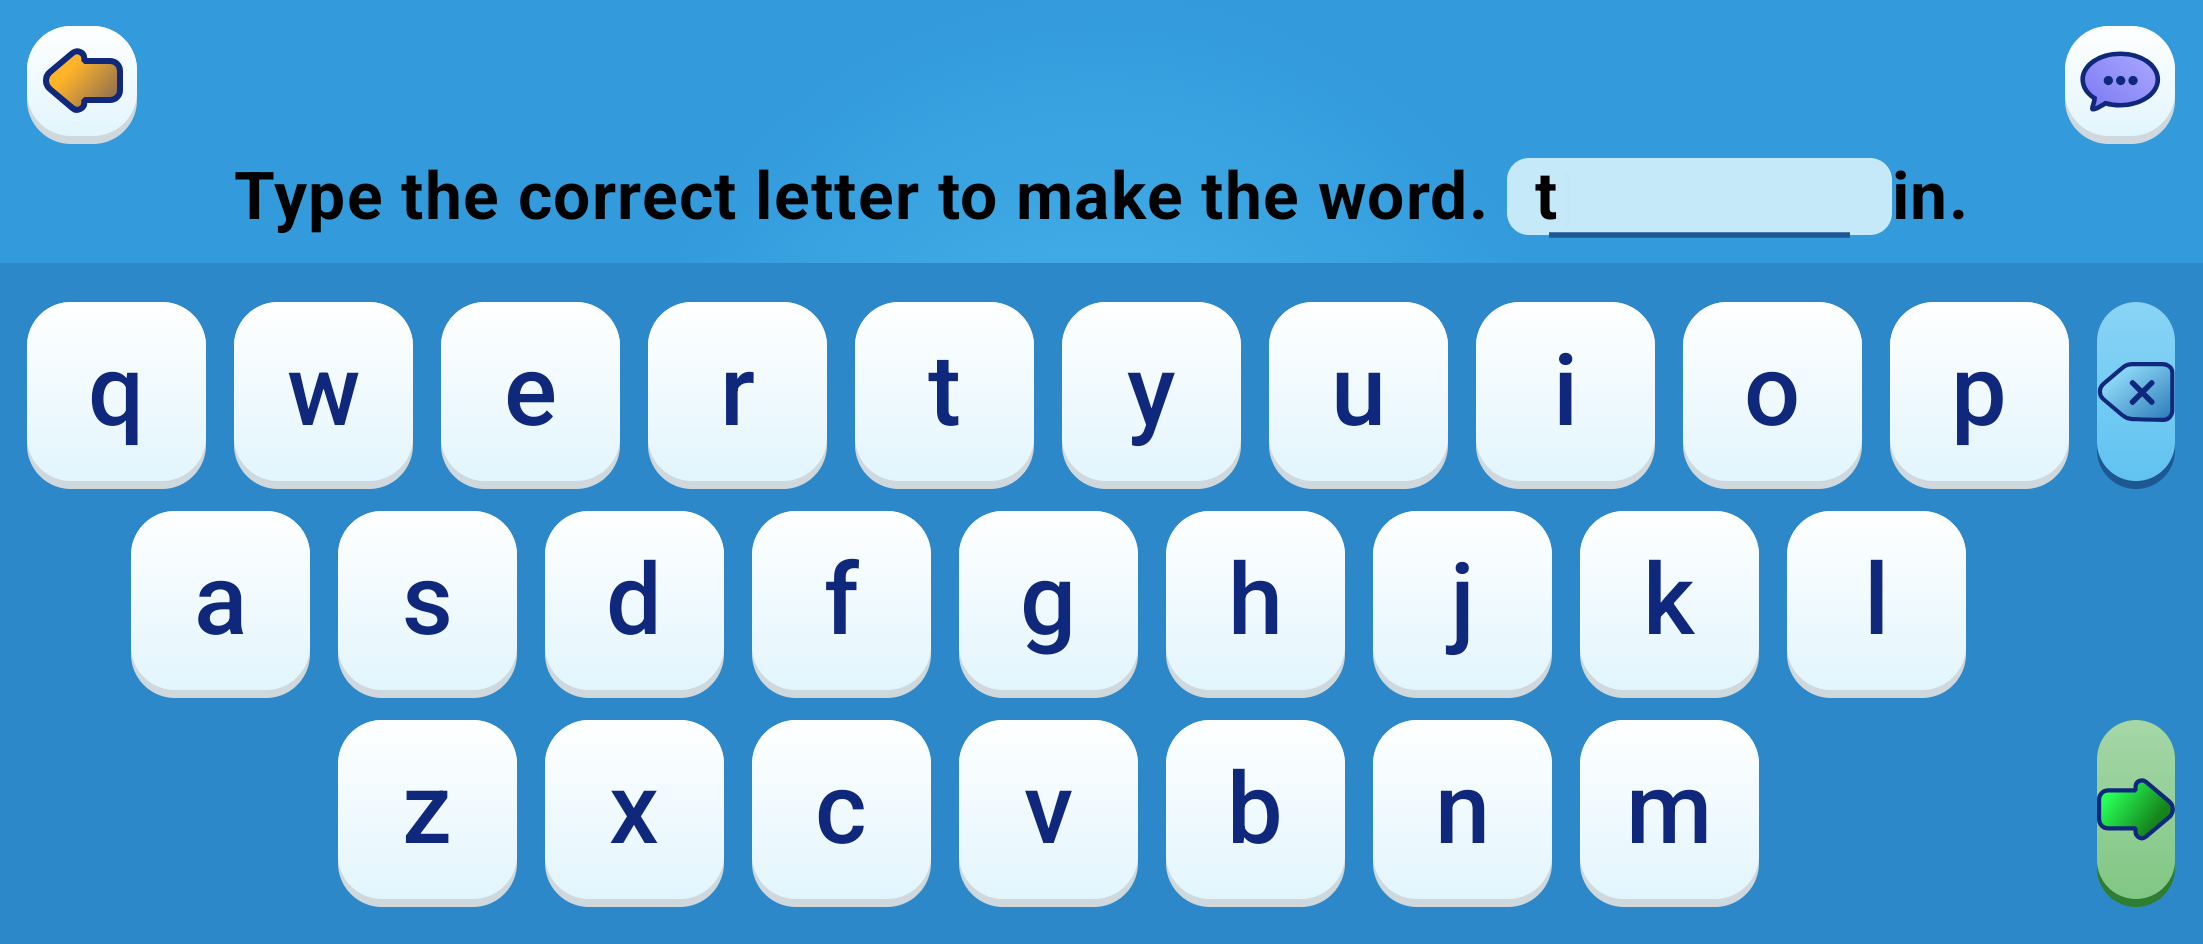
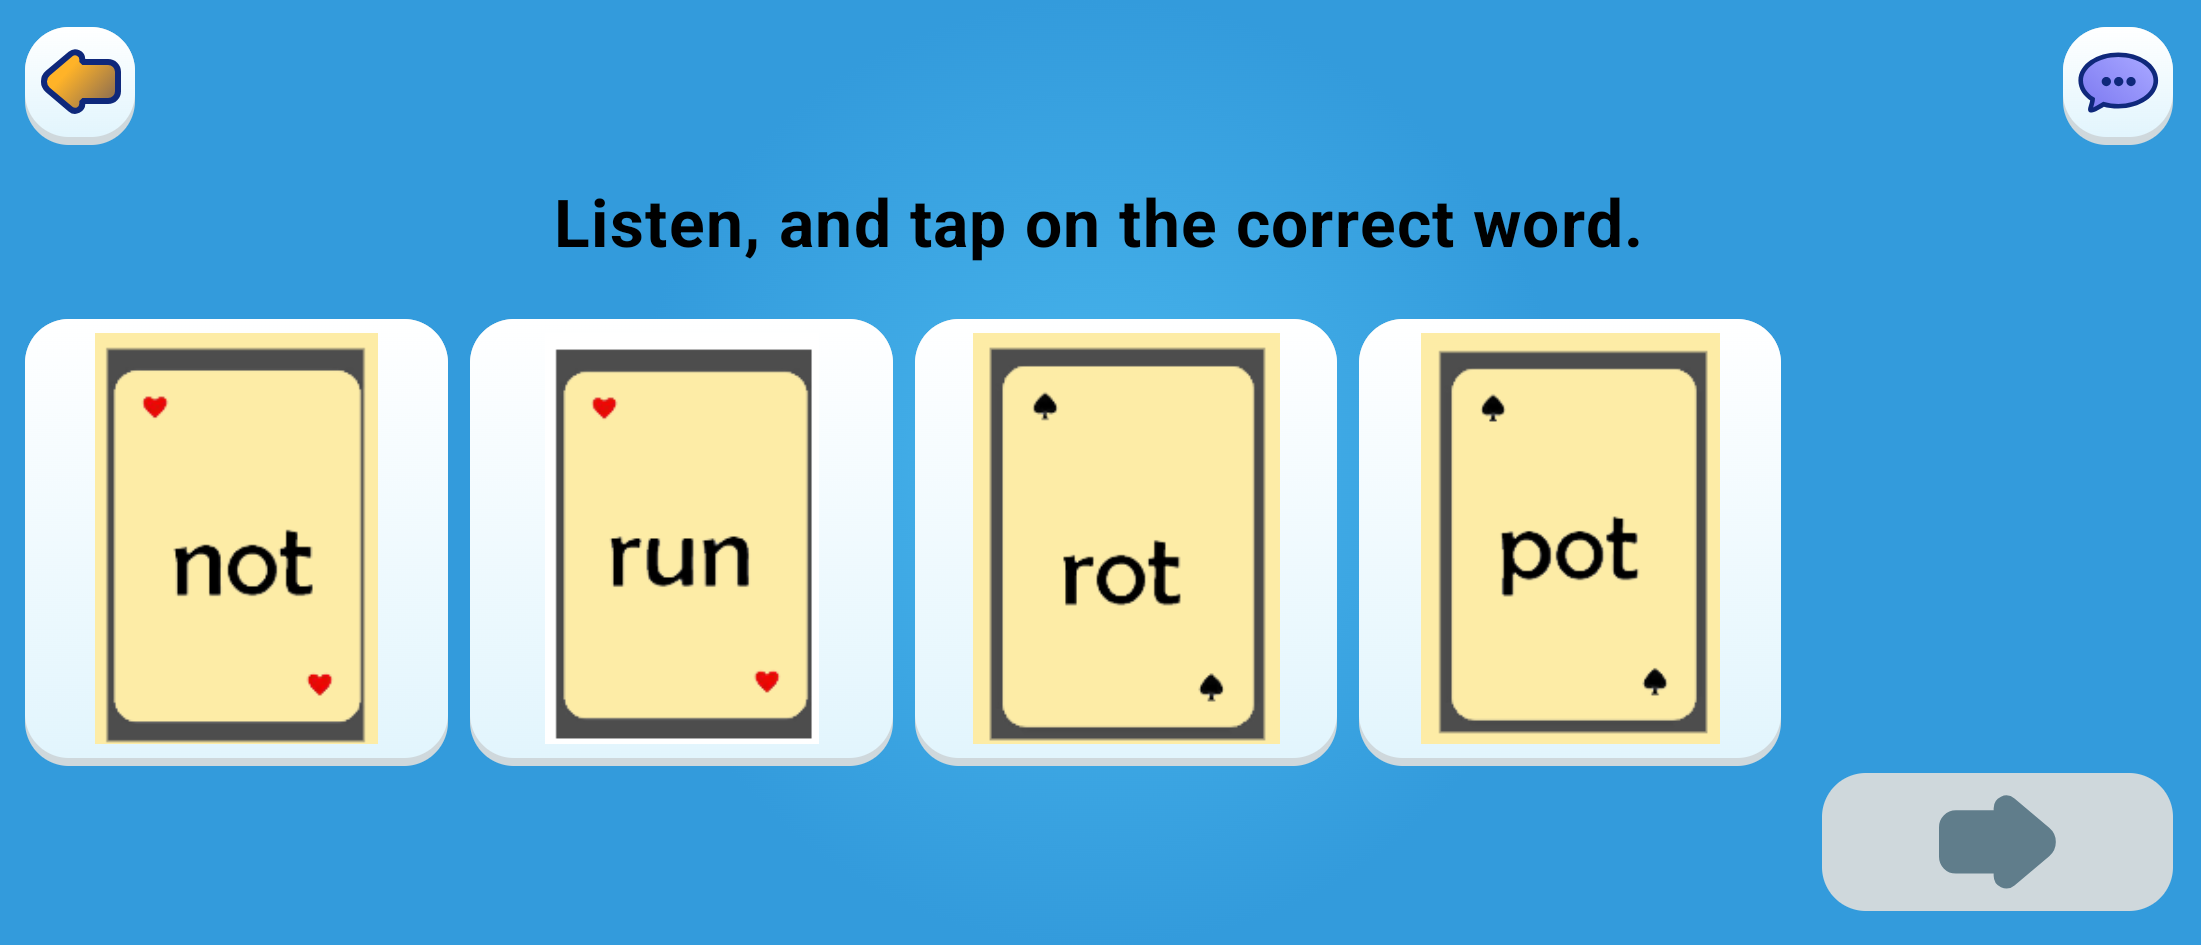
Three item types were used. Blending items (Week 1, 3, 6, and 8 assessments) required learners to identify the initial phoneme of a spoken three-letter word by typing the first letter (VSAQ; Figure 1). Word Spelling items (Weeks 4 and 5) required learners to type the full three-letter word after hearing the audio prompt (VSAQ). Word Recognition items (Weeks 2 and 7) required learners to select the written word matching the audio from four options (MCQ; Figure 2).
2.2 Serving and Interaction Conditions
Assessment units were unlocked once the teacher marked the fifth lesson of the corresponding week as complete, and served to each learner as the first unit in their next DPL session. Learners could exit units at any point, proceeding directly to standard DPL games.
All assessments were completed under unsupervised conditions. Teachers did not receive real-time feedback during assessment attempts, and learners received no guidance beyond the on-screen and audio instructions provided by the software. As a result, assessment outcomes reflect not only learners’ underlying knowledge, but also interaction behaviour, including misunderstanding of task requirements, typing errors, and other interface-related effects.
2.3 Study Sample and Data
The assessments were rolled out to Pre-Primary 2 (PP2) learners in Kenya, typically around five years old, over six weeks during the final term of the 2025 school year (September–October). Of approximately 420,000 PP2 learners active on the platform during the roll-out window, around 230,000 learners (55%) were served at least one assessment; the remaining learners were in classes that did not reach the lesson-completion thresholds required to unlock assessments. Across these learners, approximately 1.8 million item responses were collected, averaging 1.6 completed assessments per learner.
In addition to the digital assessment data, assessor-administered IDELA assessments were conducted in October 2025 with a randomly selected sample of PP2 learners across 60 schools in a single programme county. Of the 477 learners assessed, 384 also completed at least one digital assessment and are included in subsequent analyses. Mean IDELA literacy scores were similar for the full sample (63.9%) and the linked subsample (64.3%). IDELA is delivered orally in one-to-one settings and aggregates performance across foundational subtasks including letter–sound knowledge, print awareness, and expressive vocabulary, providing a holistic independent benchmark for early literacy.
3. METHODOLOGY
In the operational system, assessment items were scored using binary correctness, based on whether the learner’s response exactly matched the expected answer. For completed assessments, unit-level scores were computed as the average proportion of correct responses. The analysis proceeds in three stages:
- An initial descriptive analysis of assessment outcomes and raw responses.
- Item-level analysis and clustering of incorrect VSAQ inputs.
- Predictive modelling to evaluate how different representations of learner performance align with external outcomes.
The descriptive findings from Stage (1) are reported in the Results section; this section describes the response processing and feature construction steps used in Stages (2) and (3).
3.1 Response Processing
While the operational system scored items as binary correct or incorrect, prior research shows that partially correct constructed responses can contain meaningful learning signal beyond correctness alone [28, 17, 27]. To capture this signal, incorrect VSAQ responses were examined to identify systematic patterns in learner input.
Unique incorrect response strings were grouped using hierarchical agglomerative clustering over character n-gram Term Frequency-Inverse Document Frequency (TF-IDF) representations, with a distance threshold used to induce clusters. Inspection of these clusters revealed recurring structural response forms and their relative frequency in the data. These insights informed the definition of a fixed set of twenty interpretable response pattern categories (e.g., partial phoneme matches, character repetitions, reversals, or copying visible text). All incorrect responses were subsequently assigned to one of these categories through manual labelling, with ambiguous cases resolved through author discussion.
Importantly, all response clustering and category assignment was conducted independently of, and prior to, the statistical analyses linking digital features to external outcomes; categories were defined based on interpretation of learner cognition, not optimised for downstream predictive performance.
3.2 Feature Construction
Each granular response pattern category was assigned to one of five ordered attempt-quality levels, reflecting increasing degrees of task engagement and correctness:
- Non-Meaningful Attempt: Inputs showing no evidence of meaningful item engagement (e.g., qwerty).
- Low-Quality Attempt: Responses indicating limited engagement with the item but no clear evidence of item-relevant understanding (e.g., entering the letters displayed on the screen).
- Partially Correct Attempt: Responses demonstrating partial or emerging understanding of the target concept, but which are incomplete or incorrect (e.g., only writing the first two letters of the word in a Word Spelling assessment).
- Conceptually Correct Attempt: Responses that reflect correct conceptual understanding but fail to meet the formatting expected by the interface (e.g. writing the full word in a Blending assessment where only the first letter is required).
- Fully Correct Attempt: Responses that satisfy formal correctness under the operational scoring rules.
For each learner, the sum of items in each attempt-quality level was computed and normalised by the total number of items attempted, meaning both complete and incomplete assessments could be included in analysis. These aggregated representations serve as the primary features for evaluating alignment with external learning outcomes.
3.3 Baselines
To assess the added value of response-aware representations, the proposed features were compared against two baselines: correctness-only VSAQ scores (proportion of Fully Correct attempts under binary scoring) and correctness-only MCQ scores.
3.4 Ethical Considerations
This study used anonymised data collected as part of routine platform operations, conducted with the consent and support of participating counties and local stakeholders. Personally identifiable information is encrypted locally on devices, and gatekeeper consent is obtained for all learners.
4. RESULTS
4.1 Completion and Performance
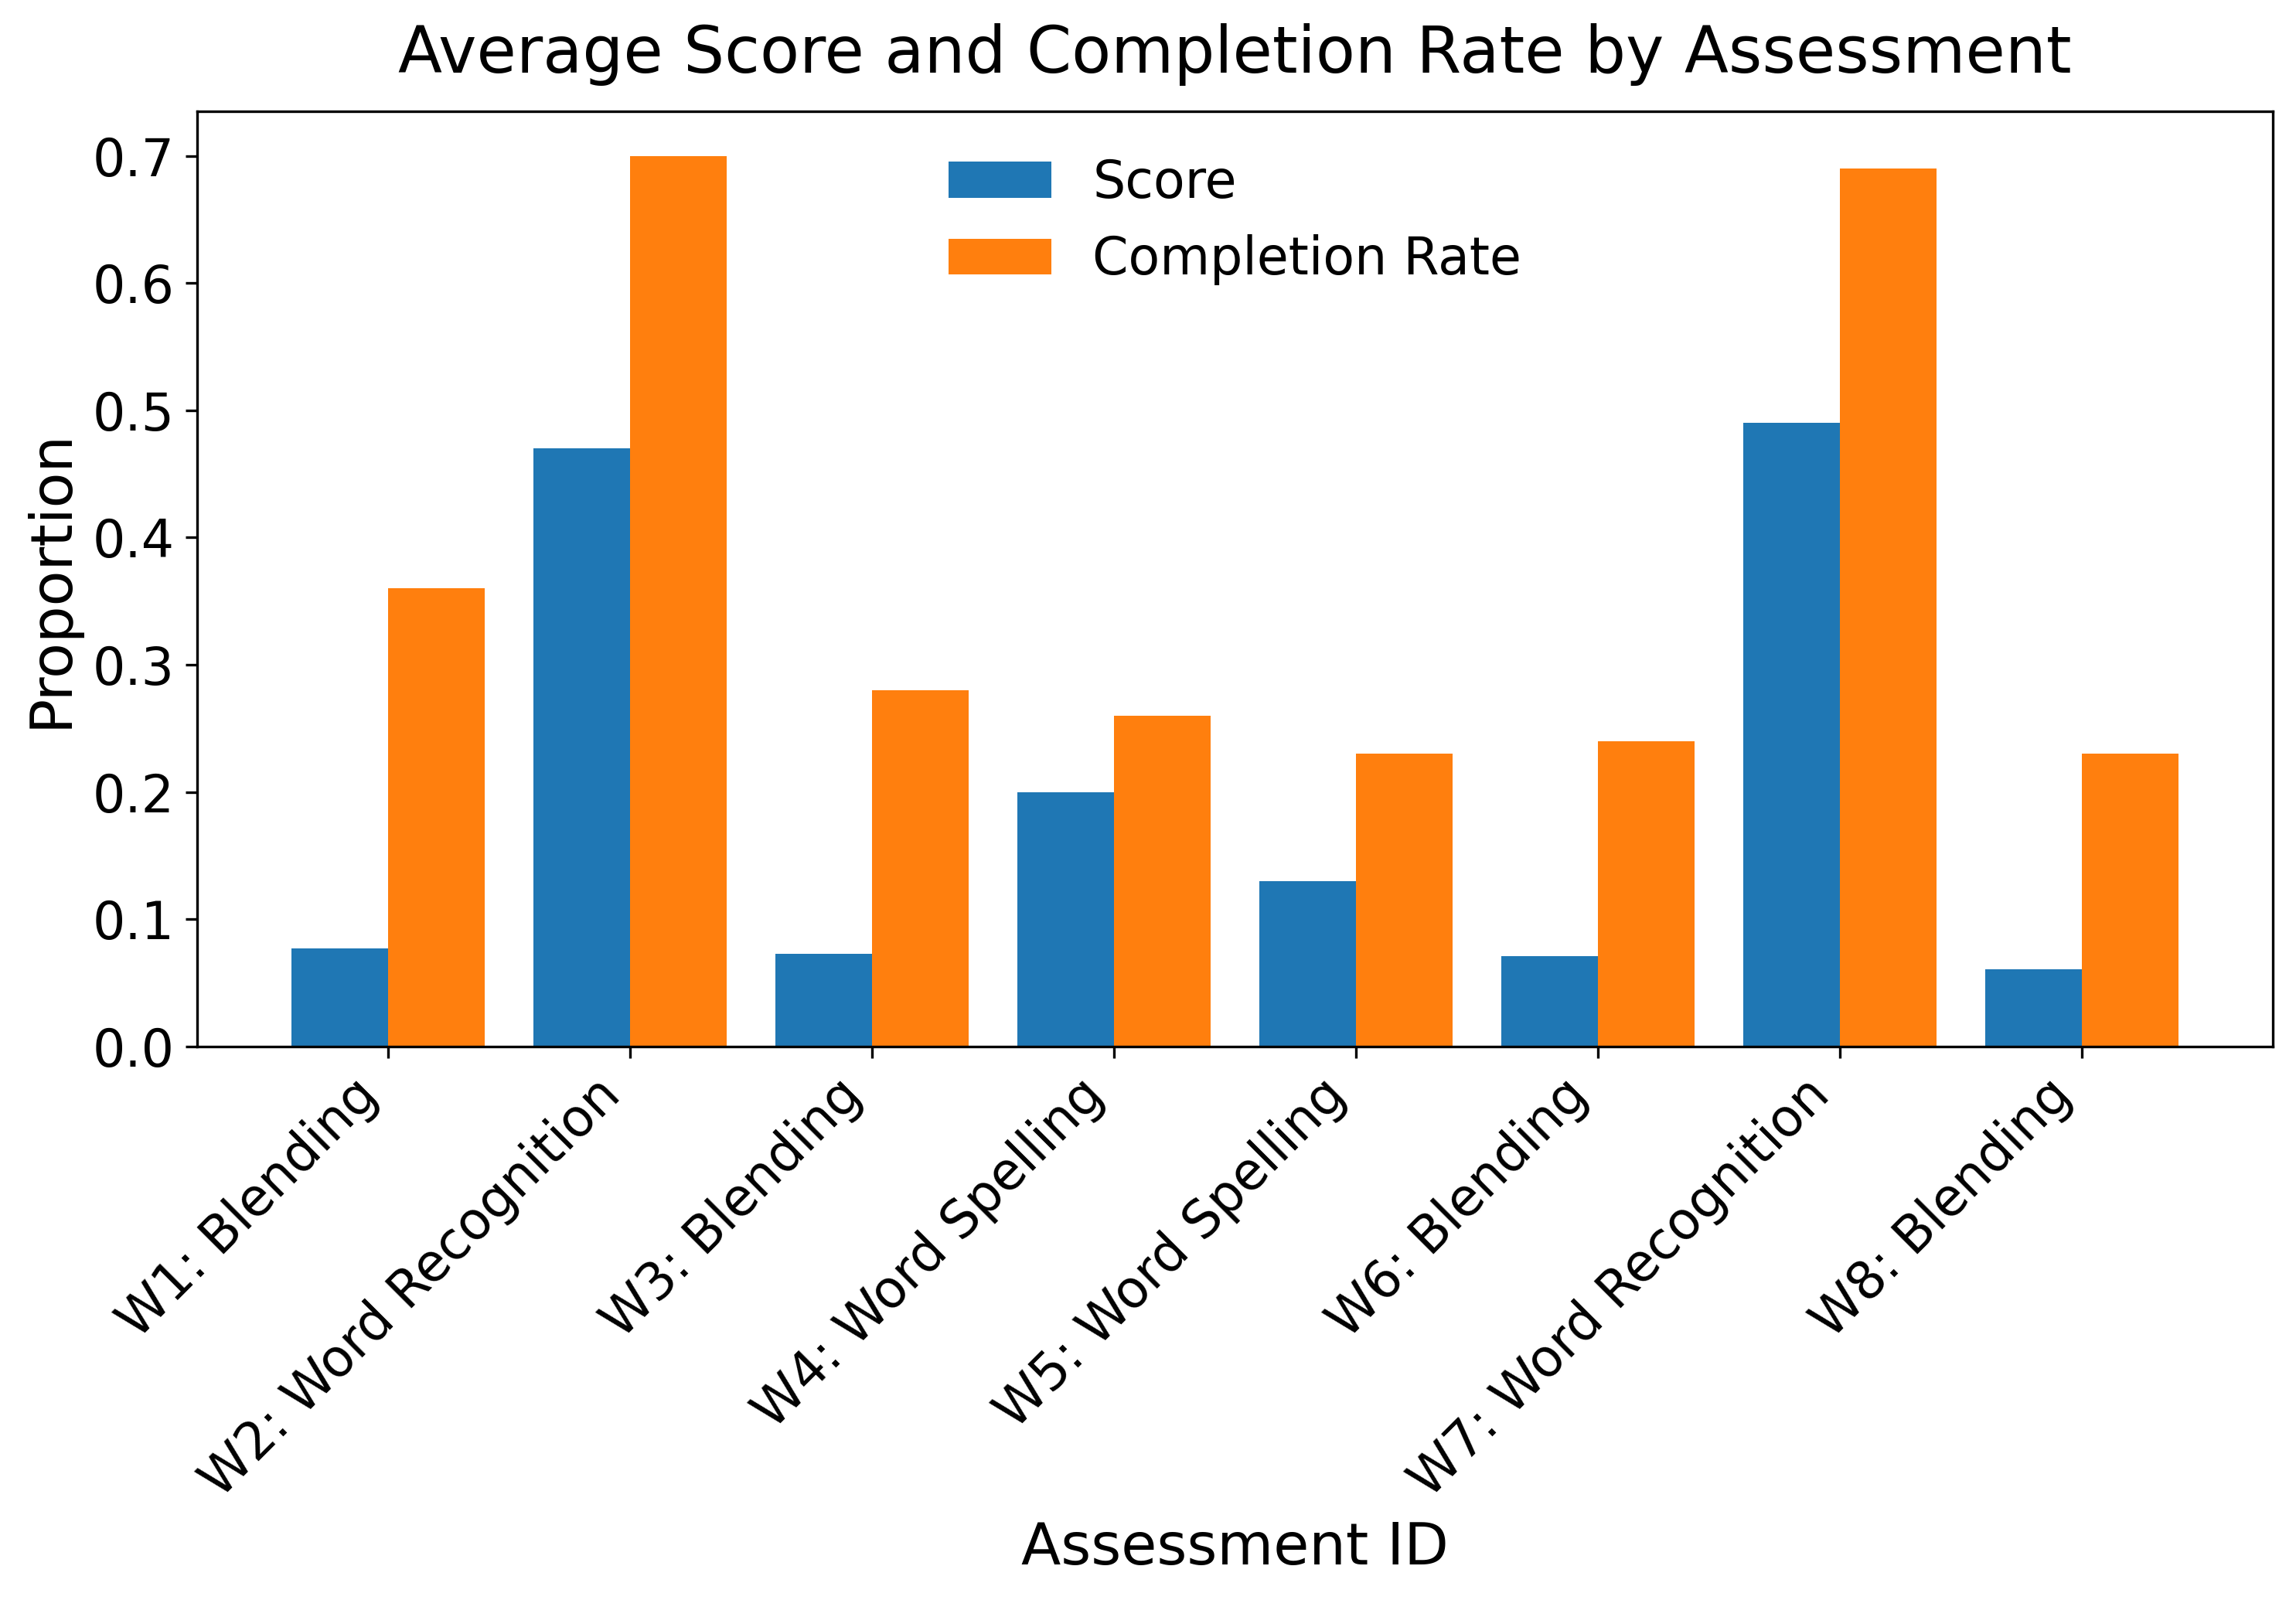
Completion rate reflects the proportion of learners who submit responses to all five items in an assessment, while score reflects correctness conditional on completion. As shown in Figure 3, both metrics varied strongly by assessment format. MCQ-based assessments (Weeks 2 and 7) achieved substantially higher completion and scores than VSAQ-based assessments (all other weeks). Assessment format alone explained 31% of the variance in completed-assessment scores (\(R^2 = 0.313\)), with MCQ assessments yielding scores 38 percentage points higher on average (\(p < 0.001\)). It should be noted that since both MCQ assessments had four response options, random guessing would yield an expected score of 25%, partly contributing to the higher raw scores observed relative to VSAQs. Format effects were also evident for completion: a logistic regression predicting assessment completion from format alone showed that MCQ assessments were over three times more likely to be completed (odds ratio \(\approx 3.1\), \(p < 0.001\); pseudo-\(R^2 = 0.047\)).
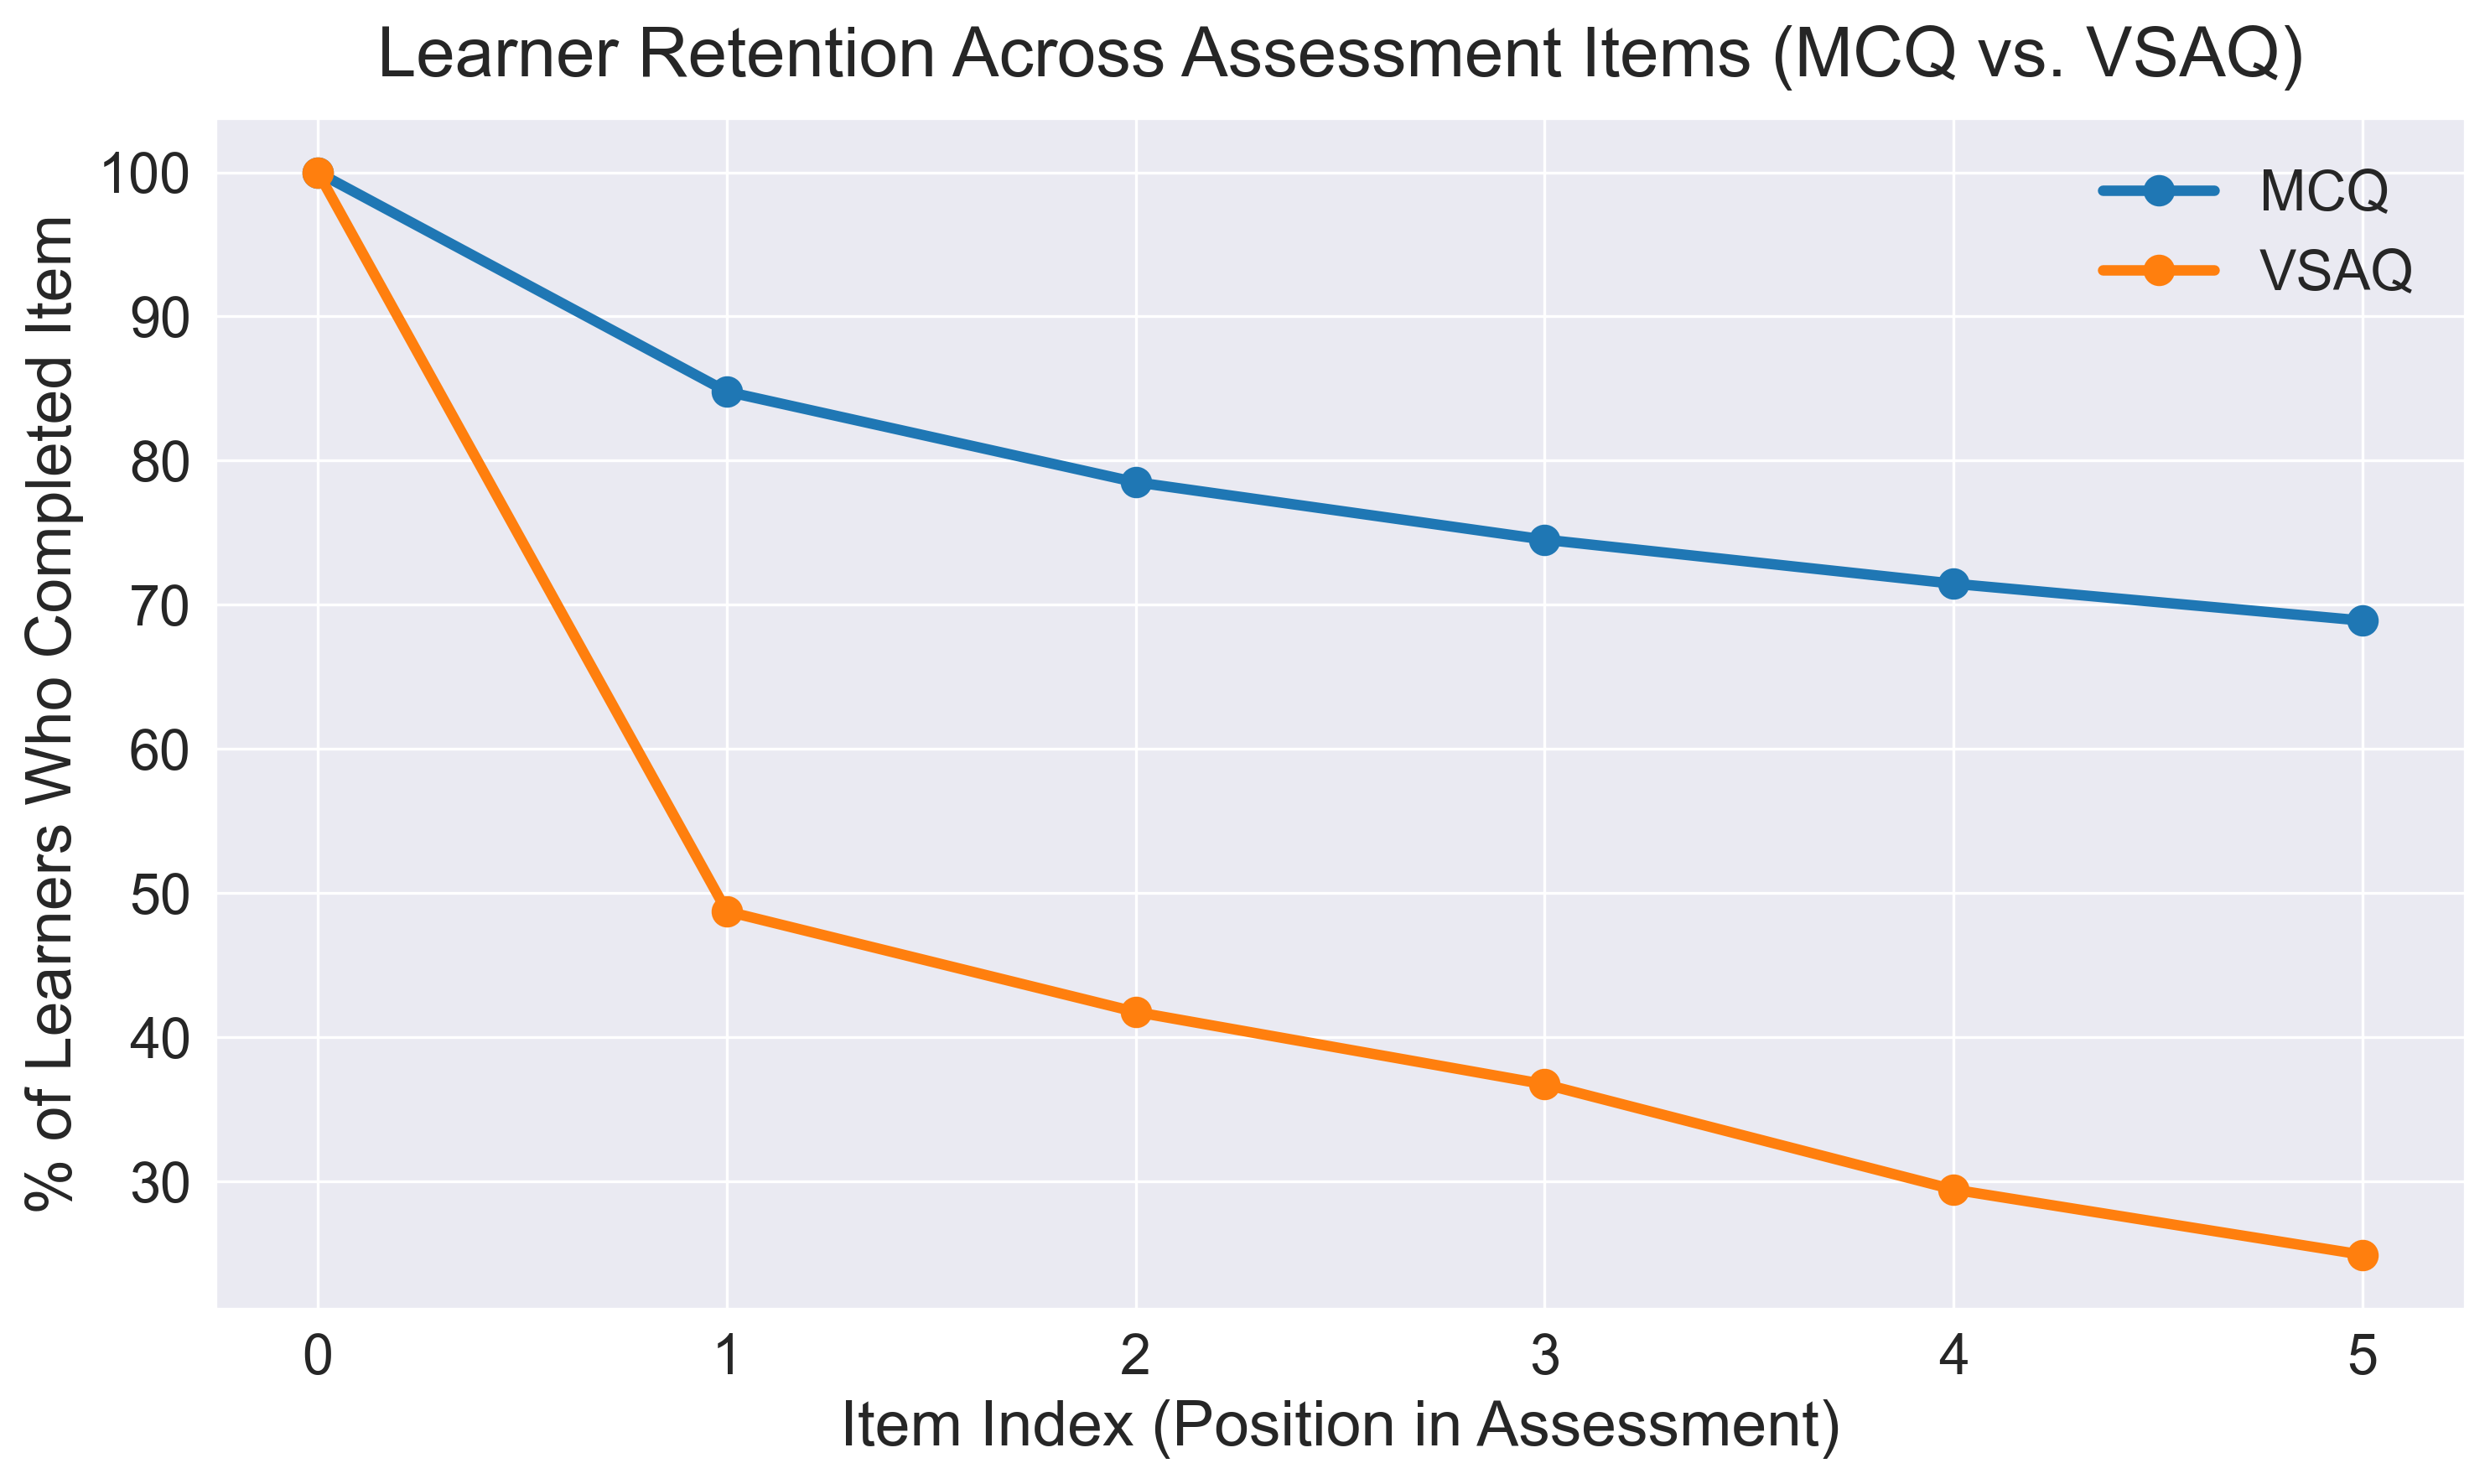
Figure 4 shows the proportion of learners who attempted each item for MCQ vs VSAQ-based assessments, normalised to the introductory screen. All learners shown completed the introductory item, which required only tapping “Start” to proceed. As both formats comprised five scored items, differences in dropout rates cannot be attributed to assessment length. Approximately 85% of learners who reached the introduction attempted the first scored MCQ item, compared to only 49% for VSAQs, indicating an immediate response-format barrier rather than gradual disengagement. Among those who attempted the first item, subsequent attrition remained higher for VSAQs (24% drop-off vs. 16% for MCQs). This pattern is consistent with sustained difficulty in responding to typed-input items relative to recognition-based formats.
4.2 Systematic Patterns in Item Responses
Item-level analysis of incorrect VSAQ responses revealed highly structured and interpretable patterns rather than random error.
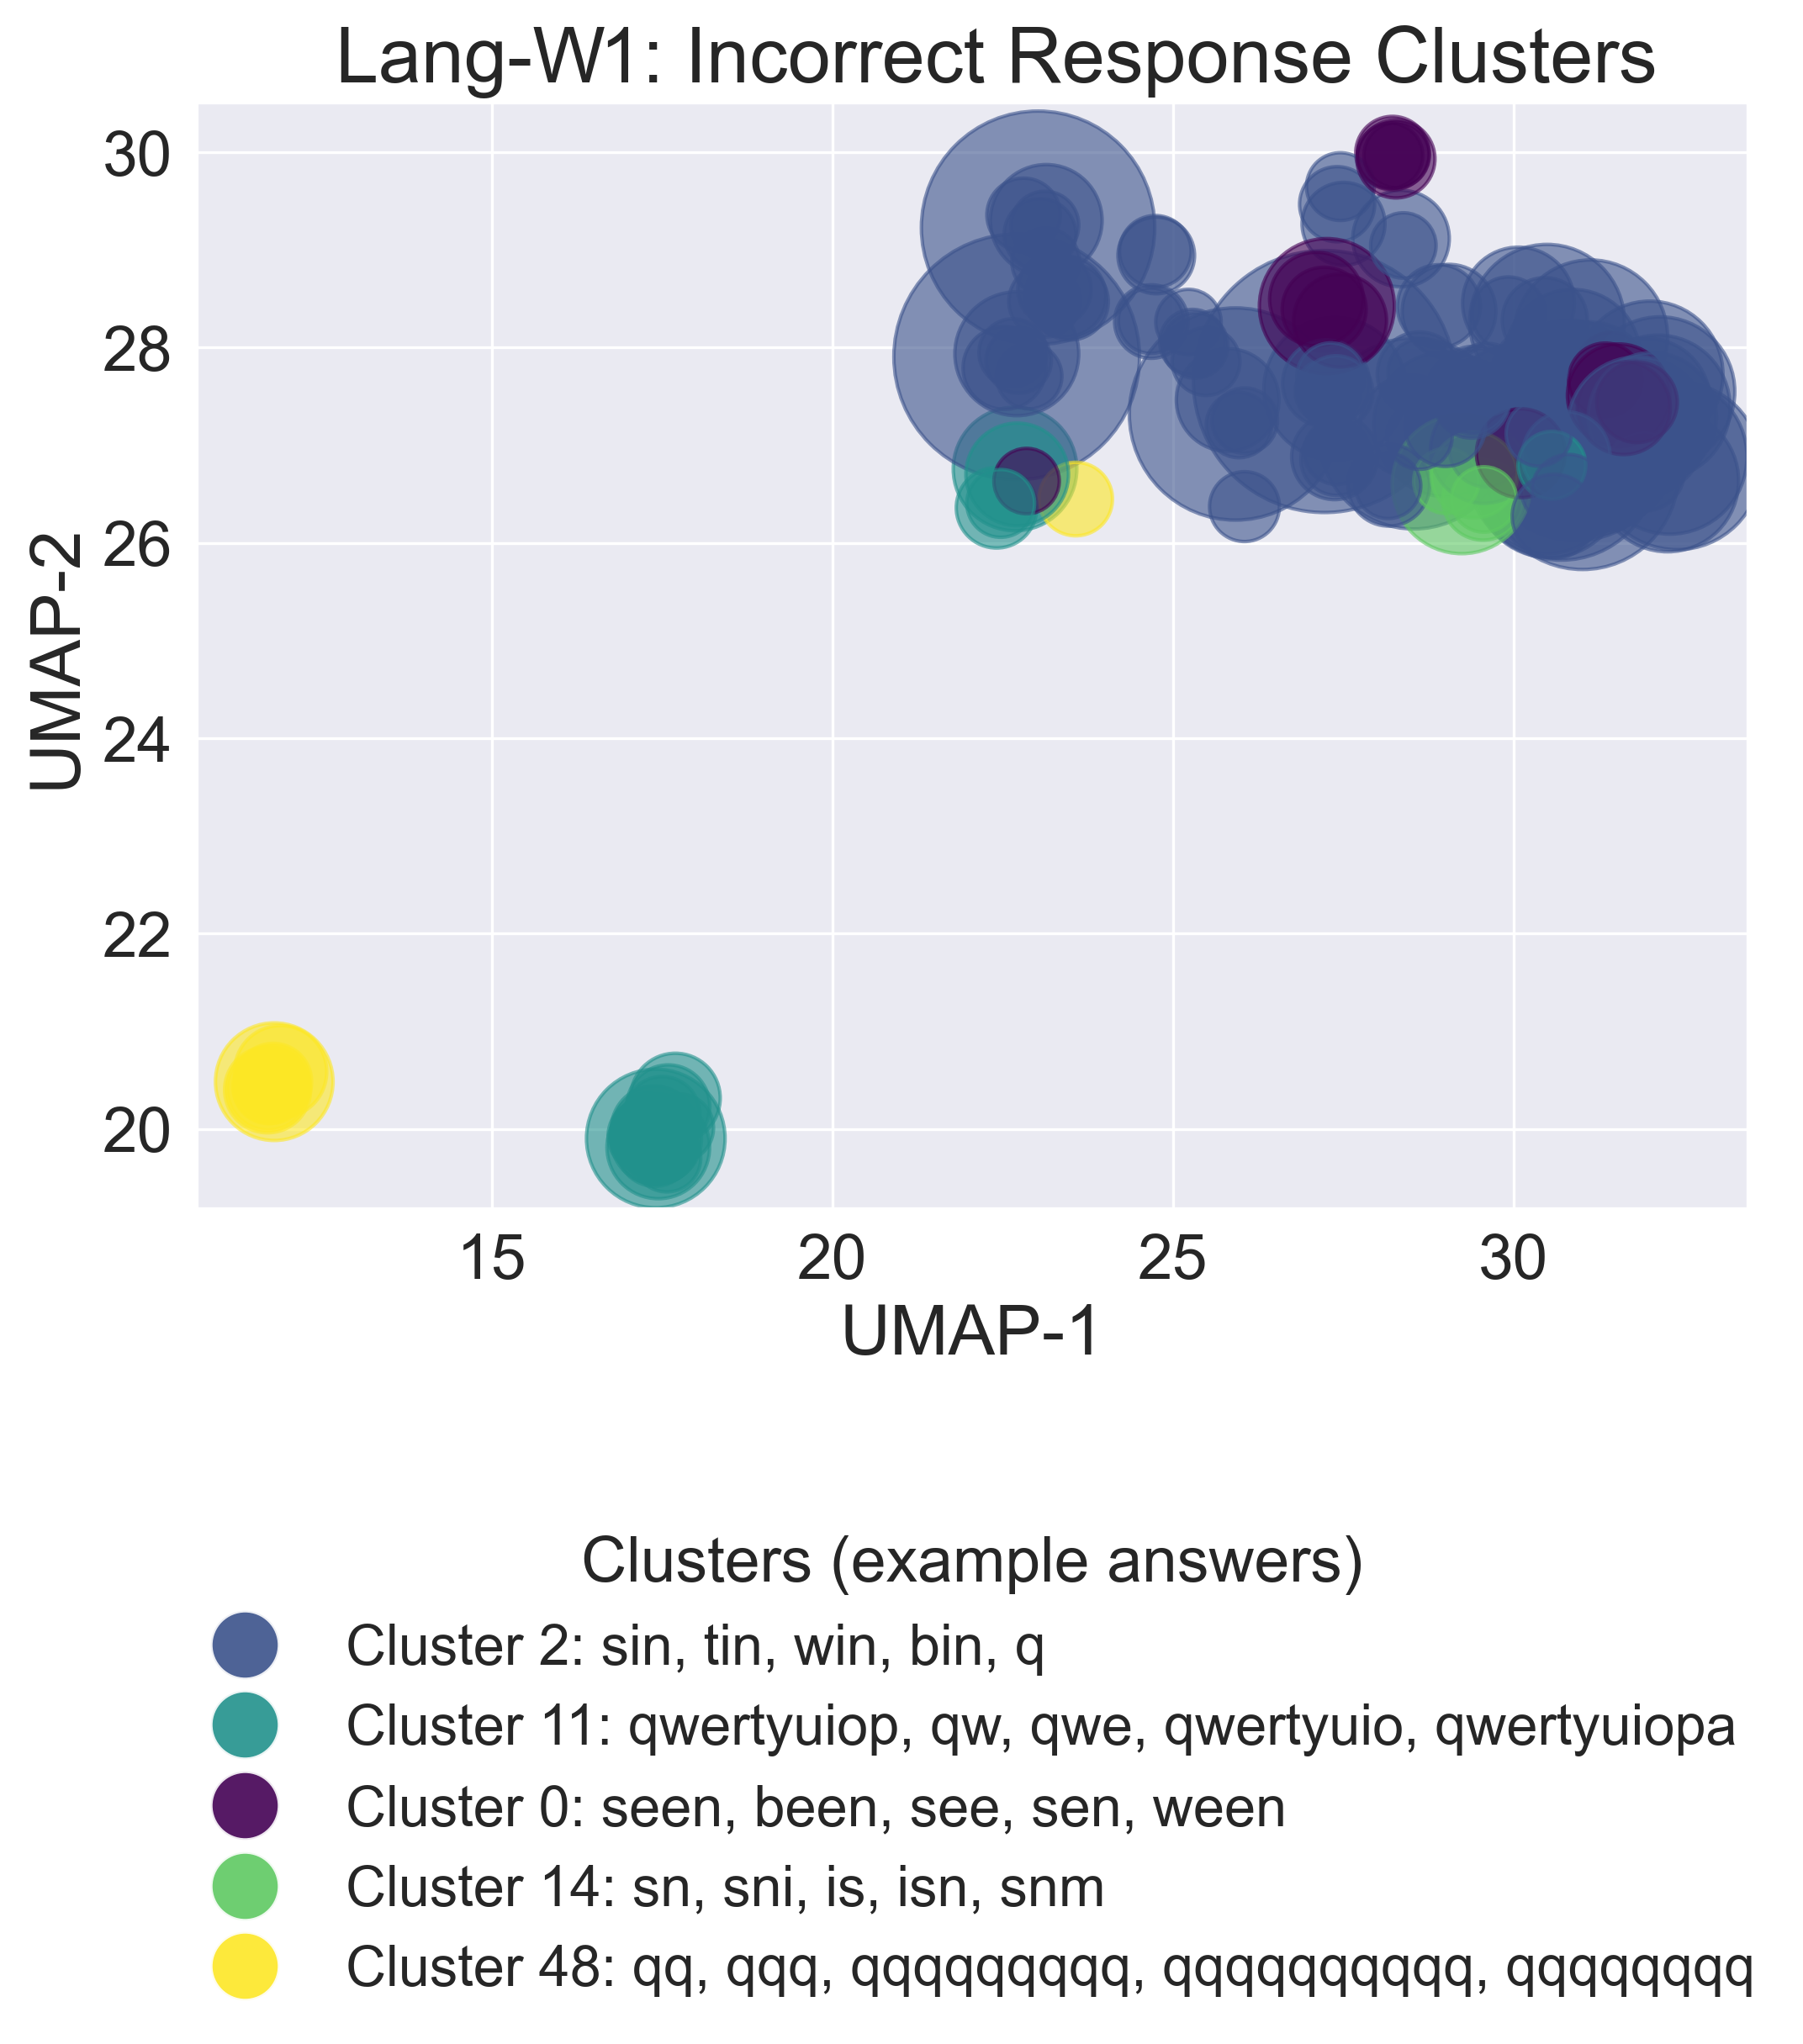
Figure 5 shows a two-dimensional Uniform Manifold Approximation and Projection (UMAP) visualisation of the five largest clusters of incorrect responses for the Week 1 Blending assessment, in which learners were prompted to enter the initial letter of a spoken three-letter word with the rime in. The clustering reveals various recurring response forms, including full word entry, rime substitution, letter reversal, character repetition, and keyboard-swipe inputs. Despite reflecting very different levels of understanding, all are marked as incorrect for failing the formal constraint of providing only the first letter.
Similar response forms were observed consistently across items and weeks, indicating systematic rather than item-specific behaviour. Across the four Blending weeks, the most common incorrect response for 90% of items was typing the full word rather than the initial letter, indicating recognition of the target phoneme but misunderstanding of the response requirement. Conversely, in Word Spelling assessments, where the full word was required, a substantial proportion of incorrect responses consisted of only the initial letter. This asymmetry suggests confusion between visually similar task formats that place different demands on learner input. More generally, these response patterns reflect structured partial understanding rather than random error, highlighting signal that binary scoring obscures.
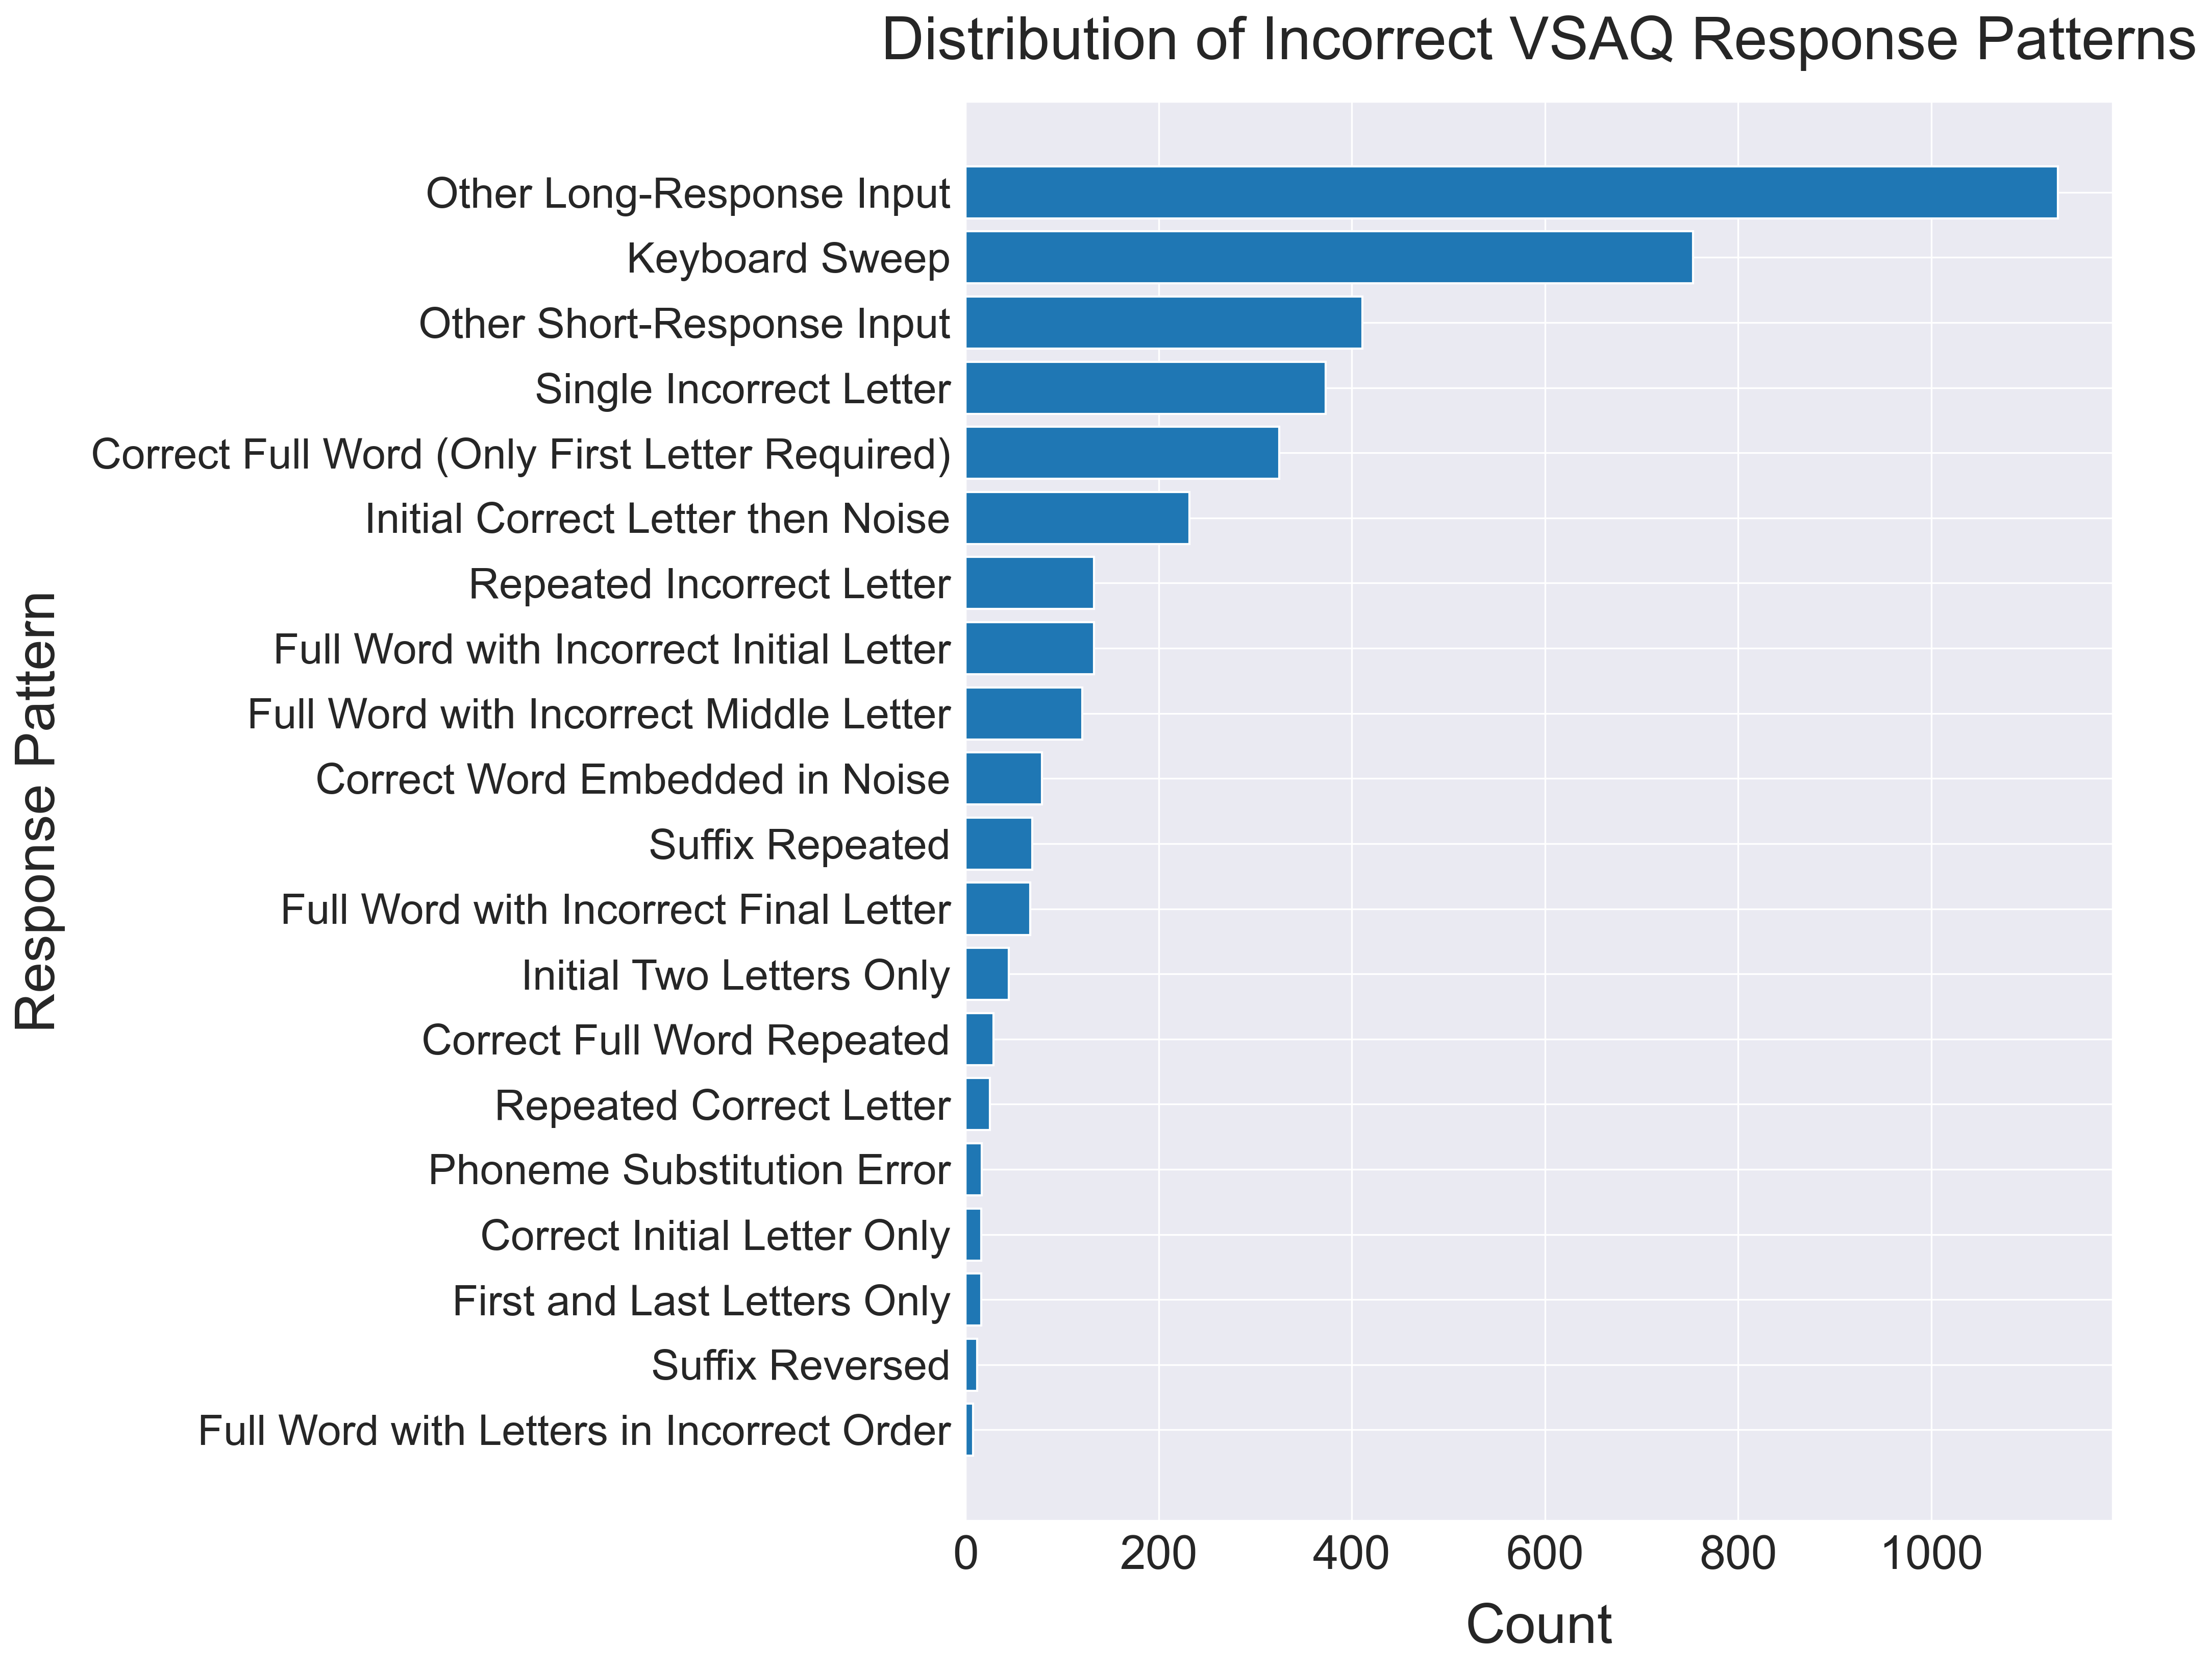
Figure 6 shows the distribution of incorrect VSAQ item responses across the twenty response pattern categories. The three largest categories, accounting for 57% of attempts, reflect disengaged inputs: keyboard sweeps and other unstructured long or short responses. Beyond these, the most frequent patterns indicate partial or misdirected task engagement, such as single incorrect letters, entry of the full word and provision of the correct initial letter followed by unstructured text.
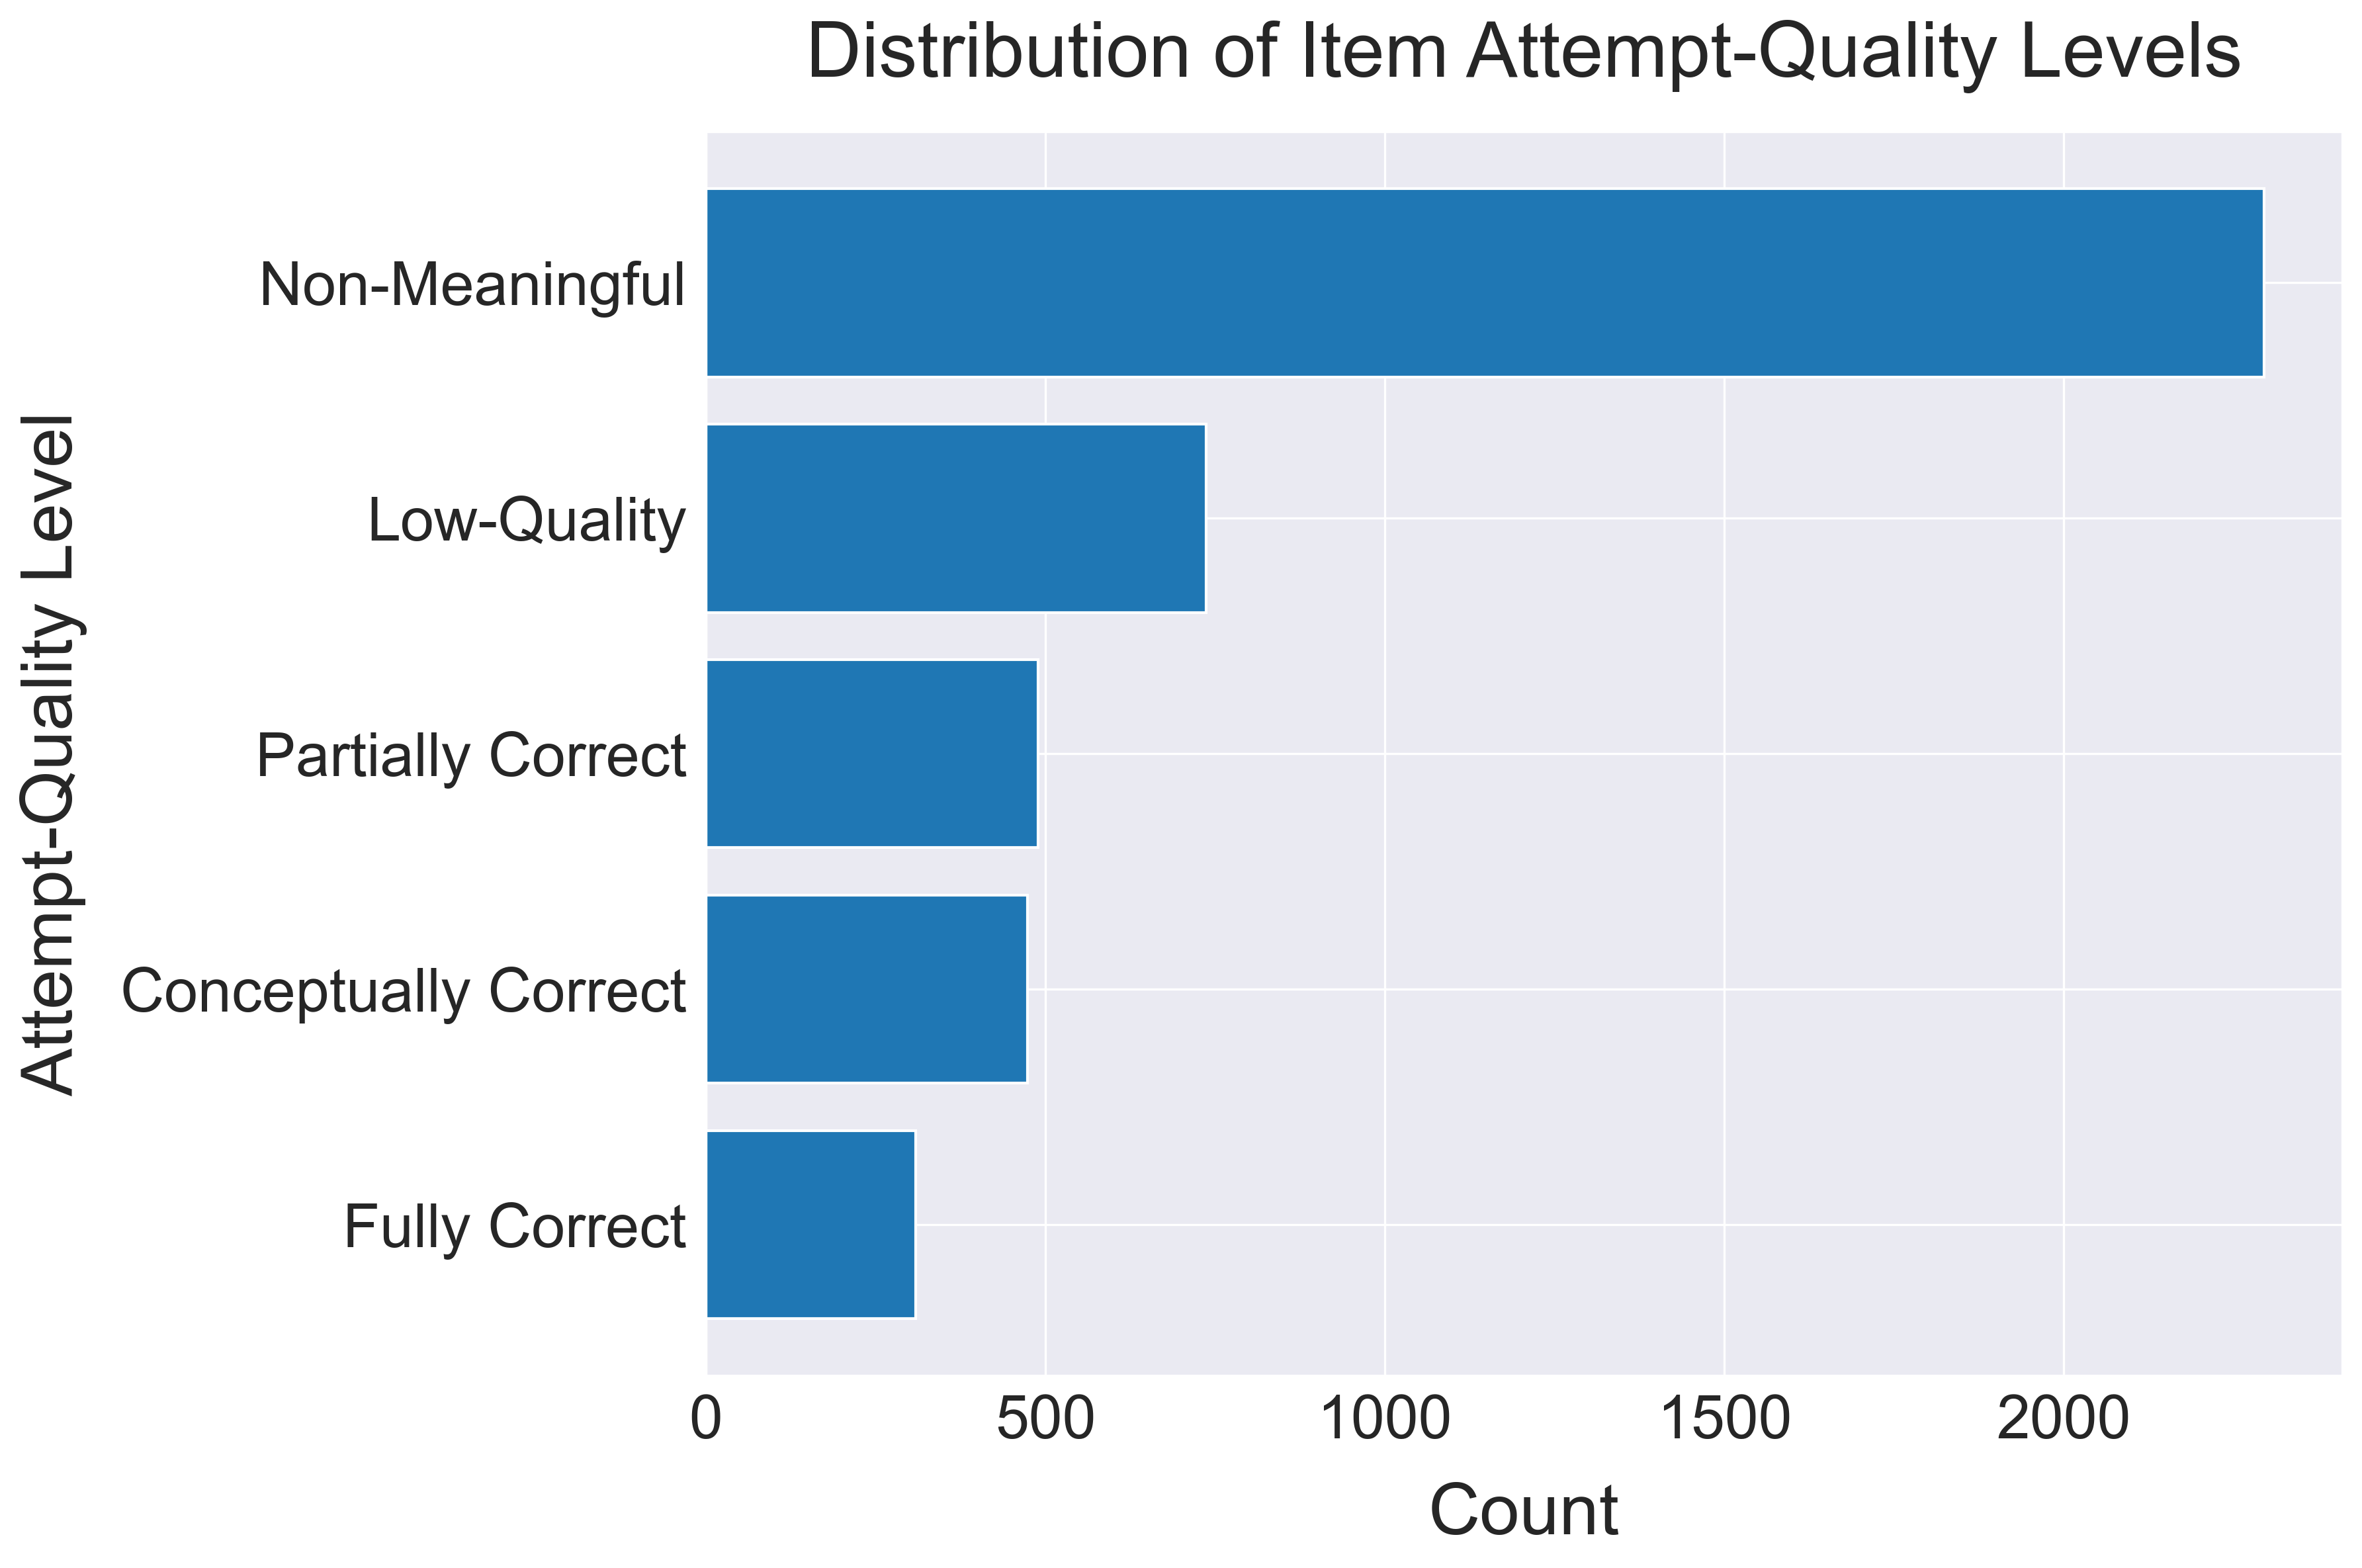
Figure 7 shows the distribution of item responses across the five higher-level attempt-quality categories. While fully correct responses account for only 7% of attempts, a further 22% fall into intermediate categories that reflect partial or conceptual correctness constrained by response format. This structure motivates the use of response-aware representations rather than binary correctness when modelling early learning outcomes.
4.3 Alignment with External Outcomes
To evaluate the extent to which digital assessment signals reflect underlying literacy ability, digital learner representations are compared against assessor-administered IDELA literacy scores, a widely used measure of early literacy skills.
Linear regression models were used to compare three representations of digital learner performance against IDELA literacy scores. In all models, the dependent variable was the learner’s IDELA literacy score, and predictors were standardised learner-level features derived from digital assessments. The following representations were compared:
- MCQ correctness-only: the proportion of MCQ items answered correctly.
- VSAQ correctness-only: the proportion of VSAQ items answered strictly correctly.
- Response-aware VSAQ features: the distribution of attempt-quality levels across VSAQ items.
Regression coefficients therefore represent the expected percentage point (pp) change in IDELA literacy score associated with a one standard deviation (SD) increase in the corresponding digital assessment feature.
| Model | \(R^2\) | CV \(R^2\) | Model \(p\)-value |
|---|---|---|---|
| MCQ (correctness) | 0.005 | -0.064 | 0.283 |
| VSAQ (correctness) | 0.018 | -0.062 | 0.009 |
| VSAQ (response-aware) | 0.095 | 0.008 | \(< 0.001\) |
As shown in Table 1, predictive alignment was weak for both binary-correctness representations: correctness-only VSAQ models explained little variance (\(R^2 = 0.018\)), while MCQ-only models explained almost none (\(R^2 = 0.005\)) and were not statistically significant. In contrast, the response-aware VSAQ model achieved higher, though still modest, explanatory power in sample (\(R^2 = 0.095\)) with monotonic associations with IDELA literacy scores. However, 10-fold cross-validated \(R^2\) was near-zero or negative across all three models, with the response-aware model the only one to retain a positive \(R^2_{\text {CV}}\) (\(0.008\)). With each fold containing only approximately 38 learners, stable out-of-sample estimation is difficult at this sample size [30], and larger-scale external validation is needed.
| Model | Variable | Mean | SD | Coef. | p |
|---|---|---|---|---|---|
| MCQ | Intercept | – | – | 66.36 | \(<0.001\) |
| Correct (prop.) | 0.43 | 0.50 | 1.10 | 0.283 | |
| VSAQ | Intercept | – | – | 64.33 | \(<0.001\) |
| Correct (prop.) | 0.07 | 0.16 | 2.31 | 0.009 |
Despite the correctness-only models explaining little variance in external literacy outcomes, Table 2 shows that correctness coefficients were positive in both cases, indicating directional association with higher literacy scores, with a larger effect for VSAQs (2.31 vs. 1.10), though both were weak and, for MCQs, not statistically significant.
| Attempt Type | Mean | SD | Coef. | p | pp per Item |
|---|---|---|---|---|---|
| Intercept | – | – | 64.33 | 0.000 | – |
| Low-Quality | 0.17 | 0.18 | -0.00 | 1.000 | ns |
| Partially Correct | 0.12 | 0.16 | 2.78 | 0.001 | 3.48 |
| Conceptually Correct | 0.11 | 0.17 | 3.92 | 0.000 | 4.61 |
| Fully Correct | 0.07 | 0.16 | 2.62 | 0.002 | 3.28 |
In contrast, Table 3 shows that response-aware VSAQ features recover richer signal. In this model, Non-Meaningful attempts serve as the reference category. Partially and conceptually correct attempt-quality features both retain independent predictive power even when controlling for fully correct responses. Conceptually correct attempts show the largest association (3.92pp per SD), exceeding that of fully correct attempts (2.62pp), suggesting that responses reflecting correct understanding but incorrect formatting carry meaningful signal. As noted above, these are in-sample associations and larger-scale validation is needed to establish whether they generalise.
5. DISCUSSION AND CONCLUSIONS
This study examines how pre-primary learners engage with different digital assessment formats in large-scale, unsupervised, low-resource settings, and what this implies for scalable learning measurement. Consistent with prior work, MCQ-based assessments were substantially easier for learners to complete: scores were 38 percentage points higher and completion odds were more than three times those of VSAQ-based assessments. In contrast, VSAQs exhibited sharp early attrition, with around half of learners exiting before attempting the first scored item. This pattern points to an immediate interaction or response-format barrier rather than gradual disengagement. While such barriers are typically mitigated in supervised settings, where an adult ensures task completion, in unsupervised contexts increased task difficulty directly reduces data coverage. This gap may be partially addressed through improved task scaffolding to clarify response expectations.
A central finding of this study is that incorrect VSAQ responses can contain highly structured and interpretable signals. Learners frequently produced responses reflecting partial phonological knowledge, confusion between task formats (e.g., writing the full word when only the initial letter was required, and vice versa), and emerging but incomplete literacy skills. These patterns were consistent across items and weeks, indicating systematic rather than idiosyncratic behaviour. The attempt-quality taxonomy developed here captures a gradient of learner understanding that binary scoring collapses entirely.
These response-aware features yielded the only statistically significant in-sample association with IDELA literacy scores, where correctness-only representations did not. However, cross-validated performance was weak across all models. Low explained variance is common when linking digital process data to external benchmarks in low-income early-childhood settings [33, 12], and in the present study, noise is compounded by fully unsupervised administration on shared classroom devices, a narrow sub-skill focus relative to the holistic IDELA composite [18], and a small single-county validation sample (\(n=384\)). The key question for future work is therefore not whether alignment is strong in absolute terms, but whether the directional signal observed here can be confirmed with larger and more diverse validation samples.
Together, the findings suggest that moving beyond binary scoring of constructed responses may provide diagnostic value in unsupervised early-grade digital assessment. MCQs sustain engagement, but VSAQ errors carry structured learner signal that conventional scoring discards. Hybrid designs combining both formats, alongside richer scoring and improved scaffolding to mitigate early attrition, offer a promising direction for scalable learning measurement in these settings.
6. LIMITATIONS AND FUTURE WORK
This study has several limitations. The external validation sample is small (\(n = 384\)), drawn from a single county, and insufficient to support stable out-of-sample predictive validation. Digital assessment data are observed only for learners in classes that progressed far enough to unlock assessments, introducing potential selection bias, and response pattern categories were assigned through potentially subjective manual labelling. The analyses are limited to PP2 learners and a single language and interface design, limiting generalisability to other age groups or contexts. MCQ and VSAQ formats were confounded with item type (word recognition vs. blending/spelling), limiting causal attribution of observed differences to response format alone.
Future work should prioritise larger-scale external validation with independently sampled learners across multiple regions. Validating the attempt-quality framework across additional grades, subjects, languages, and deployment settings will be essential for establishing its broader applicability. Scalable and automated approaches to response classification should also be explored, alongside examination of how response-aware signals can be incorporated into adaptive instruction or feedback. The sharp initial attrition observed for VSAQs points to the need for improved task scaffolding, such as clearer instructions, worked examples, or tighter input constraints, to reduce response-format confusion while preserving diagnostic value.
7. REFERENCES
- M. G. Carneiro Queiroz, F. C. Specian Junior, P. T. Hamamoto Filho, T. M. Santos, S. K. Schauber, A. M. Woltman, and D. Cecilio-Fernandes. Comparison of cognitive workload between very short answer questions and multiple-choice questions: an eye-tracking experiment. Medical Education Online, 31(1):2621434, 2026.
- K. Carson, G. Gillon, and T. Boustead. Computer-administrated versus paper-based assessment of school-entry phonological awareness ability. Asia Pacific Journal of Speech, Language and Hearing, 14(2):85–101, 2011.
- M. Clarke and D. Luna-Bazaldua. Primer on large-scale assessments of educational achievement. Technical report, World Bank, 2021. © World Bank. CC BY 3.0 IGO.
- L. W. Drozdick, K. Getz, S. E. Raiford, and O. Zhang. WPPSI-IV: Equivalence of Q-interactive and paper formats. Q-interactive technical report 14, Pearson, 2016.
- M. M. Dubeck and A. Gove. The early grade reading assessment (egra): Its theoretical foundation, purpose, and limitations. International Journal of Educational Development, 40:315–322, 2015.
- G. J. Duncan, C. J. Dowsett, A. Claessens, K. Magnuson, A. C. Huston, and P. Klebanov. School readiness and later achievement. Developmental Psychology, 43(6):1428–1446, 2007.
- P. L. Engle, L. C. H. Fernald, H. Alderman, J. R. Behrman, C. O’Gara, A. Yousafzai, M. C. de Mello, M. Hidrobo, N. Ulkuer, I. Ertem, and S. Iltus. Strategies for reducing inequalities and improving developmental outcomes for young children in low-income and middle-income countries. The Lancet, 378(9799), 2011.
- L. C. H. Fernald, P. Kariger, P. L. Engle, and A. Raikes. Examining early child development in low-income countries: A toolkit for the assessment of children in the first five years of life. Technical report, 2009.
- A. Gurung, K. Vanacore, A. A. McReynolds, K. S. Ostrow, E. Worden, A. C. Sales, and N. T. Heffernan. Multiple choice vs. fill-in problems: The trade-off between scalability and learning. In Proceedings of the 14th Learning Analytics and Knowledge Conference, pages 507–517, 2024.
- C. F. Herrmann-Abell, J. Hardcastle, and G. E. DeBoer. Exploring the comparability of multiple-choice and constructed-response versions of scenario-based assessment tasks. Grantee Submission, NARST Annual International Conference, 2022.
- L. Major, R. Daltry, M. Otieno, K. Otieno, A. Zhao, C. Sun, J. Hinks, A. Friedberg. Digital personalised learning to improve literacy and numeracy outcomes: a randomised controlled trial in kenyan pre-primary classrooms. Research Papers in Education, 1–36, 2026.
- M. S. McHenry, D. Mukherjee, S. Bhavnani, A. Kirolos, J. D. Piper, M. M. Crespo-Llado, and M. J. Gladstone. The current landscape and future of tablet-based cognitive assessments for children in low-resourced settings. PLOS Digital Health, 2(2):e0000196, 2023.
- I. V. S. Mullis, M. O. Martin, P. Foy, and M. Hooper. Pirls 2016 international results in reading, 2017.
- S. Nag. Assessment of literacy and foundational learning in developing countries: Final report. Technical report, Health & Education Advice and Resource Team (HEART), UK Department for International Development (DFID), 2017.
- M. Neumann and D. Neumann. Validation of a touch screen tablet assessment of early literacy skills and a comparison with a traditional paper-based assessment. International Journal of Research and Method in Education, 42:1–14, 2018.
- G. Ouellette and M. Sénéchal. Pathways to literacy: A study of invented spelling and its role in learning to read. Child Development, 79(4):899–913, 2008.
- R. Pelánek and T. Effenberger. Beyond binary correctness: Classification of students’ answers in learning systems. User Modeling and User-Adapted Interaction, 30:867–893, 2020.
- L. Pisani, I. Borisova, and A. J. Dowd. Developing and validating the international development and early learning assessment (idela). International Journal of Educational Research, 91:1–15, 2018.
- N. J. Pitchford and L. A. Outhwaite. Can touch screen tablets be used to assess cognitive and motor skills in early years primary school children? a cross-cultural study. Frontiers in psychology, 7:1666, 2016.
- T. Puthiaparampil and M. M. Rahman. Very short answer questions: a viable alternative to multiple choice questions. BMC medical education, 20(1):141, 2020.
- A. Raikes, R. Sayre, D. Davis, K. Anderson, M. Hyson, E. Seminario, and A. Burton. The measuring early learning quality & outcomes initiative: purpose, process and results. Early Years, 39(4):360–375, 2019.
- E. Romano, L. Babchishin, L. S. Pagani, and D. Kohen. School readiness and later achievement: Replication and extension using a nationwide survey. Developmental Psychology, 46(5):995–1007, 2010.
- RTI International. Early grade mathematics assessment (egma) toolkit. Technical report, United States Agency for International Development (USAID), 2009.
- RTI International. Spelling, reading comprehension, and oral language subtasks: Complements to the early grade reading assessment. Technical Brief, 2017.
- RTI International. Self-administered egra/egma: Results of pilot test. Technical report, 2022.
- RTI International. Self-administered egra/egma: Results of pilot test in chichewa. Technical report, 2023.
- A. H. Sam, R. Westacott, M. Gurnell, R. Wilson, K. Meeran, and C. Brown. Comparing single-best-answer and very-short-answer questions for the assessment of applied medical knowledge in 20 UK medical schools: cross-sectional study. BMJ Open, 9(9):e032550, 2019.
- L. W. T. Schuwirth and C. P. M. van der Vleuten. Programmatic assessment: From assessment of learning to assessment for learning. Medical Teacher, 33(6):478–485, 2011.
- Uwezo. Are all our children learning? uwezo 7th learning assessment report, 2021.
- A. Vabalas, E. Gowen, E. Poliakoff, and A. J. Casson. Machine learning algorithm validation with a limited sample size. PLOS ONE, 14(11):e0224365, 2019.
- E. V. van Wijk, R. J. Janse, B. N. Ruijter, J. H. Rohling, J. van der Kraan, S. Crobach, M. d. Jonge, A. J. d. Beaufort, F. W. Dekker, and A. M. Langers. Use of very short answer questions compared to multiple choice questions in undergraduate medical students: an external validation study. PLoS One, 18(7):e0288558, 2023.
- X. Wang, C. Rose, and K. Koedinger. Seeing beyond expert blind spots: Online learning design for scale and quality. In Proceedings of the 2021 CHI Conference on Human Factors in Computing Systems, pages 1–14, 2021.
- H. Yuan, M. Ocansey, S. Adu-Afarwuah, M. Sheridan, A. Hamoudi, H. Okronipa, S. M. Kumordzie, B. M. Oaks, and E. L. Prado. Evaluation of a tablet-based assessment tool for measuring cognition among children 4–6 years of age in Ghana. Brain and Behavior, 12(10):e2749, 2022.
© 2026 Copyright is held by the author(s). This work is distributed under the Creative Commons Attribution-NonCommercial-NoDerivatives 4.0 International (CC BY-NC-ND 4.0) license.