ABSTRACT
Student dropout is a major challenge in large-scale supplementary education, where early identification of at-risk learners is essential. Although prior educational data mining studies have explored dropout prediction using learning logs, long-term test-based data common in offline settings remain underexplored. This industry paper reports a real-world application of dropout prediction using longitudinal standardized test data from over 3,000 junior high school students in a large Japanese cram school. We engineered interpretable features capturing achievement dynamics, including recovery efficiency after score declines and trend consistency. Random Forest models trained on a previous cohort were validated on an independent cohort. The best-performing model achieved approximately 89% accuracy and a dropout F1-score of 0.80, enabling prediction before the final academic year. Feature importance analysis showed that recovery from performance declines was a stronger indicator of dropout risk than absolute achievement. These results demonstrate that longitudinal test data can support accurate and interpretable dropout prediction at scale, offering practical value for early intervention.
Keywords
INTRODUCTION
Student dropout is a persistent challenge in large-scale supplementary education, where learners and families invest substantial time and financial resources over multiple years. For providers, dropout not only disrupts learning continuity but also limits the effectiveness of long-term curricular planning and student support. Accordingly, there is growing interest in early-warning systems that can identify at-risk learners early enough to enable timely, targeted interventions rather than reactive responses after disengagement becomes irreversible [1][3]. In this study, a cram school refers to a private supplementary education institution that provides after-school academic instruction, primarily aimed at supporting students’ preparation for high school entrance examinations.
Educational Data Mining (EDM) and Learning Analytics (LA) research has produced a broad body of work on dropout prediction using machine learning, often leveraging digital trace data such as LMS activity logs, clickstream behavior, and online engagement metrics (e.g., [1][8]).
In many offline or hybrid educational settings, however, these fine-grained behavioral logs are limited or unavailable. Instead, institutions frequently maintain longitudinal assessment records—standardized tests or periodic mock exams—collected consistently over multiple years. While dropout prediction has also been studied with administrative and academic records (e.g., transcripts, credits, grades), evidence remains comparatively thinner regarding how to transform repeated test performance trajectories into actionable early warning signals in real-world, offline-dominant contexts[8].
While various ensemble learning techniques, such as Random Forests [2] and Gradient Boosting Decision Trees like XGBoost [4] and GBM [6], have demonstrated high predictive accuracy in these domains, their application to offline longitudinal records requires careful adaptation. Specifically, beyond achieving high accuracy, it is critical to ensure model interpretability—a growing focus in recent EDM research [7]—so that predictions can directly inform pedagogical interventions. In this study, we employ a Random Forest approach [2] not only for its robust performance but also to validate the effectiveness of our interpretable feature engineering framework.
This gap is particularly relevant for supplementary education providers (e.g., cram schools), where periodic test-based evaluation is central to instructional decision-making. Prior EDM work has shown the potential of predictive modeling in Japanese cram school contexts—for example, using teacher observation reports and exam scores for performance prediction[5]. Building on this line of industry-relevant EDM, we focus specifically on dropout prediction using data that many supplementary education providers already possess at scale: multi-year standardized test records.
In this industry paper, we investigate how longitudinal standardized test data can be utilized to support early identification of students at risk of dropout in large-scale supplementary education. We focus on a real-world setting in which repeated test-based assessments are routinely collected but fine-grained digital learning logs are limited or unavailable. To address this context, we design a feature engineering framework that captures students’ achievement dynamics over time, including responses to performance declines, stability of learning trajectories, and distributional patterns of subject performance. We then examine how such interpretable temporal indicators can be integrated into machine learning models for practical early-warning applications. Through cohort-based model development and independent cohort validation, this study aims to evaluate the feasibility, generalizability, and operational relevance of dropout prediction using offline longitudinal assessment records. Ultimately, we seek to clarify whether existing assessment infrastructures in supplementary education can be adapted into data-driven early-warning systems that support timely and targeted student interventions.
methods
Context, Data, and Outcome Definition
This study was conducted in collaboration with a large-scale Japanese cram school that prepares students for high school entrance examinations. We analyzed longitudinal standardized test records collected routinely as part of instructional practice.
To ensure consistent longitudinal trajectories, we restricted the cohort to students who participated in the first Grade 7 diagnostic test (N = 3,316). Students subsequently took up to 15 standardized diagnostic and mock examinations from Grade 7 to Grade 9. Participation decreased over time, with 2,200 students remaining at the final Grade 9 test, corresponding to a 33.6% reduction from the initial cohort. An overview of the dataset, observation period, and evaluation design is summarized in Table 1.
Item | Description |
|---|---|
Educational setting | Large-scale Japanese cram school preparing students for high school entrance examinations |
Initial cohort | 3,316 students who participated in the first Grade 7 diagnostic test |
Observation period | Grade 7 (Year 1) to Grade 9 (Year 3) |
Number of test occasions | Up to 15 standardized diagnostic and mock examinations |
Subjects analyzed | Native language, Mathematics, English, overall average |
Label definition | Graduates: students with a graduation flag; Dropouts: test participants without the flag |
Final test participants | 2,200 students at the final Grade 9 test (33.6% decrease from initial cohort) |
Minimum tests required | 3 test participations (for feature computation) |
Evaluation sample size | ~3,100 students (varies by model due to minimum test requirement) |
Validation design | Train on 2024 cohort, validate on independent 2025 cohort |
Students were labeled as graduates if they were flagged as having completed enrollment through the final examination. Test participants without this flag were labeled as dropouts. In addition, for each test occasion, we recorded whether that test became the student’s final attempt, enabling analysis of withdrawal timing. We utilized anonymized data provided by the cram school. The use of this data underwent internal review and approval by the partnering cram school and the institution and was handled in strict compliance with relevant privacy guidelines.
Assessment Timeline and Subjects
The assessment sequence consisted of four Grade 7 diagnostic tests, transitional mock examinations at grade boundaries (e.g., “new Grade 8” and “new Grade 9”), and multiple Grade 8–9 high school entrance mock tests. Each test included subject-level scores and standardized deviation scores for Native language, Mathematics, and English, as well as overall averages.
This repeated assessment structure enabled us to model not only performance levels but also longitudinal achievement dynamics across critical transitional periods in lower secondary education.
Feature Engineering
Rather than relying solely on raw test scores, we engineered interpretable features designed to capture students’ longitudinal achievement dynamics. Feature design was conducted in close consultation with practitioners to ensure pedagogical relevance and operational usability in real educational settings.
In total, 98 features were engineered from subject-wise scores and standardized deviation scores across test occasions. These features fall into several conceptual categories, summarized with representative examples in Table 2.
Key feature categories include:
- Recovery-related indicators, measuring how efficiently a student’s performance rebounds after a decline (e.g., score recovery efficiency).
- Trend-based indicators, capturing the direction, slope, and instability of longitudinal change (e.g., linear regression slopes and directional change ratios).
- Consistency indicators, representing the proportion of changes occurring in the same direction over time.
- Distributional indicators, such as proportions of high scores (>80), passing scores (>60), and low scores (<40).
- Relative strength indicators, quantifying subject-wise performance relative to a student’s overall average.
For example, recovery efficiency quantifies how effectively a student returns to their individual mean performance following a score decrease, while directional change ratio reflects instability in achievement trajectories caused by frequent switches between improvement and decline.
| Description | Representative examples |
|---|---|---|
Recovery-related | Ability to rebound after performance decline | Score recovery efficiency (Native language, Mathematics) |
Trend-based | Direction and stability of longitudinal change | Linear slope, directional change ratio |
Consistency | Stability of improvement or decline | Trend consistency ratio |
Distributional | Performance level distribution | High-score ratio (>80), low-score ratio (<40) |
Relative strength | Subject-wise relative performance | Subject mean / overall mean |
Modeling Approach
We formulated dropout prediction as a supervised binary classification task. Specifically, we employed the Random Forest algorithm [2], which is widely used in educational data mining for its robustness to overfitting and interpretability. The Random Forest model was implemented using standard hyperparameter settings, including 100 decision trees (n_estimators = 100). Hyperparameters were selected through grid search on the training cohort to optimize predictive performance while avoiding overfitting. To examine the trade-off between prediction timing and performance, we constructed three models that differed in the length of available longitudinal data:
Model 1: Grade 7 Test 1 to Grade 9 Test 6
Model 2: Grade 7 Test 1 to Grade 9 Test 4
Model 3: Grade 7 Test 1 to Grade 9 Test 3
These models correspond to different potential intervention points, with earlier models providing more time for support but less complete information.
Models were trained using the 2024 graduating cohort and evaluated using accuracy and F1-scores for both graduates and dropouts. Because dropout detection is of primary operational importance and the classes are imbalanced, particular emphasis was placed on the dropout F1-score when comparing models.
Validation Procedure and Evaluation Metrics
To assess generalizability, all models were validated on an independent 2025 graduating cohort. Because feature computation required a minimum of three test participations, the evaluation sample size varied slightly across models, as summarized in Table 1.
Performance was evaluated using accuracy, precision, recall, and F1-scores for both classes. For the selected model, we additionally report a confusion matrix to clarify precision–recall trade-offs relevant to operational deployment.
Model Selection Criterion
Model selection was based on three criteria:
1). predictive performance, particularly dropout F1-score;
2) prediction timing, enabling intervention before the final academic year; and
3) operational interpretability for practitioners.
Based on these criteria, Model 2 was selected as the most suitable for real-world deployment, achieving strong predictive performance while enabling sufficiently early identification of at-risk students.
Results
Model Comparison and External Validation
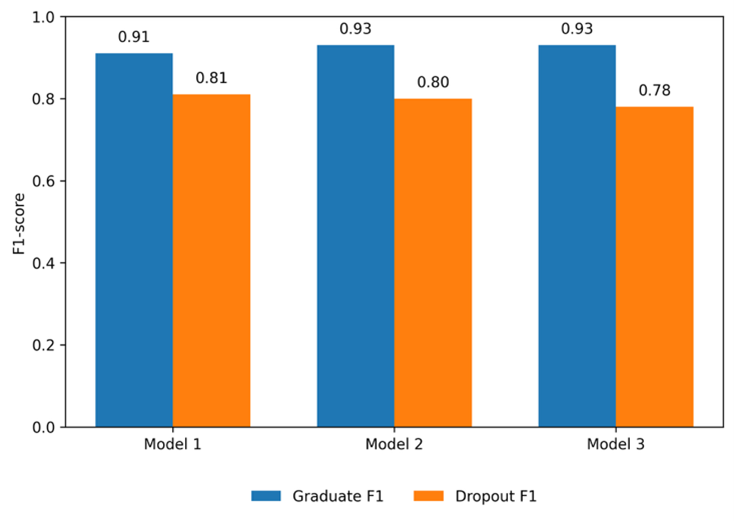
Table 3 summarizes the performance of the three dropout prediction models evaluated on the independent 2025 cohort. All models achieved high overall accuracy, ranging from 88.2% to 89.5%, demonstrating that longitudinal test performance data can support reliable dropout prediction at scale.
Model | Data used | Accuracy | Graduate F1 | Dropout F1 |
|---|---|---|---|---|
Model 1 | Grade 7 Test 1 – Grade 9 Test 6 | 88.2% | 0.91 | 0.81 |
Model 2 | Grade 7 Test 1 – Grade 9 Test 4 | 89.5% | 0.93 | 0.80 |
Model 3 | Grade 7 Test 1 – Grade 9 Test 3 | 89.1% | 0.93 | 0.78 |
Among the three models, Model 2, which used test data from Grade 7 Test 1 to Grade 9 Test 4, achieved the best balance between predictive performance and early identification. Specifically, Model 2 attained an accuracy of 89.5%, a graduate F1-score of 0.93, and a dropout F1-score of 0.80. While Model 1 achieved comparable performance, it relied on a longer observation period extending to the final Grade 9 test, limiting its usefulness for early intervention. In contrast, Model 3 enabled earlier prediction but exhibited a lower dropout F1-score, indicating reduced sensitivity for identifying at-risk students.
Figure 1 visualizes this trade-off between prediction timing and predictive performance across the three models. The results indicate that incorporating test data up to Grade 9 Test 4 is sufficient to achieve strong performance while still allowing institutions to intervene before the final academic year.
Operational Performance of the Selected Model
To examine the practical implications of deployment, we further analyzed the operational performance of Model 2, focusing on precision–recall trade-offs relevant to real-world intervention. As shown in Table 3, Model 2 achieved a dropout precision of approximately 81% and a dropout recall of approximately 80%, indicating that the majority of students identified as high risk indeed withdrew, while a substantial proportion of actual dropouts were successfully detected.
From an operational perspective, this balance suggests that the model can be used to prioritize support resources toward students most likely to disengage, without overwhelming instructors with excessive false positives. Importantly, the model maintained high graduate recall, ensuring that students likely to remain enrolled were not systematically misclassified.
Feature Importance and Interpretability
To better understand why the models achieved strong predictive performance, we examined feature importance and group-level differences between graduates and dropouts. Across all models, recovery-related indicators consistently ranked among the most influential predictors.
In particular, score recovery efficiency in Native language and Mathematics emerged as the top-ranked features in Model 2. Graduates showed substantially higher recovery efficiency than dropouts, indicating that their performance was more likely to rebound after temporary declines. For example, the mean recovery efficiency in Native language was 0.84 for graduates compared to 0.60 for dropouts, with a similar pattern observed in Mathematics. Differences across the top-ranked features were statistically significant (p < .01, independent samples t-test). Assumptions of normality were considered acceptable given the large sample size.
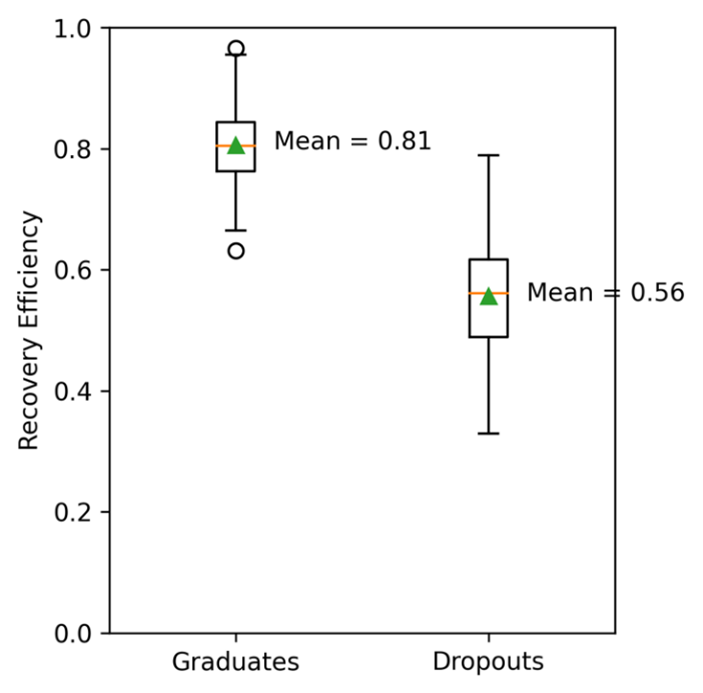
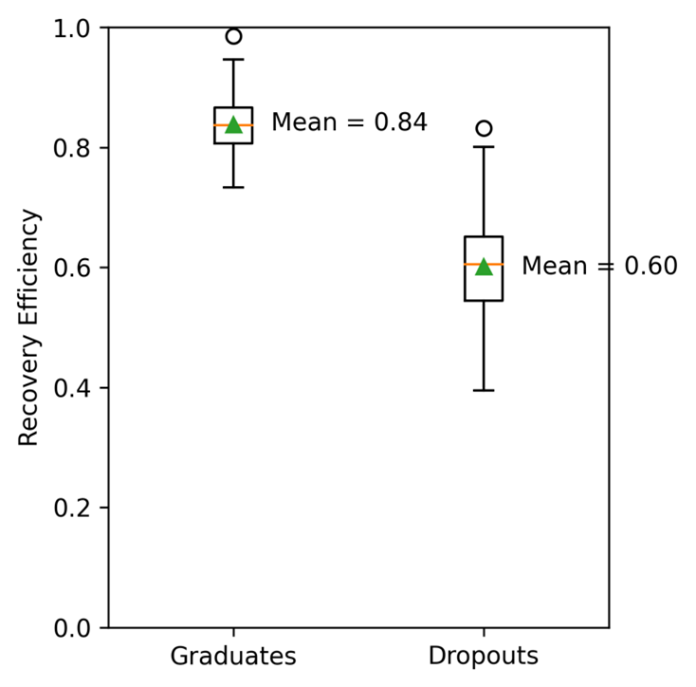
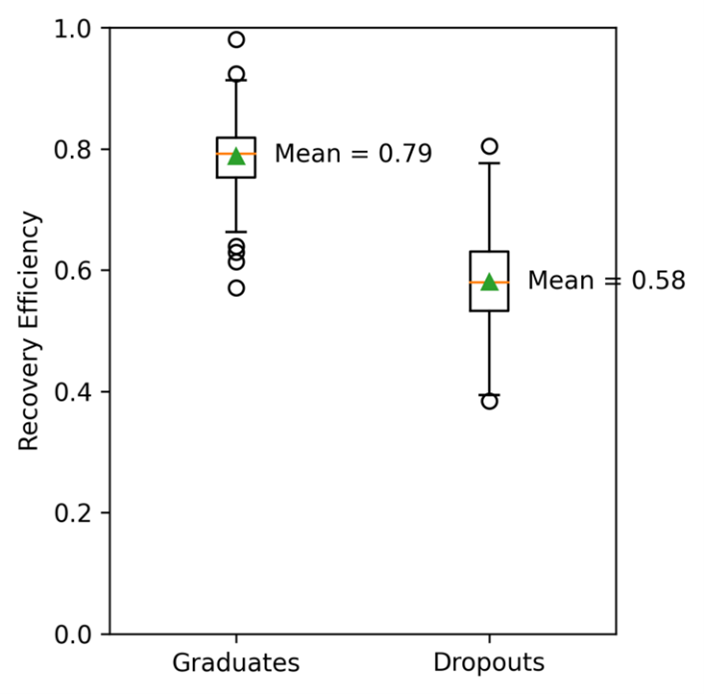
Figures 2, 3, and 4 presents the distributions of score recovery efficiency for graduates and dropouts across three core subjects. In Mathematics (Figure 2), graduates showed higher recovery efficiency (Mean = 0.81) compared with dropouts (Mean = 0.56). Similarly, In Native language (Figure 3), graduates exhibited substantially higher recovery efficiency (Mean = 0.84) than dropouts (Mean = 0.60). The same pattern was observed in English(Figure 4), where graduates again demonstrated higher recovery efficiency than dropouts. These group differences indicate that the ability to recover after declines is strongly associated with continued enrollment.
Beyond Absolute Performance Levels
Notably, absolute achievement levels alone were less predictive than longitudinal performance dynamics. Several trend-based features, such as continuous negative deviation slopes and high directional change ratios, were also associated with increased dropout risk. These findings suggest that instability and sustained decline, rather than low scores per se, play a critical role in student disengagement. This emphasis on achievement dynamics aligns with practitioners’ observations that students who struggle to recover from setbacks are more likely to lose motivation and eventually withdraw, even if their overall performance remains near average.
Summary of Key Findings
In summary, the results show that:
(1) dropout prediction using longitudinal test data generalizes well across cohorts (Table 3, Figure 1)
(2) Model 2 provides an effective balance between early prediction and dropout detection performance (Table 3, Figure 1)
(3) interpretable indicators capturing recovery from performance declines consistently differentiate graduates from dropouts across Native language, Mathematics, and English (Figures 2, 3, and 4). Together, these findings support the practical applicability of the proposed approach for early identification and intervention in large-scale supplementary education settings.
discussion
Practical Implications for Supplementary Education Providers
This study demonstrates that longitudinal standardized test data, which are routinely collected in large-scale supplementary education settings, can be leveraged to build accurate and interpretable dropout prediction models. Unlike prior educational data mining studies that primarily rely on digital learning logs, our approach utilizes offline test records, making it directly applicable to institutions where learning activity logs are limited or unavailable.
The selected model (Model 2) achieved strong predictive performance while enabling identification of at-risk students before the final academic year (Table 3, Figure 1). From an operational perspective, this timing is critical: interventions initiated after Grade 9 Test 4 still allow sufficient time for academic counseling, motivational support, or tailored instructional planning. The achieved balance between dropout precision and recall indicates that the model can guide resource allocation without overwhelming instructors with excessive false positives.
These results suggest that supplementary education providers can integrate predictive analytics into existing assessment infrastructures with minimal additional data collection burden. In practice, this supports data-driven early-warning systems that prioritize students requiring attention, thereby improving retention and educational outcomes.
Interpretability and Educational Meaning of Recovery Efficiency
Beyond predictive performance, an important contribution of this study lies in the interpretability of the proposed features. Across all subjects, recovery efficiency consistently distinguished graduates from dropouts (Figures 2–4), indicating that resilience to academic setbacks is a central factor associated with continued enrollment. Notably, absolute achievement levels alone were less informative than performance dynamics, aligning with practitioners’ observations that disengagement often follows repeated failures to rebound from declines rather than single low test scores.
This finding offers actionable insights for educators. Students with persistently low recovery efficiency may benefit from targeted interventions focusing on study strategies, self-regulation, or motivational support. Thus, the model does not merely predict dropout risk but also provides interpretable indicators that inform the design of individualized support measures.
Contribution to Industry-Oriented Educational Data Mining
From an industry-oriented EDM perspective, this work contributes a real-world case study demonstrating how predictive modeling can be embedded into commercial educational operations at scale. The dataset spans over 3,000 students across three academic years, and the models were validated on an independent graduating cohort, addressing a common limitation of prior studies that rely on single-cohort evaluation.
Furthermore, the feature engineering strategy—summarized in Table 2—offers a reusable framework for institutions seeking to derive meaningful predictors from longitudinal assessment data. The emphasis on recovery-related and trend-based features highlights the value of modeling temporal learning trajectories, extending beyond traditional snapshot-based performance indicators.
limitations and future work
Several limitations should be acknowledged. First, the present analysis focuses primarily on longitudinal test performance data and does not incorporate behavioral or attitudinal measures such as attendance records, homework completion, or survey-based motivation indicators. Integrating multimodal data sources, including digital learning logs and other behavioral traces, may further enhance predictive performance and provide richer explanatory insights into student disengagement processes. In addition, the dataset includes students whose final outcomes were not fully observed at the time of analysis. These cases may be considered as right-censored data, which could introduce uncertainty in the definition of dropout status.
Second, while the current models generalize across cohorts within a single institution, external validation across different supplementary education providers remains an important direction for future research. Institutional differences in curricula, testing schedules, or instructional policies may influence feature distributions and model transferability. In addition, ensuring the reproducibility of the proposed feature engineering procedures and modeling pipeline across diverse institutional contexts will be essential for broader deployment and comparative evaluation[9].
Finally, the present study examines prediction at discrete test intervals. Future work may explore continuous risk monitoring frameworks that update predictions as new assessments become available, enabling more adaptive intervention strategies [10]. Such extensions could also incorporate fine-grained learning logs [11][12], where available, to complement test-based indicators and support more responsive early-warning systems.
Conclusion
This industry paper presented a real-world application of dropout prediction in large-scale supplementary education using longitudinal standardized test data. By engineering interpretable features capturing achievement dynamics and validating models on an independent cohort, we demonstrated that early identification of at-risk students can be supported using routinely collected assessment records. The selected model achieved stable predictive performance while enabling intervention before the final academic year.
Beyond predictive accuracy, the analysis indicated that recovery efficiency after performance declines is consistently associated with student persistence across Native language, Mathematics, and English. This insight offers practical guidance for designing targeted academic support.
While several limitations remain and further validation across institutions and data modalities is needed, the proposed approach illustrates how existing assessment infrastructures can be adapted into practical early-warning systems, contributing operational value for educational service providers and methodological insights for industry-oriented educational data mining.
ACKNOWLEDGMENTS
This research is supported by Eishinkan, Co. Ltd, and Smart Learning Environment Design Research Unit at Kyushu University.
REFERENCES
- Gökhan Akçapınar, Adnan Altun, and Petek Aşkar. 2019. Using Learning Analytics to Develop Early Warning Systems for At-Risk Students. International Journal of Educational Technology in Higher Education 16, 40 (2019). https://doi.org/10.1186/s41239-019-0172-z
- Leo Breiman. 2001. Random Forests. Machine Learning 45, 1 (2001), 5–32. https://doi.org/10.1023/A:1010933404324
- Jae Young Chung and Sunbok Lee. 2019. Dropout early warning systems for high school students using machine learning. Children and Youth Services Review 96 (2019), 346–353. https://doi.org/10.1016/j.childyouth.2018.11.030
- Tianqi Chen and Carlos Guestrin. 2016. XGBoost: A Scalable Tree Boosting System. In Proceedings of the 22nd ACM SIGKDD International Conference on Knowledge Discovery and Data Mining (KDD ’16). ACM, 785–794. https://doi.org/10.1145/2939672.2939785
- Menna Fateen and Tsunenori Mine. 2021. Predicting Student Performance Using Teacher Observation Reports. In Proceedings of the 14th International Conference on Educational Data Mining (EDM 2021). International Educational Data Mining Society, pp.481-486.
- Jerome H. Friedman. 2001. Greedy Function Approximation: A Gradient Boosting Machine. The Annals of Statistics 29, 5 (2001), 1189–1232. https://doi.org/10.1214/aos/1013203451
- Scott M. Lundberg and Su-In Lee. 2017. A Unified Approach to Interpreting Model Predictions. In Advances in Neural Information Processing Systems 30, I. Guyon, U. Von Luxburg, S. Bengio, H. Wallach, R. Fergus, S. Vishwanathan, and R. Garnett (Eds.). Long Beach, CA, USA. Curran Associates, Inc., pp. 4768 - 4777.
- Matti Vaarma and Hongxiu Li. 2024. Predicting student dropouts with machine learning: An empirical study in Finnish higher education. Technology in Society 76 (2024), Article 102474. https://doi.org/10.1016/j.techsoc.2024.102474
- Misato Oi, Masanori Yamada, Fumiya Okubo, Atsushi Shimada, and Hiroaki Ogata. 2017. Reproducibility of findings from educational big data: a preliminary study, Proceedings of the seventh international learning analytics & knowledge conference, 2017, p536-537.
- Fumiya Okubo, Sachio Hirokawa, Misato Oi, Chengjiu Yin, Atsushi Shimada, Kentaro Kojima, Masanori Yamada, and Hiroaki Ogata. 2016. Learning Activity Features of High Performance Students, In Proceedings of the 1st International Workshop on Learning Analytics Across Physical and Digital Spaces (Cross-LAK 2016), pp. 28–33.
- Masanori Yamada, Xuewang Geng, Min Lu, and Yuta Taniguchi. 2024. Exploring the Role of Metacognition in Enhancing Learning Outcomes through Learning Analytics Dashboard. In eLearn: World Conference on EdTech. Association for the Advancement of Computing in Education (AACE). pp. 294-301
- Masanori Yamada, Xuewang Geng, Yoshiko Goda, and Stephanie D. Teasley. 2024. Investigating Metacognitive Behaviors with Online Learning Support Tools, In Proceedings of IEEE ICALT 2024, pp. 280-284
© 2026 Copyright is held by the author(s). This work is distributed under the Creative Commons Attribution-NonCommercial-NoDerivatives 4.0 International (CC BY-NC-ND 4.0) license.