ABSTRACT
Pattern mining techniques are widely used in Educational Data Mining to uncover meaningful patterns in learner behaviors, discourse, and learning processes. However, a range of metrics is used to quantify pattern strength, often producing different conclusions. In this study, we systematically compare popular metrics from Association Rule Mining, Sequential Pattern Mining, Epistemic Network Analysis (ENA), and Ordered Network Analysis (ONA) by examining (a) similarities in the patterns highlighted by each method and metric, (b) their associations with validated external measures of learning and motivation, and (c) expert ratings of theoretical alignment and perceived interestingness. Our results reveal two clusters of metrics: one emphasizing frequent, common, and theoretically expected patterns (Support, Confidence, Cosine, Jaccard, and ENA/ONA connection weights), and another emphasizing less frequent patterns driven more by statistical dependence than by prevalence (e.g., Added Value, Conviction, the Phi coefficient, and Lift). This second group is sometimes rated as more interesting but is less theoretically aligned. Our findings suggest that combining multiple metrics and methods can provide complementary perspectives, either reinforcing conclusions when results converge or signaling the need for deeper investigation when they diverge. Doing so can help us to better understand complex learning processes and their relationships with educational outcomes.
Keywords
INTRODUCTION
A strength of the Educational Data Mining (EDM) community is the diverse range of modeling approaches and algorithms it employs, often to study the same phenomena. One area where this is the case is pattern mining techniques such as Association Rule Mining (ARM; [1]), which have been widely applied to uncover interpretable patterns in student behaviors, problem-solving actions, and learning processes [11, 20, 22, 24].
ARM techniques aim to identify implication rules of the form X→Y that capture relationships among events, items, or discrete variable values based on their co-occurrence in data [1]. To achieve this, ARM employs a range of methods to mine potentially meaningful patterns [21], along with metrics to assess which patterns merit further analysis or consideration [19, 33]. Each of these metrics emphasizes different aspects of these patterns, such as their frequency (Support) or conditional reliability (Confidence). Others highlight associations that deviate from expectations under statistical independence (Lift and Cosine) and capture the extent to which the occurrence of one event increases the likelihood of another beyond its base rate (Added Value). The choice of metric influences which patterns are identified and how they are interpreted, particularly in applied domains such as EDM, where interpretability and relevance to learning processes are central.
More recently, Epistemic Network Analysis (ENA; [27]) has emerged as an alternative approach for discovering important relationships between discrete variable values. Initially developed to study thematic complexity in discourse data, ENA models learning processes by counting patterns of co-occurrence and applying cosine normalization (distinct from the Cosine similarity metric used in ARM) to estimate the strength of connections between codes, while accounting for differences in discourse length or interaction volume across the students or groups being analyzed [7, 27]. A key strength of ENA lies in its network representations, which support visual interpretation of complex relationships among codes and facilitate exploratory analyses of learning processes. However, the quantification of ENA patterns is typically achieved by comparing its Connection Weights, which are conceptually similar to ARM’s Support. Unlike other ARM metrics such as Cosine, Lift, or Added Value, ENA Connection Weights do not explicitly normalize for the base rates of individual codes. As a result, ENA may prioritize patterns involving more prevalent codes, while potentially obscuring stronger and more informative associations among less frequent codes.
ARM and ENA each have many variants, including widely used variants that extend their base approach to explicitly account for the temporal order of events or codes. For ARM, the most popular extension is Sequential Pattern Mining (SPM; [2]) and for ENA, it is Ordered Network Analysis (ONA; [34]). While these variants enable the analysis of sequential patterns rather than only unordered co-occurrences, they largely inherit the conceptual strengths and limitations of their underlying methods, including how associations are quantified, normalized, and ultimately interpreted.
The existence of multiple analytic approaches to analyzing the relationship between discrete variable values raises an important question for educational researchers: What method do I use? Each of these algorithms and metrics within it seeks to quantify the strength/importance of connections in data, but it is not clear which is most likely to yield meaningful and useful conclusions about learning processes.
Prior work in EDM has attempted to address this question by comparing different ARM metrics against patterns deemed relevant by human experts, in order to assess which metrics reveal patterns that are most meaningful in educational contexts. For example, Merceron and Yacef [19] examined four ARM metrics in a small-scale case study of student assessment data, arguing in favor of metrics that are intuitive for educators and robust to limited data. Their results highlight base-rate-adjusted metrics (i.e., Cosine and Lift) as especially suitable for educational applications.
Building on this work, Bazaldua et al. [5] asked human experts to evaluate the importance of a range of 21 ARM metrics. Specifically, they asked the human raters which patterns were theoretically aligned and interesting (to the human raters). They found that Phi coefficient, Conviction, and Jaccard were among the strongest predictors of human judgments. However, Jaccard, Phi, Conviction, and 16 other metrics were actually negatively associated with human ratings of interestingness. This finding demonstrates the complexity of identifying patterns that researchers genuinely find interesting, rather than patterns that merely reflect expected relationships, yielding accurate but ultimately trivial conclusions.
These studies investigated expert judgments about the importance and interestingness of the identified patterns but did not evaluate how useful the patterns were in terms of research findings. An alternative and complementary approach to those used in prior studies is therefore to assess discovered patterns in terms of whether they are related to external measures of key educational constructs, such as situational interest, self-efficacy, learning gains, and other motivational or cognitive variables. We can then ask human experts to evaluate not only the patterns themselves but also the identified associations. Accordingly, this study extends prior work by addressing the following research questions: (RQ1) which pattern mining methods, and strategies for aggregating connections or sequences, are most effective at identifying patterns among coded events that are associated with external measures of learning and motivation, and (RQ2) which of the metrics produces associations to external measures of learning and motivation that are meaningful to domain experts? This approach enables an explicit comparison of pattern mining methods not only in terms of what domain experts find interesting, but also what they find important, namely, their consequential validity.
RELATED WORK
Association Rule Mining
Association Rule Mining (ARM) is a data mining technique used to identify associations among items, events, or codes in large datasets [1]. ARM seeks to discover rules expressed as implication statements of the form X→Y, where the antecedent (X) consists of one or more conditions whose occurrence is associated with an increased likelihood of the consequent (Y). For example, a rule identified through ARM might indicate that when a student visits a point of interest and uses a scientific tool to measure a physical variable (antecedent), the student is likely to make a scientific observation (consequent). Importantly, the antecedent-consequent relationship in ARM does not imply temporal order. In this example, the scientific observation may have occurred before the tool use or the visit to the point of interest. Rather than modeling a sequence of events, ARM captures conditional relationships among sets of events or constructs.
Sequential Pattern Mining (SPM) extends ARM by explicitly incorporating temporal order into the discovery of patterns [2]. Rather than identifying unordered co-occurrences, SPM focuses on discovering frequent sequences of events in which antecedent events must temporally precede consequent events within a specified temporal window, transaction, or conversation. This makes SPM particularly suitable for modeling processes that unfold over time, such as learning trajectories or sequences of student actions. For example, SPM could be used to evaluate whether a visit to a point of interest and scientific tool use (antecedent) temporally precedes the student’s scientific observation (consequent).
In the EDM literature, both ARM and SPM have been used in a range of projects. ARM has been used to identify patterns of student actions within learning management systems, such as combinations of content access and assessment activities, which were then examined to better understand differences between high- and low-performing students [24]. Similarly, Hwang et al. [11] applied ARM to show that students who struggled with foundational concepts were more likely to fail subsequent, dependent items. SPM has been used to capture the temporal structure of learning and collaboration. For example, Perera et al. [23] analyzed trace data from student teams working in a professional software development environment and identified distinct temporal patterns of tool use and interaction associated with effective coordination, leadership, and task management. Martínez et al. [17] applied SPM to interaction traces from student collaborations using a shared interactive tabletop. Their analysis revealed systematic differences associated with group achievement: successful groups engaged in parallel, discussion-rich interactions and actively externalized their thinking, whereas lower-achieving groups tended to interact sequentially with the same resources.
Kinnebrew et al. [12] extended SPM by proposing Differential Sequence Mining, an exploratory pattern mining approach designed to identify activity sequences that occur differentially across groups or phases of learning. Applied to interaction data from an intelligent tutoring system, this method revealed that high-performing students more frequently engaged in monitoring behaviors, such as assessing their progress and reflecting on recent actions. Overall, this body of work demonstrates the value of ARM and SPM in revealing interpretable temporal patterns in learning data that support a deeper understanding of diverse learning processes.
Interestingness Metrics
In ARM and SPM, patterns can be discovered using several methods [21]. The choice of method depends on the type of patterns researchers aim to highlight (e.g., ordered sequences of events or co-occurrences within a specific time window) [21], as well as the computational resources required for different data sizes and the size of the candidate itemset space (i.e., the number of possible combinations of events or codes that can be formed from the available set of items) [16].
Across these methods, the discovery process typically involves identifying frequent itemsets—sets of events or codes that co-occur within the units of analysis (e.g., student study sessions, problem attempts, or conversations)—based on a minimum Support threshold. Support measures how frequently a rule or pattern occurs in the dataset and is defined as the proportion of transactions or instances in which both the antecedent (X) and the consequent (Y) appear together (P(XY)). As such, Support captures prevalent or common patterns, favoring rules that represent behaviors or events that occur frequently.
After identifying itemsets with high Support (i.e., frequent co-occurrence), implication rules of the form X→Y are generated and evaluated using a variety of metrics that quantify different aspects of the relationship between the antecedent (X) and the consequent (Y). The most commonly used metric is Confidence, which estimates the conditional probability of observing the consequent given the antecedent, P(Y∣X). As such, it emphasizes conditional reliability, or how consistently the occurrence of X is associated with the occurrence of Y. Confidence-based rules capture asymmetric relationships and are particularly useful for identifying cases in which one behavior reliably accompanies another, even when the reverse association does not hold.
Though widely used, Support and Confidence also have well-documented limitations [19]. For example, while high Support characterizes dominant or typical behaviors, it may overlook less frequent but potentially meaningful patterns. Similarly, Confidence does not account for the overall frequency of the consequent and may therefore overestimate the strength of associations involving high-frequency events or codes.
To address these limitations, a range of so-called interestingness metrics, explicitly normalize association rules by the marginal frequencies (base rates) of the antecedent and/or consequent [33]. Metrics such as Cosine capture the similarity between the occurrence vectors of X and Y by normalizing their joint frequency by the geometric mean of their individual frequencies, thereby emphasizing the strength of association while reducing the influence of highly frequent events. Similarly, Lift compares the observed co-occurrence of X and Y with what would be expected if they were statistically independent, highlighting associations that are stronger than chance. Added Value also measures the extent to which the occurrence of X increases the likelihood of Y beyond its baseline probability. More broadly, Tan et al. [33] catalogued more than twenty such metrics, all designed to surface non-trivial or surprising patterns that may be less frequent but more informative about underlying learning processes.
Among these metrics, Merceron and Yacef [19] recommend Lift, Added Value, and Cosine as especially suitable metrics for educational data, after first filtering out rules with low Support and Confidence. They argue that these metrics are intuitive for non-data-mining experts (e.g., teachers or school administrators) while remaining informative for identifying non-trivial associations. At the same time, they emphasize that no single metric is sufficient for identifying pedagogically meaningful rules. Different metrics surface different types of patterns—such as frequent behaviors, reliable conditional relationships, or associations that stand out relative to overall frequency—and their usefulness depends both on the research goal and on the interpretability of the resulting rules for educators and researchers. Accordingly, they emphasize the need to compare rules across multiple metrics to obtain a more nuanced view of learner behavior and to support more robust and meaningful conclusions.
Motivated by this need to identify which of the many available interestingness metrics are most informative for educational stakeholders, Bazaldua et al. [5] conducted a systematic comparison of a wide range of metrics using interaction data focused on affective states and learner behaviors in an educational platform, together with ratings provided by three domain experts familiar with the learning context. In their study, a large set of association rules was first generated from student interaction logs and filtered using minimum Support and Confidence thresholds. The experts then rated the interestingness of each rule using a Likert scale, providing a human benchmark against which rankings of rules induced by different interestingness metrics could be compared. The authors evaluated not only Cosine, Lift, and Added Value, but also several additional metrics—including the Phi coefficient, Conviction, and Jaccard—drawn from the set of metrics compiled by Tan et al. [33]. Their results showed that multiple metrics were predictive of expert judgments, with metrics such as the Phi coefficient, Conviction, and Jaccard exhibiting stronger alignment with human ratings. However, only Lift showed a positive association with expert judgments across the 21 evaluated metrics, while most showed significant negative associations. This finding highlights that what human analysts consider interesting may differ substantially from what interestingness metrics prioritize.
Epistemic Network Analysis
Epistemic Network Analysis (ENA; [27]) is a technique used in the quantitative ethnography (QE) community to model the structure of relationships among a set of theoretically meaningful constructs or codes. ENA has been applied across a wide range of contexts, including analyses of learning processes in digital learning environments [28], task performance [25], gaze patterns [3], team communication [31], social media interactions [9], and video game player behavior [39].
ENA operationalizes relationships among constructs by quantifying their co-occurrence within segments of coded data, typically organized into conversations or horizons (analogous to transactions in ARM and SPM) and aggregated across learners, groups, or tasks. Connections between constructs are accumulated using a moving window that links codes appearing in the same or recent prior lines of discourse, thereby capturing local temporal proximity without imposing strict sequential constraints [7, 27]. These co-occurrence counts are aggregated for each unit of analysis (e.g., learners or groups), then normalized using cosine or spherical normalization (distinct from the Cosine interestingness metric used in ARM) to account for differences in the amount of coded data across units. Finally, dimensionality reduction techniques are applied to project the resulting normalized vectors into a two-dimensional space, facilitating statistical and visual comparison across units and groups.
In ENA visualizations, each unit of analysis is represented both as a weighted network graph and as a point in a two-dimensional space corresponding to the network’s centroid (or mean). In these network representations, nodes correspond to events or constructs used to code the data, and edges represent the relative strength of co-occurrence between pairs of constructs. Spatial proximity between constructs should not be interpreted as a direct measure of association strength. In ENA, node positions are derived from the overall structure of variance in the network space, so constructs that appear closer together may reflect similar contributions to the underlying dimensions rather than consistently stronger co-occurrence. On the other hand, the relative positions of constructs and unit centroids are interpretable, as they reflect which constructs and connections most characterize a given unit’s network. For example, if a student i is positioned closer to construct A than to construct C, it indicates that the interaction patterns associated with student i more strongly involve construct A. In this way, differences in the positions of units of analysis can also be interpreted as differences in their underlying connection patterns, enabling researchers to compare individual networks, group means, and network differences within a shared analytical space (acknowledging the limitations inherent to any dimensionality reduction).
ENA’s primary strength lies in its ability to represent and compare complex patterns of pairwise associations among multiple constructs in rich, temporally indexed data, while maintaining a strong emphasis on interpretability through visual representations. However, ENA also embodies specific analytic assumptions that shape the types of patterns it can reveal. Standard ENA models capture only pairwise (dyadic) associations and treat connections as symmetric, focusing on co-occurrence rather than conditional dependence. As a result, ENA connection weights tend to be highly correlated with the Support metric commonly used in frequency-based pattern mining approaches [38]. Consequently, ENA connection weights are subject to similar limitations as Support, which does not take into account the base rates of individual codes, and does not capture the nuances emphasized by conditional metrics (e.g., Confidence) or base-rate-adjusted metrics such as Cosine, Lift, Added Value, and related interestingness metrics.
Chronological ordering has been incorporated into the ENA framework through Ordered Network Analysis (ONA; [34]). Like SPM, this method constrains connections based on temporal precedence and thus distinguishes temporally between X→Y and Y→X. However, unlike Confidence and many interestingness metrics, ONA does not model these relationships in terms of conditional probability or statistical independence. Additionally, like ENA, ONA relies on co-occurrences as the primary mechanism for highlighting important patterns, and is thus also susceptible to identifying patterns that are driven primarily by high base rates rather than by genuine implication-based relationships between codes.
Contributions of this Study
Although ARM and SPM offer a wide range of interestingness metrics and support the identification of patterns involving three or more codes or events, it remains unclear whether all of these metrics and higher-order patterns (i.e., patterns involving three or more codes or events) meaningfully enhance interpretation in educational research. Methods such as ENA and ONA were developed to provide qualitative researchers with a quantitative framework for identifying meaningful patterns that can then be interpreted through domain expertise to “close the interpretative loop” and support robust, data-driven conclusions about educational phenomena [27]. Merceron and Yacef [19] argue that pattern mining should rely on metrics beyond Support, rather than primarily on co-occurrence-based measures such as those used in ENA. However, Bazaldua et al. [5] show that these alternative metrics do not necessarily align more closely with the patterns human researchers find interesting. This discrepancy reflects the challenge of defining what makes a pattern “interesting,” a term generally used without reflection in early mathematical work on interestingness metrics. Instead of relying on the term alone, we evaluate metrics based on whether the patterns they produce connect to validated external measures of important motivational and cognitive constructs. We then build on Bazaldua et al. [5] and ask domain experts to assess whether these associations (not only the patterns themselves) are meaningful and interesting. By doing so, we can better assess which metrics are most informative for educational research and for supporting the interpretative process.
METHODS
Educational Context
The dataset for this study was collected from eight 5-day summer camps conducted in 2024 and 2025 as part of the What if Hypothetical Implementations in Minecraft (WHIMC) project [13], and has been previously published in [40]. WHIMC uses Minecraft: Java Edition to engage learners in exploring hypothetical astronomy scenarios through “What if” questions (e.g., “What if Earth had no moon?” or “What if Earth orbited a colder sun?”). During the first three days of each camp, students, guided by pedagogical agents (NPCs) and human facilitators, evaluated the habitability of a range of hypothetical worlds and real exoplanets modeled in Minecraft. During the final two days, students explored a Mars map generated from real terrain data and designed shelters capable of sustaining human life.
During each camp, students completed twelve motivational and learning assessments (see Table 1). On day 1, they completed Boeder et al.’s [6] interest development scale and Gadbury’s [10] adaptation of LoPresto and Murrell’s [15] astronomy knowledge test. On day 3, students completed Gadbury’s [10] astronomy and Minecraft interest survey. On day 4, they completed Linnenbrink-Garcia et al.’s [14] situational interest scale and Britner and Pajares’ [8] self-efficacy scale, and they also repeated the day 1 instruments. Three surveys (situational interest, astronomy interest, and Minecraft interest) were not administered during the first camp; these instruments were added beginning with the second camp.
Instrument | Day | Camps | N |
|---|---|---|---|
Boeder et al.’s Interest Development | 1 | 8 | 104 |
Gadbury et al.’s Knowledge Assessment | 1 | 4 | 52 |
NSS Astronomy Knowledge Assessment 1 | 1 | 4 | 46 |
Camp-specific Knowledge Assessment | 2 | 3 | 31 |
Gadbury et al.’s Astronomy Interest | 3 | 7 | 82 |
Gadbury et al.’s Minecraft Interest | 3 | 7 | 82 |
Boeder et al.’s Interest Development | 4 | 7 | 88 |
Linnenbrink-Garcia et al.’s Situational Interest | 4 | 7 | 88 |
Britner & Pajares’ Self-efficacy | 4 | 8 | 101 |
Gadbury et al.’s Knowledge Assessment | 4 | 4 | 47 |
Camp-specific Knowledge Assessment | 4 | 4 | 44 |
NSS Astronomy Knowledge Assessment 2 | 4 | 4 | 43 |
The knowledge assessment was revised between the 2024 and 2025 camps to better align with core astronomy concepts. A second instrument, based on the National Science Standards (NSS; [26]), was introduced. This instrument assessed concepts addressed during camp activities (e.g., eclipses, tides, seasons, rotation speed, and orbital periods) on day 1, as well as students’ ability to transfer those concepts to constructs not covered during the camp on day 5. A separate knowledge assessment was also administered at the beginning of days 2 and 4 to evaluate concepts targeted in the exploration worlds; it was not administered on day 1, which was primarily devoted to orientation and familiarization with facilitators and the game environment rather than learning-focused activities. Normalized learning gains were calculated for each knowledge assessment as the ratio of a student’s observed improvement (or decline) to the maximum possible change [18].
A total of 118 students from urban and rural areas across four states participated in the summer camps. The sample included 72 male, 40 female, and 3 non-binary students, as well as 3 students who preferred not to disclose their gender. Participants self-identified as 44 White, 49 African American, 7 Hispanic/Latinx, 2 Native American, 10 Other, and 6 who preferred not to disclose their race/ethnicity. Participation was voluntary, and written assent and parental consent were obtained for all students. 13 students were excluded from the analyses because they did not complete any surveys or lacked recorded activity interaction logs on multiple days. No significant demographic differences were observed between the excluded and included participants.
Coding of Gameplay Log Data
Our current study uses previously coded data [40] from the first three days of the summer camp, during which students explored different “What if” worlds to identify physical variables, observe environmental changes, and assess potential human habitability. These days were selected because the worlds exhibit similar, scientifically-grounded behaviors, allowing a single codebook to be applied consistently across all three. The structured nature of these activities also supports greater consistency across camps held in different locations.
Students were free to explore the worlds at their own pace (moving quickly or slowly, independently or collaboratively) while observing areas of interest, measuring physical variables, and sharing observations with other players through written messages within the virtual environment. The interaction logs recorded each student’s X, Y, and Z coordinates every three seconds, along with the in-game commands used to carry out these actions. The codes (i.e., behavioral constructs) reported in [40] were derived from these log data and corresponded directly to seven observable student actions during the exploration period (see Table 2).
Code | Definitions |
|---|---|
Non-stopping/ Racing | The student has stopped for less than 6 seconds during the last minute. A stop corresponds to moving less than three blocks during a period of three seconds. |
Social Movement | The student was less than 20 blocks from another player during the entire last minute. |
Individual Movement | The student was more than 35 blocks away from any other player during the entire last minute. |
Point of Interest | The student is inside a point of interest for 10 seconds or more. Every 10 seconds within the Point of Interest trigger this code again. |
Talk to NPCs | The student is within 4 blocks or less of an NPC for 10 seconds or more. Every 10 seconds close to the NPC trigger this code again. |
Science Tool | The student uses a scientific tool to measure a physical variable. |
Scientific Observation | In-game observations in which students describe the virtual world, ask a science-related question, or attempt to comprehend scientific concepts (e.g., “Can humans survive without the moon?”). |
Whenever a student action met the definition of a code, a new utterance was created and coded under the corresponding category, with each utterance assigned to a single category. When actions could co-occur (e.g., using a tool while visiting a point of interest), two separate utterances were generated.
The threshold for the Non-Stopping code was established by examining the distributions of students’ movement speeds and stops, taking into account the three-second sampling interval of the location data. We defined the Non-Stopping code by the number of stops instead of rapid movement indicators because of the nature of the WHIMC learning environment, where students are expected to conduct activities that require brief pauses in movement (i.e., measure physical variables or make observations).
The threshold for the Individual Movement code was based on the maximum in-game field of view (35 blocks). For the Social Movement code, we used a distance of approximately half that value (20 blocks) to capture instances in which students were in close proximity to others, rather than merely observing them from a distance.
Points of Interest refer to specific in-game locations that students are expected to visit. A duration threshold of 10 seconds was selected for this code because 95% of visits to these areas lasted at least that long. Similarly, interactions with NPCs occur through text boxes that automatically appear when students are within 4 blocks of an NPC; this distance was therefore used as the threshold for defining the Talk to NPC code. The 10-second duration threshold for this code follows the same rationale used for the Points of Interest code.
Finally, the Scientific Observations code captures in-game written observations in which students describe aspects of the virtual world, pose science-related questions, or attempt to reason about scientific concepts. The dataset was manually coded by two human coders [40], who initially achieved strong interrater reliability (Cohen’s κ > 0.75) for each of the three subtypes of scientific observations (Description, Questioning, and Reasoning). For the purposes of [40], these subtypes were subsequently aggregated into a single code for analysis, a methodological decision we follow here.
Statistical Analysis Compared
In this study, we compare a range of metrics to determine how the choice between ARM and ENA-based methods might affect our results. We do so by applying metrics derived from these methods to the coded behavioral data and then comparing those results to the external knowledge and motivational variables. Specifically, for each identified rule or connection, we computed Spearman’s rank correlation coefficients (ρ) between the corresponding ENA connection weight or ARM metric and each external education-related measure. This analysis aimed to identify which pattern mining metrics most consistently highlighted patterns associated with constructs assessed using validated knowledge and motivation instruments.
Based on previous research [5, 19], we selected the following ARM and SPM metrics for analysis: Support, Confidence, Cosine, Lift, Added Value, Jaccard, Conviction, and the Phi coefficient. These metrics were analyzed alongside the Connection Weights generated by ENA and ONA.
For ENA and ONA, connections are computed using a moving-window approach with a stanza size of four instances, which is the most commonly used window size and aggregation method in the QE literature [30]. To ensure methodological consistency and facilitate comparability across approaches, the same window size is used to define transactions for ARM and SPM, following prior work that compared these methods [38].
Understanding each Pattern Mining Metric
To examine the similarity of results from different pattern mining methods and metrics, we first assess the associations among all metrics across both ARM- and ENA-based approaches over the full set of identified patterns. To this end, we employ a mixed-effects linear model comparing metric values across patterns and students. This approach was chosen over simple correlation analyses to account for the non-independence introduced by multiple patterns identified for the same student. In addition, all metrics were rank-transformed prior to analysis to enable the assessment of non-linear associations between them.
Six metrics examined in this study are inherently symmetric. Specifically, ARM Support, Jaccard, Cosine, Lift, Phi, and ENA Connection Weights assign one rule to both X→Y and Y→X. In contrast, three asymmetric metrics (i.e., Confidence, Added Value, and Conviction) can yield different values depending on the rule direction. All SPM and ONA metrics are also inherently asymmetric because they depend on temporal order. To facilitate comparisons between symmetric and asymmetric metrics, we split the symmetric rules into two rules (X→Y and Y→X) with identical numerical values.
To further understand the types of rules emphasized by each pattern mining method and metric, we conducted a complementary analysis. For each method, we identified the ten highest-ranked rules and computed five descriptive statistics for each rule. These statistics included the base rate (Support) of the antecedent, consequent, and their co-occurrence; the conditional probability of the consequent given the antecedent (equivalent to Confidence); and the ratio of the co-occurrence base rate to the individual base rates (equivalent to Lift). Because rules involving a single item naturally exhibit higher overall support and are not represented in ENA, this analysis was restricted to rules involving two distinct items or codes (three or more naturally exhibit lower support and are also not represented in ENA).
Connections with External Measures
For each metric and method, we counted the number of statistically significant correlations between pattern-level metrics (e.g., Support, Confidence, or ENA Connection Weights) and external knowledge or motivational measures. Importantly, the purpose of this analysis was not to interpret individual significant correlations but to compare how frequently different metrics and methods identified associations with external constructs. Accordingly, no correction for multiple comparisons was applied, because the count of significant associations served as a comparative indicator rather than as evidence supporting specific inferential claims.
ARM, SPM, ENA, and ONA differ in the number and types of patterns they can identify (e.g., ENA is limited to dyadic relations), which may inflate the number of significant associations with external measures for methods that generate larger pattern sets, such as ARM and SPM. However, after applying an initial filtering step that removed patterns with Support or Confidence below 0.05, a standard procedure recommended by Merceron and Yacef [19], all patterns involving rules with more than two codes were eliminated, indicating that such higher-order patterns were not common in this dataset. This result suggests that the observed differences in the number of significant associations across methods are not driven by ARM-based approaches identifying more complex patterns but rather reflect substantive differences in how each metric and method quantifies dyadic patterns.
The only adjustment made to the count of significant associations concerned the symmetric nature of certain metrics. As noted earlier, ARM Support, Jaccard, Cosine, Lift, Phi, and ENA Connection Weights assign identical values to the rules X→Y and Y→X. Consequently, these methods would be expected to yield approximately half as many significant associations as methods that distinguish between X→Y and Y→X (though not exactly half, due to significant correlations involving single-code patterns). For this reason, we treated X→Y and Y→X as separate rules when computing correlations, even for symmetric metrics where their numerical values were identical.
Additionally, patterns involving single events (i.e., marginal probabilities of individual codes) were included. For this type of pattern, ONA provides a comparable representation through self-transitions (X→X). In contrast, ENA and some ARM metrics, such as Conviction or Phi, do not offer directly analogous metrics for single-code rules, which may slightly reduce the number of significant associations identified by these methods. However, because this limitation is specific to those methods and metrics, and because single-event associations have substantial interpretive value for understanding direct relationships between individual codes and outcomes, these rules were retained.
Human Ratings of Pattern Importance
A large proportion of our analysis is based on metrics that do not involve human judgement, but instead describe other aspects of the patterns’ frequency, reliability, and non-randomness. These metrics, like the other measures in this study, are important for quantifiably describing patterns, but do not necessarily indicate whether those associations are meaningful to expert researchers. In both the EDM and QE communities, the goal is not merely to identify patterns, but to determine which observed patterns support meaningful conclusions [27]. In other words, we are interested in which research methods (or metrics) are most likely to lead to consequential validity [37].
Building on this perspective, we examine which of the statistically significant correlations highlighted by each technique are theoretically meaningful and relevant to researchers. As in previous research that has sought to distinguish ARM metrics of interestingness from human ratings of interestingness [5], we used a five-point Likert scale to evaluate both the theoretical alignment and the perceived interestingness of each identified correlation. Five educational researchers (all coauthors) independently rated the correlations while blinded to the pattern mining technique and metric that produced each result. All raters evaluated the same set of 203 statistically significant correlations, defined as those identified by at least one pattern mining method or metric. After completing the ratings, raters were also asked to describe their rationale for judging correlations as interesting.
The five ratings for each dimension were aggregated using a 40% trimmed mean, in which the highest and lowest ratings were discarded, and the remaining three were averaged. Trimmed means are a standard robust aggregation procedure that reduces the influence of outliers [36]. Finally, correlations falling in the top 10% for both interestingness and theoretical alignment were examined across pattern mining methods and metrics to determine which techniques identified these correlations and whether the methods agreed on the direction of the associations.
RESULTS
Method-Metric Similarity
We first consider how the observed associations among the different ARM- and ENA-based metrics compare to one another. Overall, the results show a general pattern of positive association across most metrics (Figure 1). However, important differences emerge between patterns that highlight simple frequency and those that account for base rate differences in the components of a pattern.
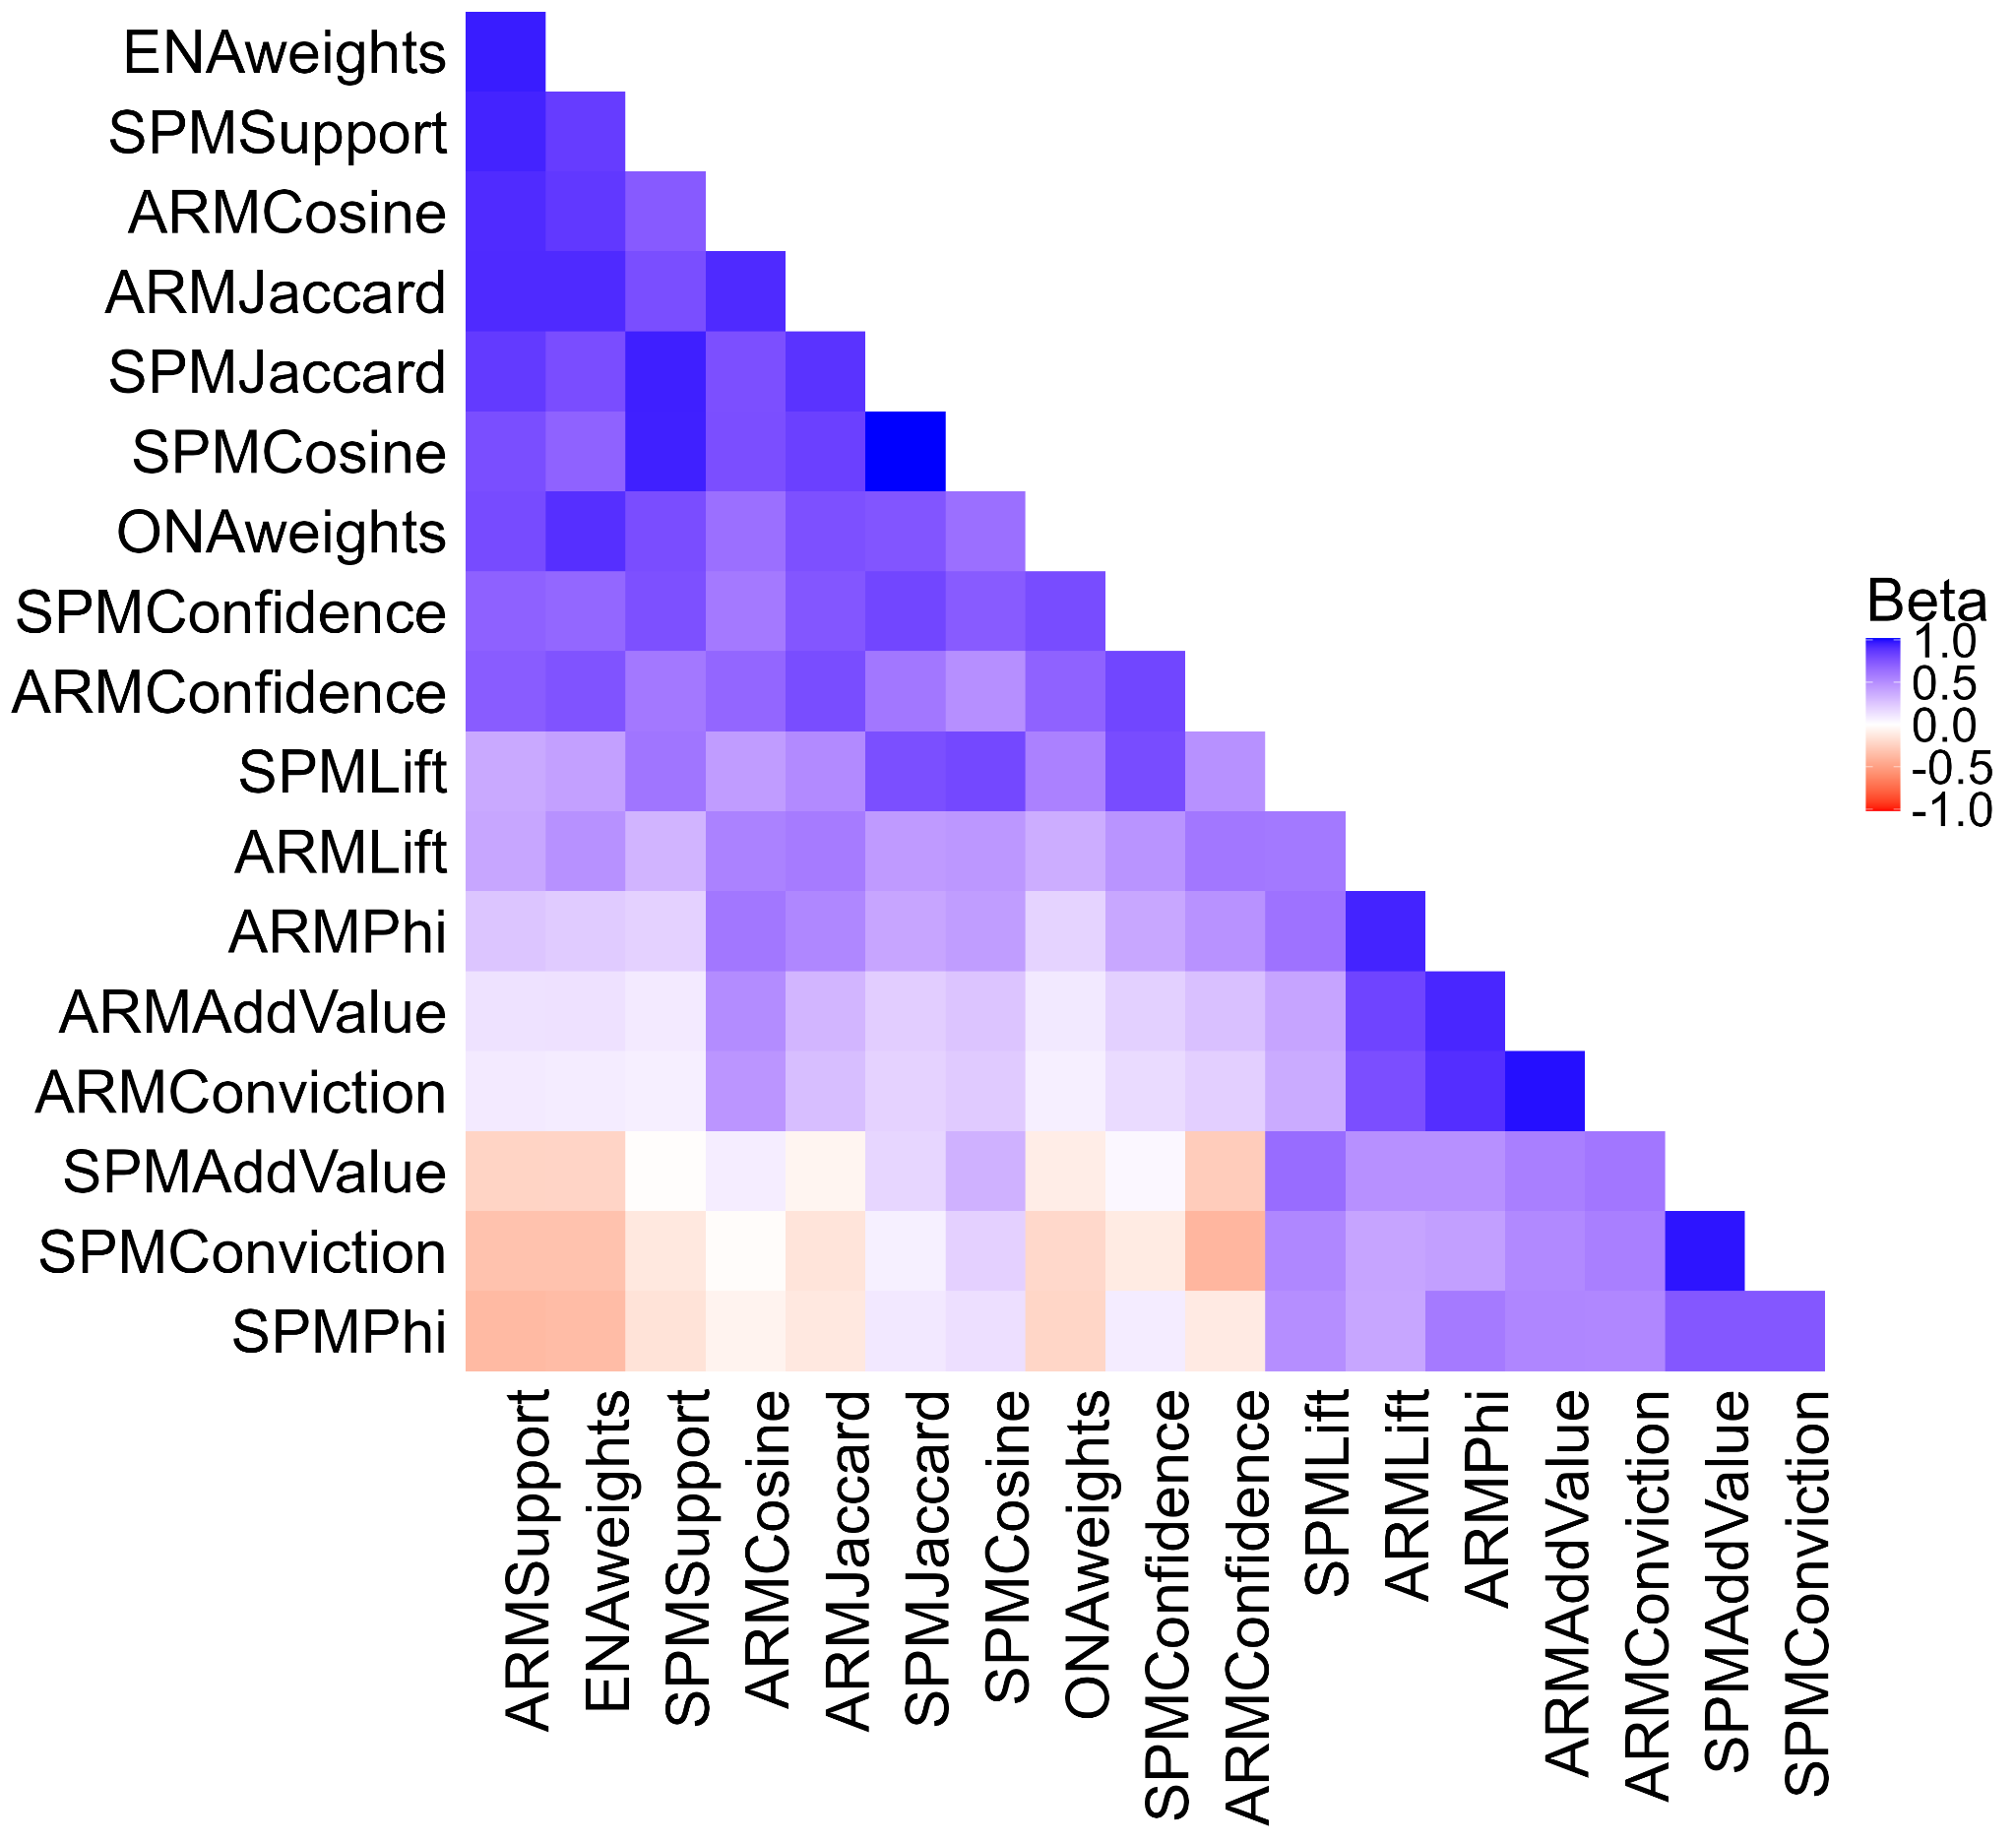
In particular, Support, Confidence, Cosine, and Jaccard (for both ARM and SPM), as well as ENA and ONA connection weights, are strongly associated with one another, indicating a tendency to highlight similar patterns. In contrast, Added Value, Conviction, and Phi exhibit negative associations with this group of metrics when computed in the context of SPM, and exhibit near-zero associations when computed for ARM. Lift occupies an intermediate position, showing moderate associations with Phi as well as with Cosine, but not reaching the same level of strong association observed within either of the two main clusters of measures. These results show that Added Value, Conviction, and Phi emphasize patterns that differ systematically from those highlighted by the remaining measures.
We further demonstrate the distinctions in these metrics by examining the details of the baseline probabilities associated with each metric. Table 3 reports the average base rates of the antecedent (P(X)), the consequent (P(Y)), their co-occurrence (P(XY)), the conditional probability of the consequent given the antecedent (P(Y|X)), and the ratio (Lift) of the joint probability (P(XY)) to the product of the individual probabilities (P(X)P(Y)) for the top 10 rules identified by each method and metric (i.e., the highest-scoring rules per metric). Multiple threshold values were tested (e.g., top 5 rules to top 20), yielding consistent results. Across the combined top-10 lists from the 18 methods and metrics considered, 31 unique patterns were identified, with most appearing among the top-ranked rules for at least 12 methods. Antecedent and consequent base rates ranged from 0.22 to 0.44, co-occurrence probabilities ranged from 0.08 to 0.16, and Lift values ranged from 0.96 to 1.28, indicating that different methods emphasize patterns with distinct statistical characteristics.
As expected based on the definitions of these metrics (see [33]), methods that primarily emphasize high-frequency constructs, such as Support, ENA, and ONA Connection Weights, tend to highlight rules in which both the antecedent and the consequent had relatively high base rates. In contrast, metrics such as Lift, Phi, Added Value, and Conviction did not emphasize rules composed of high base rate antecedents and consequents. Instead, these metrics tended to highlight rules in which the antecedent and consequent co-occurred in ways that were not primarily driven by their individual frequencies.
Method | Metric | P(X) | P(Y) | P(XY) | P(Y|X) | P(XY) / (P(X)P(Y)) |
|---|---|---|---|---|---|---|
ARM | Support | 0.390 | 0.390 | 0.157 | 0.411 | 1.034 |
ENA | Weights | 0.387 | 0.387 | 0.157 | 0.400 | 1.047 |
ONA | Weights | 0.407 | 0.385 | 0.155 | 0.381 | 0.988 |
SPM | Support | 0.410 | 0.360 | 0.153 | 0.373 | 1.032 |
ARM | Cosine | 0.360 | 0.360 | 0.152 | 0.423 | 1.167 |
ARM | Jaccard | 0.360 | 0.360 | 0.152 | 0.423 | 1.167 |
SPM | Jaccard | 0.387 | 0.354 | 0.149 | 0.397 | 1.085 |
SPM | Cosine | 0.391 | 0.348 | 0.149 | 0.385 | 1.094 |
SPM | Confidence | 0.343 | 0.371 | 0.144 | 0.421 | 1.134 |
ARM | Confidence | 0.302 | 0.439 | 0.135 | 0.440 | 1.016 |
SPM | Lift | 0.337 | 0.325 | 0.132 | 0.396 | 1.202 |
ARM | Add. Value | 0.314 | 0.314 | 0.126 | 0.393 | 1.277 |
ARM | Conviction | 0.314 | 0.314 | 0.126 | 0.393 | 1.277 |
ARM | Lift | 0.314 | 0.314 | 0.126 | 0.393 | 1.277 |
ARM | Phi | 0.314 | 0.314 | 0.126 | 0.393 | 1.277 |
SPM | Phi | 0.272 | 0.305 | 0.092 | 0.335 | 1.102 |
SPM | Conviction | 0.367 | 0.221 | 0.081 | 0.221 | 1.003 |
SPM | Add. Value | 0.376 | 0.223 | 0.081 | 0.220 | 0.964 |
Consistent with its definition, Confidence emphasizes rules in which the consequent (Y), but not necessarily the antecedent (X), had a high base rate, reflecting its focus on maximizing the probability of the consequent given the antecedent. Notably, Cosine, although conceptually related to Lift, appeared to reflect a trade-off among these tendencies, highlighting patterns that fell between these extremes in terms of base rates and conditional relationships relative to the other metrics and methods considered.
Correlations with External Instruments
One measure of consequential validity is the degree to which the patterns identified in these metrics are associated with meaningful outcome measures. As such, Table 4 summarizes the total number of statistically significant correlations identified between each pattern mining metric and the external knowledge and motivational instruments. Correlations involving knowledge assessments administered at the beginning of the camp were grouped under the Pre-test category. Similarly, correlations involving knowledge assessments collected at the end of the camp were grouped under Post-test, and correlations related to learning gains, computed from multiple knowledge assessments, were grouped under the Learning category.
Across all motivational and knowledge measures, Support emerged as the pattern mining metric that identified the largest number of significant associations with the external instruments. Specifically, ARM Support and SPM Support yielded 143 and 142 significant correlations, respectively. These were followed by Confidence, which produced 140 significant correlations for ARM and 121 for SPM. Similarly, ONA and ENA Connection Weights showed comparatively high numbers of significant associations (127 and 120, respectively), indicating that metrics that do not adjust for code base rates were consistently related to external measures of knowledge and motivation. Notably, across all instruments, no metric outside this set of six produced the highest number of significant correlations, underscoring the consistency of these trends across external measures.
Method | Metric | Pre Test | Post Test | Learning | Initial Sit. Int. | Final Sit. Int | Self-Efficacy | Astronomy Int. | Minecraft Int. | Total |
|---|---|---|---|---|---|---|---|---|---|---|
ARM | Support | 20 | 44 | 37 | 13 | 11 | 6 | 9 | 3 | 143 |
SPM | Support | 20 | 43 | 38 | 13 | 12 | 4 | 10 | 2 | 142 |
ARM | Confidence | 17 | 44 | 40 | 16 | 10 | 5 | 7 | 1 | 140 |
ONA | Weights | 17 | 38 | 36 | 13 | 10 | 2 | 9 | 2 | 127 |
SPM | Confidence | 15 | 38 | 31 | 14 | 10 | 5 | 5 | 3 | 121 |
ENA | Weights | 22 | 40 | 32 | 8 | 8 | 2 | 6 | 2 | 120 |
SPM | Conviction | 14 | 36 | 32 | 14 | 9 | 4 | 6 | 2 | 117 |
SPM | Added Value | 12 | 36 | 28 | 11 | 9 | 4 | 5 | 3 | 108 |
ARM | Jaccard | 18 | 31 | 29 | 7 | 10 | 3 | 5 | 3 | 106 |
ARM | Cosine | 17 | 26 | 32 | 4 | 9 | 3 | 8 | 3 | 102 |
SPM | Jaccard | 18 | 32 | 30 | 6 | 8 | 2 | 4 | 2 | 102 |
SPM | Cosine | 12 | 24 | 29 | 5 | 5 | 2 | 4 | 3 | 84 |
SPM | Phi | 9 | 35 | 30 | 1 | 1 | 1 | 1 | 0 | 78 |
ARM | Added Value | 11 | 22 | 18 | 1 | 2 | 2 | 3 | 0 | 59 |
ARM | Lift | 6 | 26 | 18 | 0 | 0 | 4 | 0 | 0 | 54 |
ARM | Conviction | 9 | 20 | 19 | 0 | 0 | 1 | 0 | 0 | 49 |
SPM | Lift | 6 | 18 | 14 | 0 | 3 | 5 | 1 | 1 | 48 |
ARM | Phi | 10 | 14 | 14 | 0 | 0 | 0 | 0 | 0 | 38 |
In contrast, metrics designed to adjust for base rates or to emphasize non-trivial associations were less consistently associated with the external instruments. Specifically, the Phi coefficient (38 significant correlations for ARM and 78 for SPM), Lift (54 for ARM and 48 for SPM), and the ARM versions of Conviction and Added Value (49 and 59 significant correlations, respectively) exhibited substantially fewer associations with knowledge and motivational measures, a pattern that was consistent across all instruments considered. These findings suggest that patterns involving highly frequent codes and their co-occurrences may be more strongly associated with differences in student interest, self-efficacy, prior knowledge, or learning gains, even when such patterns are partly driven by high base rates rather than strong conditional dependence. In other words, adjusting for base rates does not, in this case, appear to produce patterns that are more closely aligned with external educational measures.
It is important to note that symmetric metrics—such as Support (for ARM) and ENA Connection Weights—do not distinguish between X→Y and Y→X, unlike asymmetric metrics, including SPM-based metrics, ONA Connection Weights, and ARM metrics such as Confidence, Added Value, and Conviction. As a result, symmetric metrics inherently represent only half of the distinct directional patterns that can be identified by asymmetric rules. As noted earlier, symmetric rules were therefore counted twice when tallying significant correlations to ensure comparability with asymmetric metrics.
Notably, after applying this adjustment, ARM Support and ENA Connection Weights yielded totals of significant associations that were nearly identical (and even greater for the case of Support) to those obtained using asymmetric metrics such as SPM-based metrics, Confidence, and ONA Connection Weights. This pattern suggests that incorporating temporal ordering (as in SPM and ONA), or conditional directionality (as captured by Confidence), does not necessarily provide substantial additional information beyond what is already captured by co-occurrence alone, at least with respect to associations with external measures. In the context of this data set, the primary relationships between codes and educational constructs appear to be driven more by co-occurrence than by the direction or temporal ordering of events.
Human Ratings Results
Finally, we examine which patterns were rated as important by expert human judges. Table 5 presents the number of significant correlations identified by each method among the top 10% of correlations rated as most theoretically aligned and interesting by human raters. Due to tied ratings, this resulted in 38 correlations rated as most theoretically aligned (average score 4.67) and 22 correlations rated as most interesting (average score 4.00). The table also shows how often each metric identified a significant correlation in the direction that raters judged to be theoretically aligned or interesting. Notably, ratings of theoretical alignment differed markedly from ratings of perceived interestingness (Spearman’s ρ = -0.781, p < .001) and there was no overlap between the top 10% of correlations identified for the two ratings.
Method | Metric | Theoretical Alignment | Interestingness | ||
|---|---|---|---|---|---|
Significant | Direction | Significant | Direction | ||
ARM | Support | 28 | 28 | 13 | 6 |
ONA | Weights | 26 | 26 | 10 | 5 |
ARM | Confidence | 25 | 25 | 12 | 8 |
SPM | Confidence | 25 | 25 | 13 | 9 |
SPM | Support | 25 | 25 | 13 | 5 |
ARM | Cosine | 23 | 23 | 8 | 6 |
ARM | Jaccard | 22 | 22 | 9 | 5 |
SPM | Cosine | 22 | 22 | 11 | 6 |
SPM | Jaccard | 21 | 21 | 9 | 5 |
ENA | Weights | 18 | 18 | 8 | 2 |
ARM | Lift | 9 | 5 | 13 | 10 |
ARM | Add. Value | 8 | 4 | 11 | 10 |
SPM | Add. Value | 18 | 4 | 13 | 9 |
SPM | Conviction | 18 | 4 | 15 | 10 |
SPM | Lift | 6 | 4 | 9 | 7 |
ARM | Conviction | 3 | 1 | 5 | 4 |
ARM | Phi | 6 | 1 | 7 | 7 |
SPM | Phi | 11 | 1 | 10 | 8 |
Support identified the largest number of correlations with high theoretical alignment (N = 28 for ARM and N = 25 for SPM), followed by ONA Connection Weights (N = 26), Confidence (N = 25 for both ARM and SPM), Cosine (N = 23 for ARM and N = 22 for SPM), Jaccard (N = 22 for ARM and N = 21 for SPM), and ENA connection weights (N = 18). Notably, all correlations highlighted by these methods exhibited a direction that was consistent with both theoretical expectations and raters’ judgments. These results indicate that this cluster of metrics, which also showed stronger mutual associations and similar pattern emphasis (see Section 4.1), tends to identify patterns that align closely with theory and human expectations.
In contrast, the second cluster of metrics (Added Value, Conviction, the Phi coefficient, and, to a lesser degree, Lift) tend not to highlight rules that were theoretically aligned. For example, although SPM Added Value and Conviction each identified 18 significant correlations that raters judged as theoretically aligned, only four of those correlations exhibited the expected direction.
This mismatch between the theoretically expected direction and the actual direction of the associations surfaced by this second cluster of pattern mining metrics helps explain why those associations ranked higher when they were evaluated primarily in terms of perceived interestingness rather than theoretical alignment. Added Value (N = 10 for ARM and N = 9 for SPM), Conviction (N = 10 for SPM and N = 4 for ARM), and Lift (N = 10 for ARM and N = 7 for SPM) were the metrics that identified the largest number of correlations whose direction aligned with what human raters found interesting, even when those directions did not match theoretical expectations.
All raters agreed that, beyond their specific interest in particular knowledge or motivational measures, one important reason for labeling a pattern as interesting was the surprising direction of the observed association, a finding that helps explain the negative correlation between theoretical alignment and perceived interestingness in human ratings. For example, one researcher noted: “Things I want to understand (e.g., individual movement followed by racing indicates positive [situational] interest) [were] given a 4 or 5 because I don’t know what is happening.” As such, metrics such as Added Value and Conviction appear particularly interesting because they tend to highlight patterns that deviate from researchers’ expectations and prompt further inquiry.
However, returning to the specific rule mentioned by the researcher (i.e., Individual Movement → Racing positively correlated with situational interest), this association was positive and statistically significant only when evaluated using Added Value and Conviction ( for both). In contrast, all other metrics in the first cluster (Support, Confidence, Jaccard, Cosine, and ENA and ONA Connection Weights) consistently indicated a negative association. This discrepancy raises an important question: Are the rules highlighted by certain metrics genuinely interesting and meaningful? Or are some pattern mining methods or metrics instead emphasizing misleading associations that are an artifact of their mathematical formulation?
Another result labeled as interesting by the reviewers involved the same behavioral pattern (Individual Movement → Racing) and its positive association with post-test scores. Notably, although this positive association reached statistical significance for only two metrics (Lift: and Added Value: ), all pattern mining methods and metrics agreed on the direction of the association. This finding suggests, consistent with the associations among metrics reported in Section 4.1, that pattern mining metrics are not always misaligned, but may also differ in the strength or significance with which they detect the same underlying relationship. In other words, it is perhaps not that any specific metric is “wrong,” but rather that greater agreement across metrics increases confidence that an identified correlation or pattern reflects a valid relationship.
This complementarity between metrics helps explain why, although Added Value, Conviction, and Lift often identify correlations that are rated as more interesting, they do not consistently point in the direction that researchers find meaningful. At the same time, nearly all metrics were able to identify at least some correlations that researchers rated as interesting, and all metrics also surfaced correlations whose direction conflicted with researchers’ interestingness judgments. These findings indicate that no single metric reliably captures all aspects of what researchers find interesting, and that different metrics emphasize distinct, and sometimes competing, patterns.
DISCUSSION AND CONCLUSION
Overview
Previous work has compared pattern mining metrics with human ratings of perceived interestingness [5]. This study extends that line of research by first examining how metrics from ARM, SPM, ENA, and ONA relate to one another. It then evaluates the consequential validity of each metric by analyzing the patterns they identify with respect to both their associations with external measures of motivation and knowledge and researchers’ ratings of theoretical alignment and perceived interestingness.
Although the metrics analyzed in this study generally highlighted overlapping sets of patterns, our results revealed two broad clusters. The first cluster consists of metrics that tend to emphasize relatively common and theoretically expected patterns, including Support, Confidence, Cosine, Jaccard, and ENA and ONA Connection Weights. In terms of consequential validity, these metrics accounted for the largest number of significant associations with knowledge and motivational outcomes, with Support, Confidence, and ENA and ONA Connection Weights proving particularly fruitful. In contrast, the second cluster includes metrics (Added Value, Conviction, Phi, and, to a lesser extent, Lift) that place greater emphasis on associations not primarily driven by overall frequency. These metrics tend to reveal patterns that are less theoretically expected and less prevalent overall, but that are, for the same reason, sometimes rated as more interesting by researchers.
Interpretation
ARM- and ENA-based methods have been widely used to identify the most common event or code sequences in a dataset and their associations with variables of interest in educational research. However, consistent with earlier findings [5, 19], our study shows that different metrics do not always agree and often highlight different patterns. Prior work therefore recommends that researchers proceed with caution, particularly when using metrics that distinguish between patterns driven by high base rates and those that control for base rates to reveal associations beyond statistical independence (e.g., Cosine, Lift, and Added Value; [19]). When metrics disagree, these studies emphasize the need for researchers and instructors to rely on domain knowledge and theoretical judgment when interpreting results.
This emphasis on interpretive value echoes calls in the literature that stress the importance of being able to “close the interpretive loop”—that is, to explain why a particular pattern is associated with a specific group of students or a given outcome—in order to understand the substantive meaning and real-world implications of observed patterns [27, 29].
Our findings suggest that many patterns judged to be theoretically aligned are driven largely by base rates, raising the question of whether existing theory is truly comprehensive or instead reflects primarily the most frequent patterns, potentially overlooking less common but still meaningful ones. When a pattern appears surprising to researchers, it may simply be incidental. However, if theory has been developed largely from statistical analyses that privilege high base rates, then patterns highlighted by complementary metrics may be particularly valuable for extending and refining theoretical frameworks. From this perspective, moments when different metrics yield associations pointing in opposing directions are especially important. Such discrepancies prompt deeper investigation into what each pattern mining method and metric emphasizes, how the underlying codes, labels, or events are defined, and how researchers, drawing on their theoretical knowledge and intuition [4], can determine whether a result is substantively meaningful or instead an artifact of the mathematical assumptions underlying a given method.
Limitations and Future Work
An important consideration when interpreting these findings is the granularity of the underlying data. The analyses in this study rely on a coded representation of events derived from a predefined codebook, reflecting a relatively coarse-grained abstraction of learner activity. While this abstraction supports interpretability and alignment with theoretical constructs, it may also mask finer-grained behavioral distinctions that could influence the patterns identified. In datasets with more fine-grained representations (e.g., raw clickstream or low-level interaction logs), the semantic interpretability of resulting patterns depends on how low-level events are defined and contextualized. At the same time, the number of possible itemsets typically increases with a finer granularity, expanding the pattern search space. Consequently, differences in data granularity may influence both the behavior of pattern mining metrics and the types of patterns identified as meaningful or interesting.
As a result, the findings reported here are most directly applicable to contexts in which data have been aggregated into theoretically meaningful categories. The extent to which these results generalize to datasets with different levels of granularity remains an open question. It is plausible that metrics emphasizing frequency (e.g., Support, Confidence) may identify fewer patterns or prioritize a different set of itemsets and rules in finer-grained datasets, where co-occurrences tend to be sparser and less likely to meet minimum frequency thresholds. In contrast, metrics that control for base rates (e.g., Lift, Added Value) may still highlight associations that occur infrequently but are stronger relative to their expected occurrence, as they account for the baseline frequency of individual events when evaluating associations. Future work should therefore examine how data representation choices, including levels of granularity and the type of coding scheme, interact with pattern mining methods to shape both statistical results and their interpretability.
Overall, as the field seeks to better understand how empirical methods shape theoretical interpretations (and vice versa), methodological differences represent an important area of inquiry. Our results highlight meaningful differences among metrics commonly used to analyze data patterns in the EDM community and provide empirical evidence regarding which methods may better support consequential validity. Given our findings about which metrics align to human judgments of theoretical alignment, future work should further examine the extent to which existing theoretical frameworks might benefit from expansion informed by evidence from metrics that are less likely to produce findings that align with current theory.
Additionally, recent work has proposed the use of multiverse analysis [35], in which each plausible analytic decision used to define or refine the problem space gives rise to a separate analysis, or “universe.” Although this approach was originally developed to better understand predictive modeling, it could be adapted to incorporate the multiple metrics examined in this study (e.g., ARM and SPM versus ENA and ONA). Such analyses can strengthen confidence in findings that are robust across analytic choices or help clarify why different methods lead to divergent conclusions, thereby informing which approach is most appropriate for a given research question and theoretical framework. Of course, it is rarely feasible to exhaustively explore all possible analytic paths, as illustrated by the fact that our current study does not encompass all available pattern mining approaches. Nevertheless, our results help identify a focused subset of measures (e.g., a small number of carefully chosen metrics from each identified cluster) that could be selected to support such multiverse analyses.
In conclusion, this work compares multiple pattern mining methods and metrics to illustrate how methodological choices can influence findings related to consequential validity, including associations with external learning and motivational constructs as well as expert judgments of theoretical alignment and interestingness. Our results demonstrate that no single metric is sufficient to capture the full complexity of learning phenomena (cf. [32], on explainable AI). Rather than viewing disagreements across metrics as weaknesses to be resolved, we argue that such divergences represent productive tensions that can stimulate deeper inquiry and support theoretical refinement.
ACKNOWLEDGMENTS
This work was supported by the National Science Foundation (Grant No. DRL2301173). Andres Felipe Zambrano thanks the Ministerio de Ciencia, Tecnología e Innovación and the Fulbright-Colombia commission for supporting his doctoral studies through the Fulbright-MinCiencias 2022 scholarship.
REFERENCES
- Agrawal, R., Imieliński, T. and Swami, A. 1993. Mining association rules between sets of items in large databases. Proceedings of the 1993 ACM SIGMOD International Conference on Management of Data (New York, NY, USA, 1993), 207–216.
- Agrawal, R. and Srikant, R. 1995. Mining sequential patterns. Proceedings of the Eleventh International Conference on Data Engineering (1995), 3–14.
- Andrist, S., Collier, W., Gleicher, M., Mutlu, B. and Shaffer, D. 2015. Look together: analyzing gaze coordination with epistemic network analysis. Frontiers in Psychology. Volume 6-2015, (2015).
- Arastoopour Irgens, G. and Eagan, B. 2023. The Foundations and Fundamentals of Quantitative Ethnography. Advances in Quantitative Ethnography (Cham, 2023), 3–16.
- Bazaldua, D.A.L., Baker, R. and Pedro, M.O.S. 2014. Comparing Expert and Metric-Based Assessments of Association Rule Interestingness. Educational Data Mining (2014).
- Boeder, J.D., Postlewaite, E.L., Renninger, K.A. and Hidi, S.E. 2021. Construction and validation of the Interest Development Scale. Motivation Science. 7, 1 (2021), 68–82. https://doi.org/10.1037/mot0000204.
- Bowman, D., Swiecki, Z., Cai, Z., Wang, Y., Eagan, B., Linderoth, J. and Shaffer, D.W. 2021. The Mathematical Foundations of Epistemic Network Analysis. Advances in Quantitative Ethnography (Cham, 2021), 91–105.
- Britner, S.L. and Pajares, F. 2006. Sources of science self-efficacy beliefs of middle school students. Journal of Research in Science Teaching. 43, 5 (2006), 485–499. https://doi.org/10.1002/tea.20131.
- Dubovi, I. and Tabak, I. 2021. Interactions between emotional and cognitive engagement with science on YouTube. Public Understanding of Science. 30, 6 (2021), 759–776. https://doi.org/10.1177/0963662521990848.
- Gadbury, M. 2024. Addressing Misconceptions in Science through Minecraft. Proceedings of the 18th International Conference of the Learning Sciences-ICLS 2024, pp. 1370-1373 (2024).
- Hwang, G.-J. and Hsiao, C.-L. 2003. A computer-assisted approach to diagnosing student learning problems in science courses. Journal of Information Science and Engineering. 19, 2 (2003), 229–248.
- Kinnebrew, J.S., Loretz, K.M. and Biswas, G. 2013. A contextualized, differential sequence mining method to de-rive students’ learning behavior patterns. Journal of Educational Data Mining. 5(1), (2013), 190–219.
- Lane, H.C., Gadbury, M., Ginger, J., Yi, S., Comins, N., Henhapl, J. and Rivera-Rogers, A. 2022. Triggering STEM interest with Minecraft in a hybrid summer camp. Technology, Mind, and Behavior. 3, 4 (2022). https://doi.org/10.1037/tmb0000077.
- Linnenbrink-Garcia, L., Durik, A.M., Conley, A.M.M., Barron, K.E., Tauer, J.M., Karabenick, S.A. and Harackiewicz, J.M. 2010. Measuring situational interest in academic domains. Educational and psychological measurement. 70, 4 (2010), 647–671. https://doi.org/10.1177/0013164409355699.
- LoPresto, M.C. and Murrell, S.R. 2011. An astronomical misconceptions survey. Journal of College Science Teaching. 40, 5 (2011), 14.
- Mabroukeh, N.R. and Ezeife, C.I. 2010. A taxonomy of sequential pattern mining algorithms. ACM Comput. Surv. 43, 1 (Dec. 2010). https://doi.org/10.1145/1824795.1824798.
- Martinez, R., Yacef, K., Kay, J., Al-Qaraghuli, A. and Kharrufa, A. 2011. Analysing frequent sequential patterns of collaborative learning activity around an interactive tabletop. EDM 2011 - Proceedings of the 4th International Conference on Educational Data Mining (Germany, 2011), 111–120.
- Marx, J.D. and Cummings, K. 2007. Normalized change. American Journal of Physics. 75, 1 (Jan. 2007), 87–91. https://doi.org/10.1119/1.2372468.
- Merceron, A. and Yacef, K. 2008. Interestingness Measures for Association Rules in Educational Data. Educational Data Mining (2008), 57–66.
- Merceron, A. and Yacef, K. 2004. Mining Student Data Captured from a Web-Based Tutoring Tool: Initial Exploration and Results. Journal of Interactive Learning Research. 15, 4 (Oct. 2004), 319–346.
- Mooney, C.H. and Roddick, J.F. 2013. Sequential pattern mining – approaches and algorithms. ACM Comput. Surv. 45, 2 (Mar. 2013). https://doi.org/10.1145/2431211.2431218.
- Pechenizkiy, M., Calders, T., Vasilyeva, E. and De Bra, P. 2008. Mining the student assessment data: Lessons drawn from a small scale case study. Educational Data Mining 2008 (2008).
- Perera, D., Kay, J., Koprinska, I., Yacef, K. and Zaïane, O.R. 2009. Clustering and Sequential Pattern Mining of Online Collaborative Learning Data. IEEE Transactions on Knowledge and Data Engineering. 21, 6 (2009), 759–772. https://doi.org/10.1109/TKDE.2008.138.
- Romero, C., Ventura, S. and García, E. 2008. Data mining in course management systems: Moodle case study and tutorial. Computers & Education. 51, 1 (Aug. 2008), 368–384. https://doi.org/10.1016/j.compedu.2007.05.016.
- Ruis, A.R., Rosser, A.A., Quandt-Walle, C., Nathwani, J.N., Shaffer, D.W. and Pugh, C.M. 2018. The hands and head of a surgeon: Modeling operative competency with multimodal epistemic network analysis. The American Journal of Surgery. 216, 5 (2018), 835–840. https://doi.org/10.1016/j.amjsurg.2017.11.027.
- Sadler, P.M., Coyle, H., Miller, J.L., Cook-Smith, N., Dussault, M. and Gould, R.R. 2010. The astronomy and space science concept inventory: development and validation of assessment instruments aligned with the k–12 national science standards. Astronomy Education Review. 8, 1 (2010), 010111.
- Shaffer, D.W., Collier, W. and Ruis, A.R. 2016. A Tutorial on Epistemic Network Analysis: Analyzing the Structure of Connections in Cognitive, Social, and Interaction Data. Journal of Learning Analytics. 3, 3 (Dec. 2016), 9–45. https://doi.org/10.18608/jla.2016.33.3.
- Shaffer, D.W., Hatfield, D., Svarovsky, G.N., Nash, P., Nulty, A., Bagley, E., Frank, K., Rupp, A.A. and Mislevy, R. 2009. Epistemic Network Analysis: A Prototype for 21st-Century Assessment of Learning. International Journal of Learning and Media. 1, 2 (May 2009), 33–53. https://doi.org/10.1162/ijlm.2009.0013.
- Shaffer, D.W. and Ruis, A.R. 2024. Theories All the Way Across: The Role of Theory in Learning Analytics and the Case for Unified Methods. Theory Informing and Arising from Learning Analytics. K. Bartimote, S.K. Howard, and D. Gašević, eds. Springer Nature Switzerland. 187–201.
- Siebert-Evenstone, A.L., Arastoopour Irgens, G., Collier, W., Swiecki, Z., Ruis, A.R. and Williamson Shaffer, D. 2017. In Search of Conversational Grain Size: Modeling Semantic Structure using Moving Stanza Windows. Journal of Learning Analytics. 4, 3 (Dec. 2017), 123–139. https://doi.org/10.18608/jla.2017.43.7.
- Sullivan, S., Warner-Hillard, C., Eagan, B., Thompson, R.J., Ruis, A.R., Haines, K., Pugh, C.M., Shaffer, D.W. and Jung, H.S. 2018. Using epistemic network analysis to identify targets for educational interventions in trauma team communication. Surgery. 163, 4 (2018), 938–943. https://doi.org/10.1016/j.surg.2017.11.009.
- Swamy, V., Radmehr, B., Krco, N., Marras, M. and Käser, T. 2022. Evaluating the Explainers: Black-Box Explainable Machine Learning for Student Success Prediction in MOOCs. Proceedings of the 15th International Conference on Educational Data Mining (Durham, United Kingdom, July 2022), 98–109.
- Tan, P.-N., Kumar, V. and Srivastava, J. 2002. Selecting the right interestingness measure for association patterns. Proceedings of the Eighth ACM SIGKDD International Conference on Knowledge Discovery and Data Mining (New York, NY, USA, 2002), 32–41.
- Tan, Y., Ruis, A.R., Marquart, C., Cai, Z., Knowles, M.A. and Shaffer, D.W. 2023. Ordered Network Analysis. Advances in Quantitative Ethnography (Cham, 2023), 101–116.
- Tang, Y., Harvey, E., Yao, C., Yu, R., Kizilcec, R. and Brooks, C. 2025. Understanding Predictive Models of Student Success with a Multiverse Analysis. Proceedings of the 18th International Conference on Educational Data Mining (Palermo, Italy, July 2025), 518–525.
- Tukey, J.W. 1992. The Future of Data Analysis. Breakthroughs in Statistics: Methodology and Distribution. S. Kotz and N.L. Johnson, eds. Springer New York. 408–452.
- Winne, P.H. 2020. Construct and consequential validity for learning analytics based on trace data. Computers in Human Behavior. 112, (Nov. 2020), 106457. https://doi.org/10.1016/j.chb.2020.106457.
- Zambrano, A.F., Baker, R.S., Mehta, S. and Barany, A. 2024. Epistemic Association Rule Networks: Incorporating Association Rule Mining into the Quantitative Ethnography Toolbox. Advances in Quantitative Ethnography (Cham, 2024), 3–17.
- Zambrano, A.F., Barany, A., Ocumpaugh, J., Nasiar, N., Vandenberg, J., Goslen, A., Esiason, J., Rowe, J. and Hutt, S. 2025. Unlocking Gameplay Insights with Epistemic (Ordered) Network Analysis: Understanding the Potential of Video Games to Foster Authentic Scientific Practices in STEM Education. Journal of Science Education and Technology. 31, (Mar. 2025), 1164–1177. https://doi.org/10.1007/s10956-025-10213-4.
- Zambrano, A.F., Wei, Z., Ocumpaugh, J., Barany, A., Baker, R.S., Liu, X., Zhou, Y., Paquette, L. and Ginger, J. 2026. Exploring Player Archetypes in a Minecraft-Based Learning Environment. International Journal of Serious Games. (2026), 19–40.
© 2026 Copyright is held by the author(s). This work is distributed under the Creative Commons Attribution-NonCommercial-NoDerivatives 4.0 International (CC BY-NC-ND 4.0) license.