ABSTRACT
Understanding what behavioral patterns distinguish successful from unsuccessful problem solving could inform the design of more responsive learning environments. We investigated whether keystroke dynamics during typed mathematics responses reflect differences between correct and incorrect problem solving. Because problem format may influence student engagement and solution strategies, we also examined whether these keystroke patterns vary when problems include images versus text alone. Analyzing 21,938 responses from 570 students, we found that correct responses were characterized by slower, more variable typing with greater use of revision, while incorrect responses often showed patterns suggesting minimal engagement. Responses completed in under five seconds were almost never correct, suggesting a threshold below which meaningful problem solving appears not to occur. Machine learning models achieved modest but stable performance in distinguishing correct from incorrect responses based solely on typing patterns. Counterfactual analysis indicated that these models learned theoretically sensible relationships: the behavioral changes most frequently associated with shifting predictions from incorrect to correct aligned with increased deliberation and engagement. Notably, keystroke patterns remained largely stable across different problem formats, suggesting these behavioral signals may generalize across varied task presentations. These findings contribute to understanding how typing behavior during problem solving relates to correctness.
Keywords
1. INTRODUCTION
Mathematical problem solving is widely understood as a sequential, multi-stage cognitive process [27, 32]. One of the earliest and most influential articulations of this view dates back to Pólya’s four phases—understand the problem, devise a plan, carry out the plan, and look back (evaluating the result) [27]. Each of these stages corresponds to distinct cognitive activities, ranging from initial sense-making to strategic planning, execution, and reflection. Subsequent research has further elaborated these staged models [32, 33, 34], emphasizing that effective problem solving depends not only on domain knowledge but also on strategic control over these phases. Consequently, examining how learners progress through these stages can shed light on why some responses are correct while others are not—for example, errors may arise from early misinterpretation or flawed planning, whereas success may reflect effective planning or careful review.
Because the problem-solving process is latent and multi-faceted, researchers have devised various methods to make it observable. Think-aloud protocols have been a popular approach for a few decades: students are asked to verbalize their thoughts while solving problems, providing a running transcript of their reasoning [14]. Such protocols have yielded rich insights into strategies and misconceptions. Schoenfeld [32, 33] used think-aloud data to reveal, for example, that unsuccessful solvers often fail to plan or monitor their progress, whereas expert problem solvers exhibit effective self-regulation in real time. However, think-aloud methods have well-known limitations. They are intrusive—the act of continuously verbalizing can interfere with the natural flow of thinking—and thus may alter the very process under study [30]. Ericsson [13] notes that prompting students to articulate thoughts can slow cognitive processing or cause them to oversimplify decisions. Retrospective interviews (asking students to describe their solution after the task) lack these limitations but rely on memory and can thus be inaccurate [40].
Another window into problem-solving cognition is eye-tracking, which records where and for how long a solver looks at different parts of a problem [25, 24]. Eye movements provide a fine-grained trace of attention and can indicate which information a student is focusing on or neglecting. For example, eye-tracking studies of algebra and word problems have shown that attention patterns differ between successful and unsuccessful solvers. Hegarty et al. [17] found that students who solved word problems correctly tended to form a coherent mental model of the situation, as evidenced by their gaze: they spent more time inspecting relevant relationships in the text/diagram, whereas poorer solvers often fixated on superficial keywords or numbers in a repetitive way. Similarly, Sušac et al. [36] used eye-tracking to compare novices and experts solving equations; experts had more efficient eye scans (fewer, more focused fixations), suggesting they quickly homed in on important elements, whereas novices’ eyes wandered more, indicating uncertainty. Furthermore, Schindler et al. [31] demonstrated that eye-tracking can reveal the temporal sequence of solution steps a student takes—effectively mapping out their step-by-step approach—with greater precision than think-aloud or video analysis. However, eye-tracking too has practical limitations. It requires specialized hardware and controlled settings to achieve full precision [18] and scaling it to thousands of students in real classrooms is costly and logistically complex. Moreover, while less obtrusive than think-aloud [28], the presence of equipment and the laboratory setup may still not reflect a student’s natural study environment.
Model tracing offers another method for studying students’ problem-solving processes, when conducted using cognitive architectures like ACT-R [2]. The ACT-R architecture models cognition as a sequence of production rules and memory operations, enabling fine-grained simulations of reasoning. Koedinger and MacLaren [19] developed the Early Algebra Problem Solver (EAPS), which uses ACT-R to account for both informal and formal strategies students use when solving algebra problems and to predict common patterns of error based on cognitive processes. In model-tracing, each step of a student’s process is evaluated against an expert-authored model for alignment to both correct and incorrect (buggy) reasoning [2]. However, this approach requires interfaces that explicitly reify each step of problem solving—meaning that students must type out or select every intermediate action [2]. Because this design can slow down the problem-solving experience and restrict the flexibility of students’ strategies, many intelligent tutoring systems opt not to use this level of fine-grained model tracing [1].
In today’s computer-based learning platforms, every student interaction can be logged [26, 11, 37]. This can (but often does not) include keystroke data—the sequence of keys pressed, along with timing information—when students type out responses. Such keystroke dynamics are an increasingly attractive source of cognitive process data in education because they are captured naturally, at scale, with minimal intrusion [15, 37]. Whenever students type an answer, how they type (pauses, deletions, revisions, etc.) is being recorded behind the scenes, without requiring the student to do anything extra. This yields a high-resolution trace of the writing or problem-solving process, time-stamped to the millisecond. In contrast to one-on-one think-aloud sessions or lab eye-tracking, keystroke logging is cheap and massively scalable—it can unobtrusively collect data from an entire online class or platform with hundreds of thousands of submissions [39]. It is also ecologically valid: students solve problems in the interface as they normally would (typing their response), so the data reflect authentic behavior in situ rather than under experimental observation [21].
Research in writing and programming has demonstrated the promise of keystroke analytics for inferring cognitive processes. For example, in essay writing tasks, keystroke logs have been used to measure pausing patterns, revision frequency, and text production bursts, which correlate with writing quality and strategy use [3, 38]. Several studies have linked certain keystroke features to performance outcomes. The number of revisions (edits and deletions) and the timing of those revisions have been tied to better performance in some contexts—e.g. writers who pause to revise frequently often produce more coherent texts [35, 42]. Keystroke-derived features such as interval timings (pauses between keystrokes or between sentences) can reflect the writer’s cognitive effort or the points of difficulty [16]. Overall, prior work suggests that keystroke patterns carry informative signals about underlying cognitive processes [15].
Despite substantial prior work, gaps still remain in establishing how keystroke dynamics map to students’ problem-solving processes. Keystroke data are inherently low-level behavioral traces, and their cognitive interpretation is often ambiguous: a prolonged pause may reflect difficulty, strategic planning, or disengagement, while rapid keystroke bursts may indicate fluent execution or unproductive guessing. Prior research has attempted to disambiguate meaning by extracting extensive sets of keystroke features and examining their associations with performance and other indicators [16]. However, findings across studies show limited convergence, in part because of substantial variability in the features selected for analysis [21, 35, 11]. Moreover, Conijn et al. [11] show that relationships between keystroke features and performance outcomes are context-dependent. As a result, further empirical work is needed to examine whether keystroke dynamics reliably differentiate between processes and even between correct and incorrect problem-solving outcomes.
Conijn et al. [11] note that these relationships can differ between tasks, yet there has been insufficient examination of how the problem context or format influences keystroke patterns. Other keystroke-based studies in education have looked at relatively uniform task types within-study (e.g. essay writing, short-answer responses in text form). However, in a domain like math, tasks can vary widely. For instance, an “open-ended” response might be prompted by pure text or accompanied by a diagram or image. In such cases, the presence of a diagram or image could plausibly alter students’ engagement and problem-solving behaviour. Koedinger and Nathan [20] show that the format of a problem may shape students’ solution approaches and performance. Furthermore, Chu et al. [9] demonstrate that student strategy is impacted by the presence of diagrams. However, to our knowledge, no prior work has systematically compared keystroke dynamics between math problems with diagrams or images and those presented in text-only format.
Finally, while prior studies have generally focused on correlating specific keystroke features with performance, they rarely address the question of what changes in a student’s keystroke behavior might be associated with a higher chance of success. Identifying minimal plausible shifts in behavior—a standard step in contemporary explainable artificial intelligence research [23]—could be very valuable.
This study thus aims to advance our understanding of fine-grained keystroke dynamics in mathematical problem solving along three dimensions: association with correctness, influence of problem format, and actionable differences between success and failure. We analyze an extensive dataset of 21,938 open-ended responses collected from a widely-used online math learning platform. Each response is accompanied by detailed keystroke logs capturing the student’s typing and editing process. Our investigation centers on engineered features that quantify temporal aspects, revision behaviors, and the entropy or unpredictability of the keystroke sequence. We first examine the statistical associations between these keystroke features and answer correctness. Second, we explicitly compare image-based versus text-only questions. Third, we perform a counterfactual analysis using explainable artificial intelligence techniques to identify minimal behavioral changes associated with shifting an outcome from incorrect to correct. Aggregating such analyses over thousands of cases, we highlight which minimal changes would most frequently turn failure into success (according to the underlying machine-learned models being studied).
2. METHODS
2.1 Data
2.1.1 Source and Context
This study utilized de-identified data from an online mathematics learning platform that uses diagnostic assessment and adaptive learning pathways. The platform provides diagnostic quizzes, instructional videos, and practice activities intended to help students resolve misconceptions and improve their understanding. The learning sequence for a topic on the platform begins with five multiple-choice diagnostic questions. If a student answers a question incorrectly twice in a row, they enter a Learn phase to review worked examples and videos. Following this, the student proceeds to the Practice phase, which consists of a set of worksheet questions. Our study focuses exclusively on this Practice phase, as students provide open-ended, typed answers. These responses generate detailed keystroke logs. All personally identifiable information (PII) was removed prior to data access. The final dataset was constructed by merging several source files, including the raw keystroke logs, the students’ final answers, and the worksheet question metadata. This merging process resulted in a final dataset of 21,938 unique student–question transactions from 570 students, which was used for all subsequent analyses.
2.1.2 Correctness Labelling
The worksheet data did not include pre-existing correctness labels. The dataset provided each student’s final submitted response alongside an expert-authored reference answer. To label the data at scale, we developed an automated labeler using GPT-4o. The model was prompted, via a few-shot approach, to act as a mathematical evaluator, comparing each student’s response to the expert-authored reference. The prompt instructed the model to determine if the two answers were mathematically equivalent, providing explicit rules to accept common variations. These rules included, for example, handling commutative expressions (e.g., \(3x + 2\) vs. \(2 + 3x\)), numerical approximations, differences in formatting (e.g., £1,057.50 vs. 1057.50), and the presence or absence of units. To validate this labeler, we first established a ground truth by having two human coders independently annotate a 200-response random sample, with high inter-rater reliability (\(\kappa = 0.95\)). In the small number of cases where the humans disagreed, social moderation was used to determine a final consensus label. The GPT-4o labeler, when tested against these human labels, demonstrated excellent performance, also achieving a Cohen’s \(\kappa \) of 0.95, as well as a precision of 0.97 and a recall of 0.95. Following this successful validation, the GPT-4o labeler was used to provide correctness labels for the full dataset of 21,938 responses.
| Feature | Definition |
|---|---|
| Keystroke Edit Distance | Levenshtein distance between the full raw keystroke sequence and the final submitted answer. |
| Seconds per Keystroke | Total time spent on the response divided by total number of keystrokes. |
| Keystroke Entropy | Shannon entropy of the keystroke sequence. |
| Correction Density | Number of correction keys (Backspace, Delete) divided by log-transformed total time. |
| Correction Proportion | Number of correction keys divided by total keystrokes. |
| Keystroke Efficiency Ratio | Final answer length divided by total keystrokes. |
| Average Seconds Between Keys | Mean inter-keystroke time (seconds) for a question attempt. |
| Variation in Seconds Between Keys | Standard deviation of inter-keystroke times (seconds) for a question attempt. |
| Fast Response | Indicator variable equal to 1 if total response time \(\leq \) 5 seconds. |
| Slow Response | Indicator variable equal to 1 if total response time \(>\) 300 seconds (5 minutes). |
| Pasted | Indicator variable equal to 1 if total keystrokes exceed total seconds taken. |
| Worksheet Question Has Image | Indicator variable equal to 1 if the question has an image attached. |
| Question | HasImg | Reference Answer | Final Input | Time(sec) | Input Keystroke |
|---|---|---|---|---|---|
| Calculate 2548 \(-\) 362 | False | 2186 | 2186 | 167 | \(\leftarrow \) 218y \(\langle \)BS\(\rangle \) 6 |
2.1.3 Keystroke Data and Feature Engineering
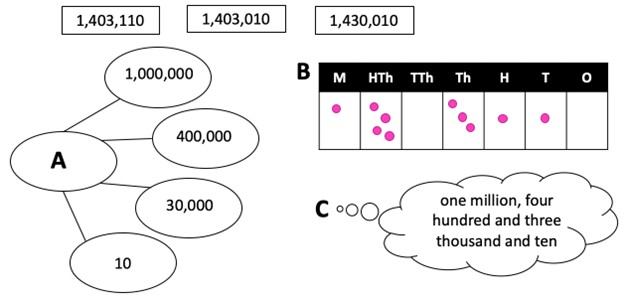
For each student response to a worksheet question, a detailed keystroke log was produced. These logs contained the sequence of key presses along with associated metadata, capturing information on timing, editing behaviors, and other aspects of the input. An illustrative example of the data captured for a single student–question response is shown in Table 2. From these raw data, we engineered a set of features to quantify the temporal (timing-related), corrective (editing-related), and compositional (content-related) aspects of the student’s typing activity. These were analyzed alongside contextual data for each problem, including a feature indicating whether the question contained an image (see Figure 1 for an example). A summary of all engineered features, including their definitions is provided in Table 1. The distribution of the target label (correctness) across the final dataset was 72% incorrect and 28% correct, while the contextual image feature was nearly balanced, with 49% of transactions pertaining to questions with images and 51% to those without.
| Feature | Correct\(_{\mathrm {Mdn}}\) | Incorrect\(_{\mathrm {Mdn}}\) | Effect size (\(\delta \)) | \(p\)-value |
|---|---|---|---|---|
| Average seconds between keys | 0.85 | 0.46 | 0.35 | \(<0.001\) |
| Seconds per keystroke | 1.25 | 2.33 | 0.31 | \(<0.001\) |
| Variation in seconds between keys | 0.68 | 0.34 | 0.30 | \(<0.001\) |
| Keystroke entropy | 2.00 | 2.00 | 0.13 | \(<0.001\) |
| Keystroke edit distance | 1.00 | 1.00 | 0.11 | \(<0.001\) |
| Correction density | 0.00 | 0.00 | 0.07 | \(<0.001\) |
| Correction proportion | 0.00 | 0.00 | 0.06 | \(<0.001\) |
| Keystroke efficiency ratio | 0.75 | 0.78 | \(-0.06\) | \(<0.001\) |
2.2 Analysis
As stated in Section 1, the goal of this study is to examine how fine-grained keystroke dynamics—such as typing latency, editing behaviors, and input variability—relate to answer correctness, and to identify how these process-level patterns, modulated by problem format (e.g., image vs. text), differentiate correct from incorrect problem-solving.
2.2.1 Exploratory Analysis
To investigate the relationships between student keystroke patterns, problem format, and answer correctness, we conducted a series of statistical analyses. First, to determine whether individual features were associated with the outcome, we tested each feature against the binary correctness label. We used the Mann–Whitney U test for continuous features (e.g., variation in seconds between keys) and Fisher’s Exact Test for binary categorical features (e.g., Worksheet Question Has Image, Pasted), as appropriate for each data type. Second, we conducted a separate comparison to examine whether problem format itself influenced keystroke behavior. Specifically, we used the Mann–Whitney U test to compare continuous keystroke feature distributions based on problem format alone (image vs. text-only), to determine whether the presence of an image, in isolation, was associated with different keystroke patterns.
For all statistical tests, \(p\)-values from multiple comparisons were corrected using the Benjamini–Hochberg false discovery rate (FDR) procedure. For the Mann–Whitney U tests, effect sizes were computed using Cliff’s Delta, which provides a non-parametric measure of group superiority. For the Fisher’s Exact tests, we computed the odds ratio (OR) and its 95% confidence interval to quantify the strength of each association.
2.2.2 Explanatory Analysis with Machine Learning Models
Following the exploratory analysis, which established that individual features were significantly associated with correctness, the next step was to investigate their combined and interactive effects. We therefore turned to machine learning models, whose primary function is to learn complex, non-linear, and interactive patterns from data—relationships that are not captured by the one-to-one statistical tests used in the exploratory phase. The goal of this stage was to construct and validate an explanatory model capable of capturing the underlying relationships between keystroke dynamics and correctness.
We examined several machine learning models, including Logistic Regression, Random Forest, CatBoost, and Support Vector Machine (SVM). Each model was tuned using hyperparameter optimization and evaluated using student-level five-fold cross-validation. This procedure ensured that all responses from a given student appeared exclusively in either the training or test set, thereby providing a robust estimate of generalization to unseen students.
The models were evaluated using a suite of metrics, including the area under the precision-recall curve (AUC-PR), the area under the receiver operating characteristic curve (AUC-ROC), macro-averaged F1-score, balanced accuracy (BACC) and the Matthews correlation coefficient (MCC). Within this explanatory framework, these metrics serve as goodness-of-fit measures, quantifying the extent to which the models successfully learned the underlying relationship between the features and the correctness label. We report the mean and standard deviation of each metric across the five folds to assess both average performance and model stability. Based on this evaluation, Random Forest emerged as the best-performing model and was selected for subsequent analysis.
2.2.3 Counterfactual Analysis
Using the validated Random Forest model, the final phase of the analysis focused on interpreting the specific behavioral patterns learned by the model. To achieve this, we employed Diverse Counterfactual Explanations (DiCE) [23]. DiCE is an optimization-based method that generates “what-if” scenarios by identifying the minimal and most plausible feature changes required to flip the model’s prediction to a desired class (e.g., from incorrect to correct). Unlike feature-importance methods, which provide global rankings, DiCE yields concrete, instance-level explanations of the patterns the model associates with different outcomes. Importantly, it also generates diverse explanations, enabling examination of whether multiple behavioral profiles are associated with correctness.
A key methodological decision was to restrict analysis to verifiable ground-truth cases: true positives and true negatives. Because the model is imperfect, analyzing false positives or false negatives risks interpreting model-specific artifacts rather than stable relationships in the data. By focusing exclusively on cases that the model correctly classified, we ensure that the counterfactual analysis is grounded in the strongest and most reliable portion of the learned signal.
The counterfactual analysis was conducted within the five-fold cross-validation framework. For each fold, we first identified instances belonging to a verifiable group within the test set. For each instance, we generated three diverse counterfactuals, resulting in three distinct hypothetical scenarios per student. Each scenario represents a counterfactual setting in which the student’s original feature values are minimally altered to flip the model’s prediction. For example, for a true negative instance (incorrect and predicted incorrect), we generated three plausible counterfactuals in which the prediction changed from incorrect to correct.
To ensure plausibility, all counterfactuals were constrained to lie within an allowed range of feature values, defined as the 1st to 99th percentile of the training data for continuous features. We then aggregated the feature changes required to flip predictions. For continuous features, we computed the magnitude of change and analyzed directional proportions, defined as the percentage of changes corresponding to increases versus decreases. For categorical features, we analyzed the proportion of directional transitions (e.g., \(0 \rightarrow 1\) or \(1 \rightarrow 0\)). Directional proportions were averaged across folds to produce a stable final set of results, identifying the feature changes most frequently associated with shifts in correctness.
3. RESULTS
3.1 Feature Association with Correctness
We first examined the relationship between the continuous keystroke features and correctness using the Mann–Whitney U test. The test established statistically significant differences across all eight features for correct versus incorrect responses, as shown in Table 3. Effect sizes (Cliff’s Delta) ranged from 0.06 to 0.35, reflecting small to moderate differences across features. For nearly all latency, variability, and correction features, the positive effect sizes indicate that feature values tended to be higher for correct responses than for incorrect ones. The largest effects were observed for average seconds between keys, seconds per keystroke, and variation in seconds between keys. Specifically for these latency features, the effect size range corresponds to a 65% to 68% probability—using a standard derivation of Cliff’s Delta—that a randomly selected correct response exhibits a higher feature value than an incorrect response.
| Response: | OR [95% CI] | p-value |
|---|---|---|
| FastResponse | 0.03 [0.02, 0.05] | < 0.001 |
| Pasted | 0.35 [0.31, 0.39] | < 0.001 |
| SlowResponse | 1.18 [0.96, 1.47] | 0.163 |
| WorksheetQuestionHasImage | 0.71 [0.67, 0.76] | < 0.001 |
The Fisher’s Exact Test results for the categorical features revealed several significant associations (see Table 4). The largest negative association was observed for Fast Response (OR = 0.03, \(p < 0.001\)). This categorical indicator flagged question transactions completed in five seconds or less and constituted 6% (1,209 transactions) of the total dataset. Questions answered between five seconds and five minutes served as a proxy for normal response time and were used as the comparison baseline. The probability of a fast response transaction being correct was only 1.41%, compared to the baseline correctness rate of 30%. This corresponds to a 95.3% decrease in the probability of a response being correct when completed within five seconds or less.
By contrast, Slow Response, defined as responses taking longer than five minutes, constituted 2% of the data (386 transactions) and did not differ statistically from the normal-time baseline (OR = 1.18, \(p = 0.163\)). Submitting a Pasted answer (OR = 0.35) and the presence of an image in the question (Worksheet Question Has Image, OR = 0.71) were also significantly associated with lower odds of correctness, though not as strongly as fast responses.
3.2 Impact of Problem Format on Keystroke Patterns
| Feature | With Image\(_{\text {Mdn}}\) | No Image\(_{\text {Mdn}}\) | Effect Size (\(\delta \)) | p-value |
|---|---|---|---|---|
| average seconds between keys | 0.54 | 0.61 | -0.05 | < 0.001 |
| variation in seconds between keys | 0.39 | 0.44 | -0.04 | < 0.001 |
| keystroke entropy | 2.00 | 2.00 | -0.03 | < 0.001 |
| seconds per keystroke | 2.84 | 2.75 | 0.02 | 0.073 |
| keystroke efficiency ratio | 0.75 | 0.78 | -0.02 | 0.022 |
| keystroke edit distance | 1.00 | 1.00 | -0.01 | 0.430 |
| correction density | 0.00 | 0.00 | -0.01 | 0.181 |
| correction proportion | 0.00 | 0.00 | -0.01 | 0.261 |
| Model | F1 | BACC | AUC | PR | MCC |
|---|---|---|---|---|---|
| Logistic Regression | 0.44 \(\pm \) 0.01 | 0.51 \(\pm \) 0.00 | 0.65 \(\pm \) 0.01 | 0.39 \(\pm \) 0.02 | 0.05 \(\pm \) 0.01 |
| Random Forest | 0.64 \(\pm \) 0.01 | 0.69 \(\pm \) 0.01 | 0.75 \(\pm \) 0.00 | 0.48 \(\pm \) 0.02 | 0.35 \(\pm \) 0.01 |
| CatBoost | 0.64 \(\pm \) 0.01 | 0.69 \(\pm \) 0.00 | 0.75 \(\pm \) 0.00 | 0.47 \(\pm \) 0.02 | 0.34 \(\pm \) 0.01 |
| SVM | 0.51 \(\pm \) 0.01 | 0.53 \(\pm \) 0.01 | 0.70 \(\pm \) 0.01 | 0.42 \(\pm \) 0.03 | 0.10 \(\pm \) 0.03 |
To examine whether problem format itself influenced keystroke patterns, we used the Mann–Whitney U test to compare continuous keystroke features across questions with images versus those without images (Table 5). The analysis revealed statistically significant, but negligible [22], differences in timing behaviors. Timing and variability features, including average seconds between keys (\(\delta = -0.05\)), variation in seconds between keys (\(\delta = -0.04\)), and keystroke entropy (\(\delta = -0.03\)), were all statistically significantly different between image-based and text-only questions (\(p < 0.001\)). Given the small effect sizes, these results indicate only slight shifts toward marginally faster and more regular typing on image-based questions—differences that are statistically detectable but practically inconsequential. In contrast, correction-related features (\(\delta \approx -0.01\)) were not statistically significant (e.g., keystroke edit distance, \(p = 0.43\)), suggesting that problem format did not meaningfully affect the frequency of observable typing errors.
3.3 Counterfactual Explanations of Keystroke Patterns and Correctness
The performance results for the machine-learned models, evaluated using student-level five-fold cross-validation, are presented in Table 6. Ensemble methods (Random Forest and CatBoost) substantially outperformed the simpler Logistic Regression and Support Vector Machine models across all evaluation metrics. The Random Forest classifier was selected for further analysis due to its relatively robust performance, achieving the highest or joint-highest score on every metric.
Given that the baseline for random guessing in this imbalanced dataset is the prevalence of the minority class (approximately 0.28 for the precision-recall AUC baseline), the Random Forest’s mean precision-recall AUC of \(0.48 \pm 0.02\) indicates that the model learned a moderate, generalizable signal. The balanced accuracy of 0.69 further suggests reasonable discrimination between correct and incorrect responses, corroborated by a Matthews Correlation Coefficient of 0.35. This validated Random Forest model served as the basis for the subsequent counterfactual analysis.
We used DiCE to interpret the validated Random Forest model, identifying the keystroke pattern adjustments required to change verifiably incorrect answers (true negatives) into correct ones, as well as the adjustments required to change verifiably correct answers (true positives) into incorrect ones. For the true negatives, the analysis of continuous features (Table 7) consistently showed that the model required positive-direction adjustments (increase) across all features in order to flip an incorrect prediction to correct. This finding aligns with the correlational analysis, which showed that correct responses generally exhibited higher values for nearly all continuous keystroke features. The most frequently adjusted features were timing-related: seconds per keystroke (30.4% of all counterfactuals) and average seconds between keys (25.8%). The largest median adjustments included an increase of 34.1 units for seconds per keystroke and 8.3 units for average seconds between keys. Editing and variability features were also adjusted, with keystroke entropy modified in 9.31% of counterfactuals (median change = 1.67) and keystroke edit distance in 4.89% (median change = 26.0).
The analysis of categorical transitions (Table 8) revealed that the most frequent binary change required was transitioning Fast Response from 1 to 0, occurring in 5.69% of all counterfactuals. This directly corroborates the strong negative association observed in the exploratory analysis. Additionally, the question format feature Worksheet Question Has Image was required to change from present to absent in 2.37% of counterfactuals. Other categorical transitions occurred less frequently.
The analysis of true positives identified the minimal feature adjustments required to change a verifiably correct response into an incorrect one (Tables 9 and 10). These results largely mirror the true negative findings in reverse. For continuous features, the most frequent change was a decrease in keystroke entropy (20.20% of counterfactuals, median change = \(-1.74\)). For categorical features, the most frequent transition was changing Fast Response from 0 to 1, which occurred in 18.4% of counterfactuals. This indicates that shifting a response from non-fast (i.e., baseline) to fast was often sufficient for the model to flip a correct prediction to incorrect. Consistent with the true negative results, changing Worksheet Question Has Image from absent to present occurred in 1.86% of counterfactuals. Also, transitioning Pasted from 0 to 1 occurred in 2.67% of cases.
| Feature | Proportion Increased(% ) ↑ | Proportion Decreased(% ) ↓ | Median ↑ | Median ↓ |
|---|---|---|---|---|
| average seconds between keys | 25.82 | 0.15 | 8.31 | -10.12 |
| correction density | 1.63 | 0.21 | 1.98 | -1.46 |
| correction proportion | 1.11 | 0.64 | 0.20 | -0.23 |
| keystroke edit distance | 4.89 | 0.20 | 26.00 | -19.90 |
| keystroke efficiency ratio | 4.02 | 1.25 | 0.41 | -0.34 |
| keystroke entropy | 9.31 | 0.62 | 1.67 | -0.80 |
| seconds per keystroke | 30.43 | 0.14 | 34.05 | -14.50 |
| variation in seconds between keys | 8.51 | 0.14 | 15.64 | -22.45 |
| Feature | Transition | Proportion(\(\%\)) |
|---|---|---|
| FastResponse | 0→1 | 0.03 |
| FastResponse | 1→0 | 5.69 |
| Pasted | 0→1 | 0.54 |
| Pasted | 1→0 | 0.90 |
| SlowResponse | 0→1 | 0.97 |
| SlowResponse | 1→0 | 0.03 |
| WorksheetQuestionHasImage | 0→1 | 0.41 |
| WorksheetQuestionHasImage | 1→0 | 2.37 |
4. DISCUSSION
The central question motivating this study was whether keystroke dynamics captured unobtrusively during authentic mathematics problem solving can reliably differentiate between correct and incorrect responses. Our findings provide evidence that they can: across 21,938 open-ended responses, students who answered correctly exhibited systematically different typing behaviors than those who answered incorrectly. These differences emerged consistently across multiple analytical approaches (statistical comparisons, machine-learned models of the underlying relationships, and counterfactual interpretations of those learned patterns), suggesting that the temporal and behavioral traces left during response construction carry meaningful information about problem-solving success.
Correct responses were characterized by longer inter-keystroke intervals, greater variability in typing pace, and more frequent revision activity. Effect sizes ranged from small to moderate (Cliff’s \(\delta = 0.06\) to \(0.35\)), with timing-based features showing the strongest associations. Students who typed more slowly and irregularly (pausing between keys, varying their pace, and editing their work) were more likely to submit correct answers than those who typed quickly and smoothly. What might account for these patterns? One interpretation is that slower, more variable typing reflects cognitive work happening between keystrokes: mental calculation, strategic deliberation, checking of intermediate results, or reconsideration of solution approaches. This interpretation aligns with theoretical accounts suggesting that keystroke-level information can shed light on cognitive and metacognitive processes involved in problem solving [15]. Long pauses may reflect planning or recall, while patterns of editing and revision may indicate monitoring and self-correction (behaviors associated with deliberate engagement). This interpretation is consistent with broader findings that deliberation and reflection are associated with better problem-solving outcomes. For instance, Chan et al. [8] found that middle-school students who paused longer before beginning to solve algebra problems in a learning game employed more efficient strategies, suggesting that taking time to think enhances performance. While their work examined pre-solving deliberation, our findings suggest that deliberation manifested during response construction (as slower, more variable typing with revision) similarly relates to success in open-ended mathematics problem solving.
Our results also align with work demonstrating relationships between keystroke patterns and performance outcomes across domains. In writing research, keystroke features such as revision frequency and timing have been linked to text quality [3, 38], with revision and pausing patterns differentiating more and less successful writers. In programming education, keystroke features including code editing patterns have proven informative for identifying at-risk students [7]. These findings extend to mathematics problem solving, demonstrating that typing dynamics capture aspects of cognitive engagement even in relatively brief, open-ended responses. The convergence of findings across writing, programming,and mathematics suggests that keystroke patterns may reflect domain-general characteristics of deliberate, monitored performance.
| Feature | Proportion Increased(% ) ↑ | Proportion Decreased(% ) ↓ | Median ↑ | Median ↓ |
|---|---|---|---|---|
| average seconds between keys | 5.63 | 1.98 | 9.46 | -0.94 |
| correction density | 7.00 | 0.21 | 2.25 | -0.64 |
| correction proportion | 7.20 | 0.26 | 0.40 | -0.09 |
| keystroke edit distance | 5.99 | 0.45 | 26.43 | -8.24 |
| keystroke efficiency ratio | 1.30 | 9.30 | 0.25 | -0.56 |
| keystroke entropy | 1.57 | 20.20 | 1.02 | -1.74 |
| seconds per keystroke | 4.51 | 1.93 | 37.50 | -6.02 |
| variation in seconds between keys | 7.07 | 0.49 | 18.86 | -2.84 |
| Feature | Transition | Proportion (\(\%\)) |
|---|---|---|
| FastResponse | 0→1 | 18.14 |
| Pasted | 0→1 | 2.67 |
| Pasted | 1→0 | 0.07 |
| SlowResponse | 0→1 | 1.78 |
| SlowResponse | 1→0 | 0.03 |
| WorksheetQuestionHasImage | 0→1 | 1.86 |
| WorksheetQuestionHasImage | 1→0 | 0.37 |
However, keystroke data present an inherent interpretive challenge. Unlike verbal protocols that provide direct access to students’ articulated thoughts, or eye-tracking that reveals attentional focus, keystroke logs offer only indirect behavioral evidence. A pause between keystrokes might indicate careful checking, but it also could indicate retrieval difficulty, distraction, or indecision; the data alone cannot distinguish these possibilities. Moreover, both slower typing and correct answers could be independently caused by stronger mathematical knowledge or by better self-regulation skills. Students who understand the material well might type more deliberately because they recognize the importance of checking their work, while simultaneously being more likely to arrive at correct solutions due to superior domain knowledge.
While the continuous keystroke features showed moderate associations with correctness, we observed that one categorical threshold emerged with a particularly strong association: responses completed in five seconds or less were correct only 1.41% of the time, compared to a baseline rate of 30% for responses taking between five seconds and five minutes. This represents a 95.3% reduction in the probability of correctness. This pattern is consistent with prior work demonstrating that extremely rapid responses in digital learning environments signal disengagement rather than genuine problem solving [6, 10, 41]. For instance, Beck [6] observed that extremely rapid responses in a reading tutor corresponded to chance-level performance, indicating students were guessing rather than genuinely processing the questions. Similarly, Cocea and Weibelzahl [10] found that rapid progression through learning materials without adequate time for comprehension reliably signaled disengagement across multiple e-learning platforms. Wright [41] reached comparable conclusions in non-timed formative assessments, demonstrating that responses completed in under five seconds often reflected guessing behavior that added error to ability estimates. Our results align with and extend these findings to open-ended mathematics problem solving: five seconds appears insufficient for the cognitive processes required to meaningfully engage with questions that demand calculation and written explanation. Students completing problems this quickly are almost certainly not progressing through the stages identified in classical models of mathematical problem solving (understanding, devising a plan, executing, and checking; [27, 32]). Rather, these extremely rapid responses likely represent giving up, guessing, entering placeholder text, or pattern-matching without comprehension. This stands in contrast to the deliberate engagement our data suggest characterizes successful problem solving, where students invest time in thinking through problems rather than rushing to submit responses.
The results from the counterfactual analysis further reinforced the centrality of this threshold in the model’s learned patterns. When examining what minimal changes would flip the model’s classification of an incorrect response to correct, moving students out of the fast response category occurred in 5.69% of counterfactuals. Conversely, for correct responses, transitioning into the fast response category was required in 18.4% of cases to flip the classification to incorrect, the single most common categorical change. This suggests that the five-second threshold captures a qualitatively different mode of engagement that the model learned to strongly associate with failure. Interestingly, the pattern was asymmetric for time outliers. While extremely fast responses were strongly associated with failure, extremely slow responses (greater than 5 minutes) showed no significant difference from baseline correctness. This asymmetry implies a minimum engagement threshold necessary for success (rushing through problems in seconds is almost universally associated with failure), but that additional time beyond approximately five minutes offers no systematic advantage. While deliberation is necessary, time alone does not ensure success.
Initially, we had hypothesized that problem format might influence keystroke behavior. Students responding to questions containing diagrams might type differently than those responding to text-only problems (perhaps pausing more frequently to inspect visual information or exhibiting altered pacing due to the cognitive demands of integrating visual and symbolic content). Prior research has shown that diagrams can substantially affect problem-solving strategies and performance in mathematics [9], and theories of problem representation emphasize that format fundamentally shapes solution approaches [20]. In this study, however, the keystroke patterns showed minimal variation across formats. While statistically significant differences emerged between image-based and text-only questions, effect sizes were negligible (\(\delta = -0.01\) to \(-0.05\)). Students typed marginally faster and more regularly on image-based questions, but these differences were practically trivial. Correction behaviors showed no significant variation across formats.
Problem format was, however, associated with correctness. Image-based questions had lower odds of correctness (OR \(= 0.71\), \(p < 0.001\)), and the counterfactual analysis supported this pattern. For incorrect responses, changing “Worksheet Question Has Image” from present to absent occurred in 2.37% of counterfactuals needed to flip the model’s classification to correct. For correct responses, changing from absent to present occurred in 1.86% of counterfactuals needed to flip classifications to incorrect. The model learned that image presence was associated with lower correctness. This may be because these types of problems were less familiar to students, or because translating information across formats was difficult for these students. Overall, though, while images were associated with lower correctness, they do not appear to meaningfully change how students type their responses.
The machine learning models helped us better understand the full complexity of the relationships between keystroke features and correctness. The Random Forest model achieved reasonable goodness-of-fit (balanced accuracy \(= 0.69\), MCC \(= 0.35\), AUC-PR \(= 0.48\)), indicating that it successfully learned a meaningful signal from the data. These metrics provide evidence that the model identified stable, generalizable patterns in the relationship between typing behavior and problem-solving success. This level of performance is comparable to prior work using keystroke features for educational prediction. For instance, Casey [7] found that keystroke features improved models for identifying at-risk programming students, though with similarly modest improvements over baselines. Conijn et al. [11] reported that keystroke-based models for predicting essay quality achieved only modest gains over baseline models. Our results follow this pattern: keystroke dynamics provide meaningful but incomplete signals about outcomes, suggesting that typing behavior captures some (but not all) of the factors that differentiate success from failure.
To understand the structure of these learned relationships, we again employed counterfactual analysis. For incorrect responses (true negatives), the most frequently required adjustments involved increasing timing features, particularly seconds per keystroke (median increase: 34.1 units, modified in 30.4% of counterfactuals) and average seconds between keys (median increase: 8.3 units, modified in 25.8% of counterfactuals). For correct responses (true positives), the most common changes involved decreasing keystroke entropy (median decrease: 1.74, modified in 20.2% of counterfactuals). The model therefore found that deliberate, unhurried response construction is systematically associated with correctness, while rapid, streamlined typing is associated with failure. Interpreting these counterfactuals requires care. They reveal what the model learned about the relationship between keystroke patterns and correctness (which features it weighted most heavily and what magnitude of change it considers decision-relevant) but they do not establish causal pathways or prescribe interventions. The finding that increasing seconds per keystroke by 34 units would flip many model classifications does not imply that instructing students to “type slower” would improve their answers. Instead, this association may be mediated by unmeasured cognitive processes. Slower typing might be a consequence of deeper engagement rather than a cause of it. In general, the value of counterfactual analysis lies in revealing the structure of learned relationships and identifying behavioral thresholds that most strongly differentiate success from failure. The prominence of the fast response transition and timing-related features in counterfactual examination of the Random Forest model accords with the statistical analysis and provides additional confidence that these aspects of typing behavior mark meaningful distinctions in problem-solving processes.
4.1 Limitations
Several limitations should be noted. First, our outcome measure was binary correctness, which does not capture partial understanding or the quality of reasoning. A student might produce an incorrect answer due to a minor arithmetic error despite demonstrating sound problem-solving strategies, while another might guess correctly without genuine understanding [12]. Keystroke patterns may differentially relate to these scenarios, but our analysis treated all incorrect responses the same and all correct responses the same.
Second, our counterfactual analysis relied on a machine-learned model (Random Forest) as a representation of the relationship between keystroke patterns and correctness. While this model demonstrated reasonable goodness-of-fit, it likely did not capture all relevant dependencies or interactions. The counterfactuals generated by DiCE reflect what the model learned about the data, not necessarily the true underlying relationships. Our focus on verifiable ground-truth cases (true positives and true negatives) mitigates this concern by ensuring we interpret only the strongest part of the learned signal, but the possibility remains that some identified patterns are model-specific rather than reflecting genuine behavior–outcome relationships. Replication using different modeling approaches could potentially increase certainty about these findings.
Third, the explanatory models we developed capture associations between keystroke patterns and correctness but do not establish causation. We cannot determine from these analyses whether deliberate typing behaviors contribute to correct problem solving, whether both are products of underlying cognitive or motivational factors, or whether the relationship is bidirectional.
Finally, while this study found that problem format (image-based versus text-only) did not meaningfully affect keystroke patterns, this finding should be interpreted with caution. We examined only one dimension of format variation (presence or absence of a single static image), which does not capture the full range of visual complexity that affects problem solving. Images in our dataset varied widely in their content and informational value, yet our current analysis treated all image-based problems as equivalent. More broadly, the format invariance we observed may reflect the specific nature of our dataset rather than a general principle, and the boundary conditions under which keystroke patterns remain stable across task variations remain to be established through more systematic investigation of problem characteristics.
4.2 Future Directions
While our study is fundamentally explanatory rather than predictive or interventional, the patterns we identified may inform future work in several directions. The fast response threshold, in particular, emerges as a robust behavioral marker that could potentially serve as a trigger for lightweight prompts asking students to reflect before submitting [5]. The broader pattern—that slower, more variable, more effortful typing is associated with correctness—suggests that learning environments should encourage deliberation rather than rapid response entry. However, implementing such features would require careful validation, as we cannot assume that prompting students to engage in behaviors associated with success will actually improve their performance (e.g., Roll et al. [29]).
Future research could address several limitations and open questions. First, combining keystroke data with other process measures—such as embedded probes asking students to explain their thinking, concurrent eye-tracking, or retrospective interviews—could help map particular keystroke patterns onto specific cognitive activities and disambiguate the interpretive ambiguity inherent in behavioral traces. Second, examining whether keystroke dynamics are associated with different types of errors (conceptual vs. procedural, early-stage vs. late-stage) or different qualities of correct responses (well-reasoned vs. lucky guesses, perhaps inferred through a contextual guessing model—e.g., Baker et al. [4]) could provide more nuanced understanding than our binary correctness measure allows.
Finally, cross-context replication would strengthen confidence in generalizability. Our dataset came from a single online mathematics platform serving middle school students; the extent to which these findings apply to other age groups, content areas, or learning environments remains uncertain. Different mathematical topics, problem structures, and student populations might produce different relationships between keystrokes and other constructs.
4.3 Conclusion
Keystroke dynamics reliably differentiate correct from incorrect responses in mathematics problem solving. Students who answered correctly typed more slowly, with greater variability and more frequent revision, compared to those who answered incorrectly. The strongest association involved responses completed in under five seconds, which were correct less than 2% of the time. While problem format (image versus text) was associated with correctness, it did not meaningfully affect keystroke patterns, suggesting that the behavioral indicators we identified may be reliable process signals even across different problem presentation formats. Machine learning models successfully learned the complex relationships between keystroke features and correctness (balanced accuracy = 0.69, MCC = 0.35), and counterfactual analysis revealed that timing-related features and the fast response threshold were the most decision-relevant factors in the model’s representation. These findings demonstrate that keystroke logging can reveal meaningful signals about problem-solving processes. Our results extend prior work showing that keystroke patterns inform predictions of educational outcomes, demonstrating that typing dynamics also differentiate immediate problem-solving success in mathematics. While interpretive ambiguity remains regarding the specific cognitive processes underlying different typing patterns, and causal relationships cannot be established from these analyses, this work provides empirical evidence that fine-grained behavioral traces differentiate successful from unsuccessful mathematical problem solving. Future work combining multiple process-tracing methods, exploring intervention designs, and testing generalization across contexts can build on this foundation to deepen understanding of how students think through mathematics problems.
4.4 Acknowledgments
This work was supported by the Learning Engineering Virtual Institute (LEVI)
5. REFERENCES
- V. Aleven, B. M. McLaren, J. Sewall, and K. R. Koedinger. The cognitive tutor authoring tools (ctat): Preliminary evaluation of efficiency gains. In Proceedings of the International Conference on Intelligent Tutoring Systems, pages 61–70, Berlin, Heidelberg, 2006. Springer.
- J. R. Anderson, A. T. Corbett, K. R. Koedinger, and R. Pelletier. Cognitive tutors: Lessons learned. Journal of the Learning Sciences, 4(2):167–207, 1995.
- V. M. Baaijen, D. Galbraith, and K. de Glopper. Keystroke analysis: Reflections on procedures and measures. Written Communication, 29(3):246–277, 2012.
- R. S. D. Baker, A. T. Corbett, and V. Aleven. More accurate student modeling through contextual estimation of slip and guess probabilities in Bayesian knowledge tracing. In Proceedings of the International Conference on Intelligent Tutoring Systems, pages 406–415, Berlin, Heidelberg, 2008. Springer.
- R. S. d. Baker, A. T. Corbett, K. R. Koedinger, S. Evenson, I. Roll, A. Z. Wagner, M. Naim, J. Raspat, D. J. Baker, and J. E. Beck. Adapting to when students game an intelligent tutoring system. In International conference on intelligent tutoring systems, pages 392–401. Springer, 2006.
- J. E. Beck. Engagement tracing: Using response times to model student disengagement. In C.-K. Looi, G. McCalla, B. Bredeweg, and J. Breuker, editors, Artificial Intelligence in Education: Supporting Learning through Intelligent and Socially Informed Technology, pages 88–95, Amsterdam, 2005. IOS Press.
- K. Casey. Using keystroke analytics to improve pass–fail classifiers. Journal of Learning Analytics, 4(2):189–211, 2017.
- J. Y.-C. Chan, E. R. Ottmar, and J.-E. Lee. Slow down to speed up: Longer pause time before solving problems relates to higher strategy efficiency. Learning and Individual Differences, 93:102109, 2022.
- J. Chu, B. Rittle-Johnson, and E. R. Fyfe. Diagrams benefit symbolic problem-solving. British Journal of Educational Psychology, 87(2):273–287, 2017.
- M. Cocea and S. Weibelzahl. Log file analysis for disengagement detection in e-learning environments. User Modeling and User-Adapted Interaction, 19(4):341–385, 2009.
- R. Conijn, C. Cook, M. van Zaanen, and L. Van Waes. Early prediction of writing quality using keystroke logging. International Journal of Artificial Intelligence in Education, 32(4):835–866, 2022.
- A. T. Corbett and J. R. Anderson. Knowledge tracing: Modeling the acquisition of procedural knowledge. User Modeling and User-Adapted Interaction, 4(4):253–278, 1995.
- K. A. Ericsson. Protocol analysis. In A Companion to Cognitive Science, pages 425–432. 2017.
- L. Flower and J. R. Hayes. A cognitive process theory of writing. College Composition and Communication, 32(4):365–387, 1981.
- D. Galbraith and V. M. Baaijen. Aligning keystrokes with cognitive processes in writing. In E. Lindgren and K. P. H. Sullivan, editors, Observing Writing: Insights from Keystroke Logging and Handwriting, volume 38 of Studies in Writing, pages 306–325. Brill, 2019.
- H. Guo, P. D. Deane, P. W. van Rijn, M. Zhang, and R. E. Bennett. Modeling basic writing processes from keystroke logs. Journal of Educational Measurement, 55(2):194–216, 2018.
- M. Hegarty, R. E. Mayer, and C. A. Monk. Comprehension of arithmetic word problems: A comparison of successful and unsuccessful problem solvers. Journal of Educational Psychology, 87(1):18–32, 1995.
- S. Hutt, A. Wong, A. Papoutsaki, R. S. Baker, J. I. Gold, and C. Mills. Webcam-based eye tracking to detect mind wandering and comprehension errors. Behavior Research Methods, 56(1):1–17, 2024.
- K. R. Koedinger and B. A. MacLaren. Implicit strategies and errors in an improved model of early algebra problem solving. In Proceedings of the Nineteenth Annual Conference of the Cognitive Science Society, pages 382–387. Lawrence Erlbaum Associates, 1997.
- K. R. Koedinger and M. J. Nathan. The real story behind story problems: Effects of representations on quantitative reasoning. The Journal of the Learning Sciences, 13(2):129–164, 2004.
- E. Lindgren and K. Sullivan, editors. Observing Writing: Insights from Keystroke Logging and Handwriting. Brill, Leiden, 2019.
- K. Meissel and E. S. Yao. Using cliff’s delta as a non-parametric effect size measure: An accessible web app and r tutorial. Practical Assessment, Research, and Evaluation, 29(1):2, 2024.
- R. K. Mothilal, A. Sharma, and C. Tan. Explaining machine learning classifiers through diverse counterfactual explanations. In Proceedings of the Conference on Fairness, Accountability, and Transparency, pages 607–617, 2020.
- M. Norqvist, B. Jonsson, J. Lithner, T. Qwillbard, and L. Holm. Investigating algorithmic and creative reasoning strategies by eye tracking. The Journal of Mathematical Behavior, 55:100701, 2019.
- A. Obersteiner and C. Tumpek. Measuring fraction comparison strategies with eye-tracking. ZDM Mathematics Education, 48(3):255–266, 2016.
- B. Plank. Keystroke dynamics as signal for shallow syntactic parsing. In Proceedings of COLING 2016, pages 609–619, 2016.
- G. Polya. How to Solve It: A New Aspect of Mathematical Method. Princeton University Press, Princeton, NJ, 1945.
- M. M. Porras, C. A. K. v. Campen, J. J. González-Rosa, F. L. Sánchez-Fernández, and J. I. N. Guzmán. Eye tracking study in children to assess mental calculation and eye movements. Scientific Reports, 14(1):18901, 2024.
- I. Roll, V. Aleven, B. M. McLaren, and K. R. Koedinger. Improving students’ help-seeking skills using metacognitive feedback in an intelligent tutoring system. Learning and Instruction, 21(2):267–280, 2011.
- J. E. Russo, E. J. Johnson, and D. L. Stephens. The validity of verbal protocols. Memory & Cognition, 17(6):759–769, 1989.
- M. Schindler, A. J. Lilienthal, R. Chadalavada, and M. Ögren. Creativity in the eye of the student. In Proceedings of the 40th Conference of the International Group for the Psychology of Mathematics Education, volume 4, pages 163–170, 2016.
- A. H. Schoenfeld. Mathematical Problem Solving. Elsevier, New York, 1985.
- A. H. Schoenfeld. Learning to think mathematically: Problem solving, metacognition, and sense making in mathematics. Journal of Education, 196(2):1–38, 2016.
- A. H. Schoenfeld. Why are learning and teaching mathematics so difficult? In M. Danesi, editor, Handbook of Cognitive Mathematics, pages 763–797. Springer, Cham, 2022.
- S. Sinharay, M. Zhang, and P. Deane. Prediction of essay scores from writing process and product features using data mining methods. Applied Measurement in Education, 32(2):116–137, 2019.
- A. N. Sušac, A. Bubić, J. Kaponja, M. Planinić, and M. Palmovic. Eye movements reveal students’ strategies in simple equation solving. International Journal of Science and Mathematics Education, 12(3):555–577, 2014.
- Y. Tian, S. Crossley, and L. V. Waes. The klicke corpus: Keystroke logging in compositions for knowledge evaluation. Journal of Writing Research, 17(1):23–60, 2025.
- L. Van Waes and M. Leijten. Fluency in writing: A multidimensional perspective on writing fluency applied to l1 and l2. Computers and Composition, 38:79–95, 2015.
- L. Van Waes, M. Leijten, and D. Van Weijen. Keystroke logging in writing research: Observing writing processes with inputlog. German as a Foreign Language, (2–3):41–64, 2009.
- A. Wengelin, J. Frid, R. Johansson, and V. Johansson. Combining keystroke logging with other methods. In E. Lindgren and K. Sullivan, editors, Observing Writing: Insights from Keystroke Logging and Handwriting, pages 30–49. Brill, Leiden, 2019.
- D. B. Wright. Treating rapid responses as incorrect for non-timed formative tests. Open Education Studies, 1(1):56–72, 2019.
- C. Xu. Understanding online revisions in l2 writing: A computer keystroke-log perspective. System, 78:104–114, 2018.
© 2026 Copyright is held by the author(s). This work is distributed under the Creative Commons Attribution-NonCommercial-NoDerivatives 4.0 International (CC BY-NC-ND 4.0) license.